. 2022 Apr;604(7906):525-533.
doi: 10.1038/s41586-022-04554-y. Epub 2022 Apr 6.

Brain charts for the human lifespan

R A I Bethlehem #  1   2 J Seidlitz #  3   4   5 S R White #  6   7 J W Vogel  8   9 K M Anderson  10 C Adamson  11   12 S Adler  13 G S Alexopoulos  14 E Anagnostou  15   16 A Areces-Gonzalez  17   18 D E Astle  19 B Auyeung  20   21 M Ayub  22   23 J Bae  24 G Ball  11   25 S Baron-Cohen  20   26 R Beare  11   12 S A Bedford  20 V Benegal  27 F Beyer  28 J Blangero  29 M Blesa Cábez  30 J P Boardman  30 M Borzage  31 J F Bosch-Bayard  32   33 N Bourke  34   35 V D Calhoun  36 M M Chakravarty  33   37 C Chen  38 C Chertavian  39 G Chetelat  40 Y S Chong  41   42 J H Cole  43   44 A Corvin  45 M Costantino  46   47 E Courchesne  48   49 F Crivello  50 V L Cropley  51 J Crosbie  52 N Crossley  53   54   55 M Delarue  40 R Delorme  56   57 S Desrivieres  58 G A Devenyi  59   60 M A Di Biase  51   61 R Dolan  62   63 K A Donald  64   65 G Donohoe  66 K Dunlop  67 A D Edwards  68   69   70 J T Elison  71 C T Ellis  10   72 J A Elman  73 L Eyler  74   75 D A Fair  71 E Feczko  71 P C Fletcher  76   77 P Fonagy  78   79 C E Franz  73 L Galan-Garcia  80 A Gholipour  81 J Giedd  82   83 J H Gilmore  84 D C Glahn  85   86 I M Goodyer  6 P E Grant  87 N A Groenewold  65   88 F M Gunning  89 R E Gur  8   39 R C Gur  8   39 C F Hammill  52   90 O Hansson  91   92 T Hedden  93   94 A Heinz  95 R N Henson  6   19 K Heuer  96   97 J Hoare  98 B Holla  99   100 A J Holmes  101 R Holt  20 H Huang  102   103 K Im  85   87 J Ipser  104 C R Jack Jr  105 A P Jackowski  106   107 T Jia  108   109   110 K A Johnson  86   111   112   113 P B Jones  6   77 D T Jones  105   114 R S Kahn  115 H Karlsson  116   117 L Karlsson  116   117 R Kawashima  118 E A Kelley  119 S Kern  120   121 K W Kim  122   123   124   125 M G Kitzbichler  126   6 W S Kremen  73 F Lalonde  127 B Landeau  40 S Lee  128 J Lerch  90   129   130 J D Lewis  131 J Li  132 W Liao  132 C Liston  133 M V Lombardo  20   134 J Lv  51   135 C Lynch  67 T T Mallard  136 M Marcelis  137   138 R D Markello  139 S R Mathias  85 B Mazoyer  50   140 P McGuire  54 M J Meaney  140   141 A Mechelli  142 N Medic  6 B Misic  139 S E Morgan  6   143   144 D Mothersill  145   146   147 J Nigg  148 M Q W Ong  149 C Ortinau  150 R Ossenkoppele  151   152 M Ouyang  102 L Palaniyappan  153 L Paly  40 P M Pan  154   155 C Pantelis  156   157   158 M M Park  159 T Paus  160   161 Z Pausova  52   162 D Paz-Linares  17   163 A Pichet Binette  164   165 K Pierce  48 X Qian  149 J Qiu  166 A Qiu  167 A Raznahan  127 T Rittman  168 A Rodrigue  85 C K Rollins  169   170 R Romero-Garcia  6   171 L Ronan  6 M D Rosenberg  172 D H Rowitch  173 G A Salum  174   175 T D Satterthwaite  8   9 H L Schaare  176   177 R J Schachar  52 A P Schultz  86   111   178 G Schumann  179   180 M Schöll  181   182   183 D Sharp  34   184 R T Shinohara  38   185 I Skoog  120   121 C D Smyser  186 R A Sperling  86   111   112 D J Stein  187 A Stolicyn  188 J Suckling  6   77 G Sullivan  30 Y Taki  118 B Thyreau  118 R Toro  97   189 N Traut  189   190 K A Tsvetanov  168   191 N B Turk-Browne  10   192 J J Tuulari  116   193   194 C Tzourio  195 É Vachon-Presseau  196 M J Valdes-Sosa  80 P A Valdes-Sosa  132   197 S L Valk  198   199 T van Amelsvoort  200 S N Vandekar  201   202 L Vasung  139 L W Victoria  89 S Villeneuve  139   164   165 A Villringer  28   203 P E Vértes  6   144 K Wagstyl  63 Y S Wang  204   205   206   207 S K Warfield  81 V Warrier  6 E Westman  208 M L Westwater  6 H C Whalley  188 A V Witte  28   203   209 N Yang  204   205   206   207 B Yeo  210   211   212   213 H Yun  87 A Zalesky  51   214 H J Zar  88 A Zettergren  120 J H Zhou  149   210   215 H Ziauddeen  6   77   216 A Zugman  155   217   218 X N Zuo  204   205   206   207   219 3R-BRAINAIBLAlzheimer’s Disease Neuroimaging InitiativeAlzheimer’s Disease Repository Without Borders InvestigatorsCALM TeamCam-CANCCNPCOBREcVEDAENIGMA Developmental Brain Age Working GroupDeveloping Human Connectome ProjectFinnBrainHarvard Aging Brain StudyIMAGENKNE96Mayo Clinic Study of AgingNSPNPONDPREVENT-AD Research GroupVETSAE T Bullmore  6 A F Alexander-Bloch  8   220   39
Collaborators, Affiliations

Brain charts for the human lifespan

R A I Bethlehem et al. Nature. 2022 Apr.

Erratum in

  • Publisher Correction: Brain charts for the human lifespan.
    Bethlehem RAI, Seidlitz J, White SR, Vogel JW, Anderson KM, Adamson C, Adler S, Alexopoulos GS, Anagnostou E, Areces-Gonzalez A, Astle DE, Auyeung B, Ayub M, Bae J, Ball G, Baron-Cohen S, Beare R, Bedford SA, Benegal V, Beyer F, Blangero J, Blesa Cábez M, Boardman JP, Borzage M, Bosch-Bayard JF, Bourke N, Calhoun VD, Chakravarty MM, Chen C, Chertavian C, Chetelat G, Chong YS, Cole JH, Corvin A, Costantino M, Courchesne E, Crivello F, Cropley VL, Crosbie J, Crossley N, Delarue M, Delorme R, Desrivieres S, Devenyi GA, Di Biase MA, Dolan R, Donald KA, Donohoe G, Dunlop K, Edwards AD, Elison JT, Ellis CT, Elman JA, Eyler L, Fair DA, Feczko E, Fletcher PC, Fonagy P, Franz CE, Galan-Garcia L, Gholipour A, Giedd J, Gilmore JH, Glahn DC, Goodyer IM, Grant PE, Groenewold NA, Gunning FM, Gur RE, Gur RC, Hammill CF, Hansson O, Hedden T, Heinz A, Henson RN, Heuer K, Hoare J, Holla B, Holmes AJ, Holt R, Huang H, Im K, Ipser J, Jack CR Jr, Jackowski AP, Jia T, Johnson KA, Jones PB, Jones DT, Kahn RS, Karlsson H, Karlsson L, Kawashima R, Kelley EA, Kern S, Kim KW, Kitzbichler MG, Kremen WS, Lalonde F, Landeau B, Lee S, Lerch J, Lewis JD, Li J, Liao W, Liston C, Lombardo MV, Lv J, Lynch C, Mallar… See abstract for full author list ➔ Bethlehem RAI, et al. Nature. 2022 Oct;610(7931):E6. doi: 10.1038/s41586-022-05300-0. Nature. 2022. PMID: 36151472 Free PMC article. No abstract available.

Abstract

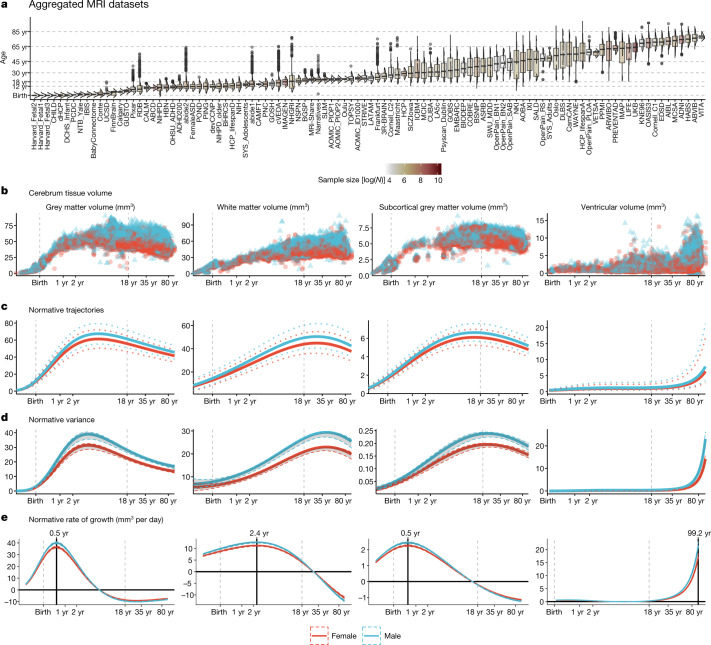
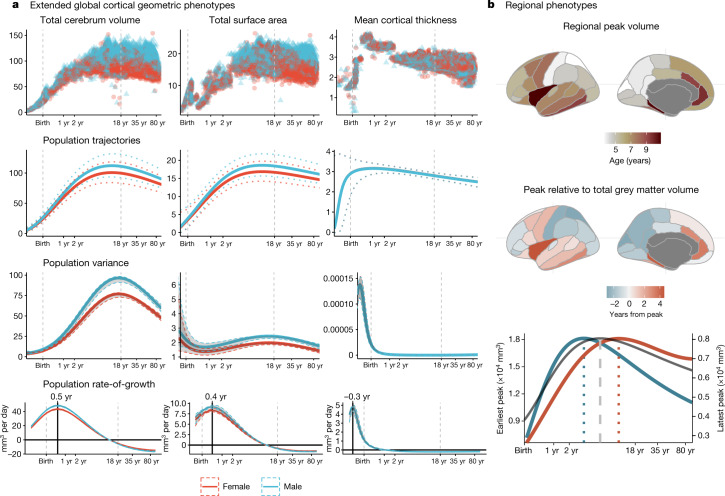
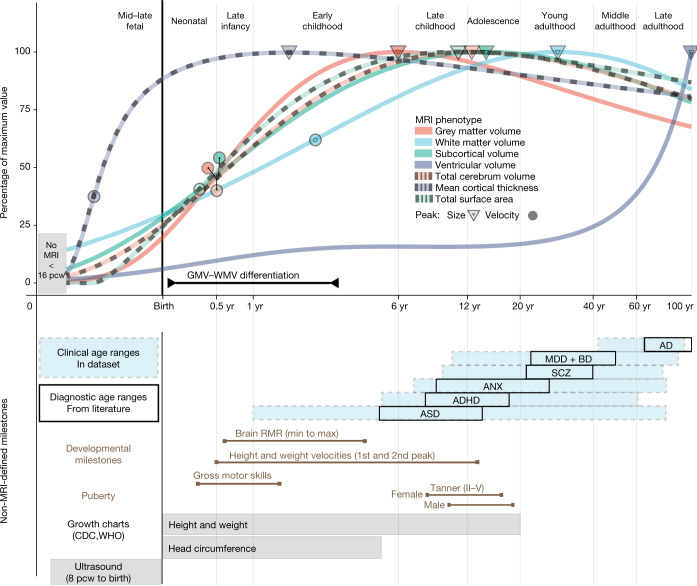
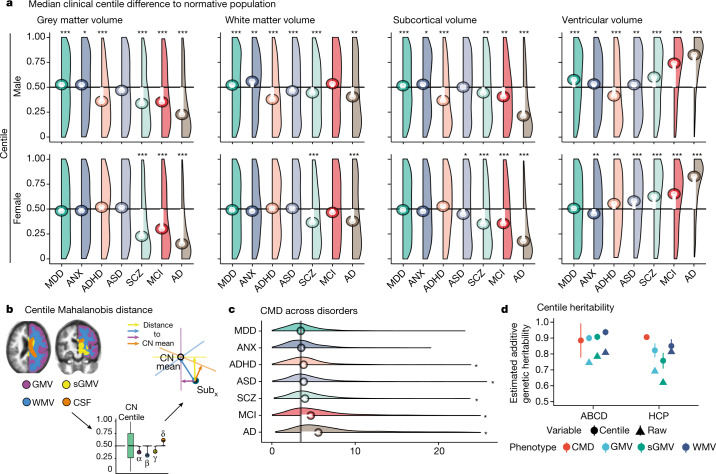
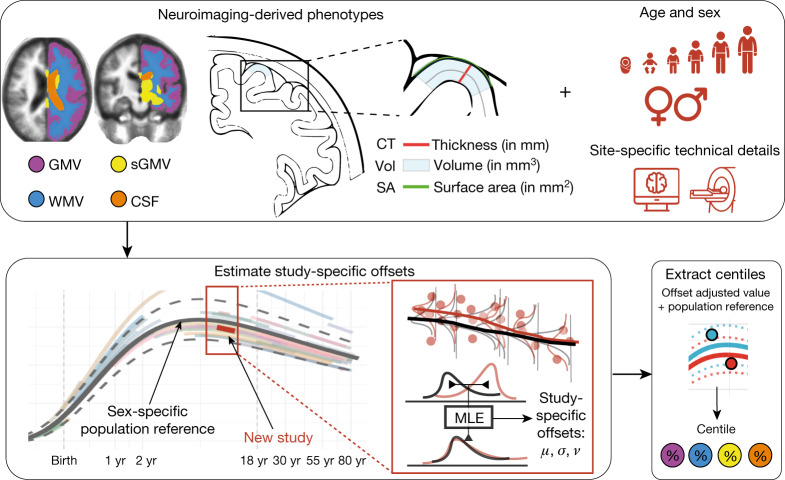
Over the past few decades, neuroimaging has become a ubiquitous tool in basic research and clinical studies of the human brain. However, no reference standards currently exist to quantify individual differences in neuroimaging metrics over time, in contrast to growth charts for anthropometric traits such as height and weight1. Here we assemble an interactive open resource to benchmark brain morphology derived from any current or future sample of MRI data ( http://www.brainchart.io/ ). With the goal of basing these reference charts on the largest and most inclusive dataset available, acknowledging limitations due to known biases of MRI studies relative to the diversity of the global population, we aggregated 123,984 MRI scans, across more than 100 primary studies, from 101,457 human participants between 115 days post-conception to 100 years of age. MRI metrics were quantified by centile scores, relative to non-linear trajectories2 of brain structural changes, and rates of change, over the lifespan. Brain charts identified previously unreported neurodevelopmental milestones3, showed high stability of individuals across longitudinal assessments, and demonstrated robustness to technical and methodological differences between primary studies. Centile scores showed increased heritability compared with non-centiled MRI phenotypes, and provided a standardized measure of atypical brain structure that revealed patterns of neuroanatomical variation across neurological and psychiatric disorders. In summary, brain charts are an essential step towards robust quantification of individual variation benchmarked to normative trajectories in multiple, commonly used neuroimaging phenotypes.


Conflict of interest statement

E.T.B. serves on the scientific advisory board of Sosei Heptares and as a consultant for GlaxoSmithKline, Boehringer Ingelheim and Monument Therapeutics. G.S.A. has served on advisory boards of Eisai and Janssen and in speakers bureaus of Allergan, Takeda and Lundbeck. K.M.A. is an employee of Neumora Therapeutics. P.B.J. has consulted for MSD. L. Palaniyappan reports personal fees from Janssen Canada for participating in an Advisory Board (2019) and Continuous Professional Development events (2017–2020), Otsuka Canada for Continuous Professional Development events (2017–2020), SPMM Course Limited, UK for preparing educational materials for psychiatrists and trainees (2010 onwards), Canadian Psychiatric Association for Continuous Professional Development events (2018–2019); book royalties from Oxford University Press (2009 onwards); institution-paid investigator-initiated educational grants with no personal remunerations from Janssen Canada, Sunovion and Otsuka Canada (2016–2019); travel support to attend a study investigator’s meeting organized by Boehringer-Ingelheim (2017); travel support from Magstim Limited (UK) to speak at an academic meeting (2014); none of these activities are related to this work. T.R. has received honoraria from Oxford Biomedica. A.P.S. has consulted for Janssen, Biogen, Qynapse, and NervGen. R.T.S. has received consulting income from Octave Bioscience and compensation for scientific review duties from the American Medical Association, the US Department of Defense, the Emerson Collective, and the National Institutes of Health. R.A.S. has consulted for Janssen, AC Immune, NervGen and Genentech. D.J.S. has received research grants and/or consultancy honoraria from Discovery Vitality, Johnson & Johnson, Lundbeck, Sanofi, Servier, Takeda and Vistagen. J. Suckling has consulted for GW Pharmaceuticals, Claritas HealthTech, Fundacion La Caixa and Fondazione Cariplo. All other authors declare no competing interests.

Figures

Fig. 1
Fig. 1. Human brain charts.
a, MRI data were aggregated from over 100 primary studies comprising 123,984 scans that collectively spanned the age range from mid-gestation to 100 postnatal years. Box–violin plots show the age distribution for each study coloured by its relative sample size (log-scaled using the natural logarithm for visualization purposes). b, Non-centiled, ‘raw’ bilateral cerebrum tissue volumes for grey matter, white matter, subcortical grey matter and ventricles are plotted for each cross-sectional control scan as a function of age (log-scaled); points are coloured by sex. c, Normative brain-volume trajectories were estimated using GAMLSS, accounting for site- and study-specific batch effects, and stratified by sex (female, red; male, blue). All four cerebrum tissue volumes demonstrated distinct, non-linear trajectories of their medians (with 2.5% and 97.5% centiles denoted as dotted lines) as a function of age over the lifespan. Demographics for each cross-sectional sample of healthy controls included in the reference dataset for normative GAMLSS modelling of each MRI phenotype are detailed in Supplementary Table 1.2–1.8. d, Trajectories of median between-subject variability and 95% confidence intervals for four cerebrum tissue volumes were estimated by sex-stratified bootstrapping (see Supplementary Information 3 for details). e, Rates of volumetric change across the lifespan for each tissue volume, stratified by sex, were estimated by the first derivatives of the median volumetric trajectories. For solid (parenchymal) tissue volumes, the horizontal line (y = 0) indicates when the volume at which each tissue stops growing and starts shrinking and the solid vertical line indicates the age of maximum growth of each tissue. See Supplementary Table 2.1 for all neurodevelopmental milestones and their confidence intervals. Note that y axes in be are scaled in units of 10,000 mm3 (10 ml).
Fig. 2
Fig. 2. Extended global and regional cortical morphometric phenotypes.
a, Trajectories for total cerebrum volume (TCV), total surface area and mean cortical thickness. For each global cortical MRI phenotype, the following sex-stratified results are shown as a function of age over the lifespan. From top to bottom: raw, non-centiled data; population trajectories of the median (with 2.5% and 97.5% centiles (dotted lines)); between-subject variance (with 95% confidence intervals); and rate of growth (the first derivatives of the median trajectory and 95% confidence intervals). All trajectories are plotted as a function of log-scaled age (x axis) and y axes are scaled in units of the corresponding MRI metrics (10,000 mm3 for TCV, 10,000 mm2 for surface area and mm for cortical thickness). b, Regional variability of cortical volume trajectories for 34 bilateral brain regions, as defined by the Desikan–Killiany parcellation, averaged across sex (see Supplementary Information 7,8 for details). Since models were generated from bilateral averages of each cortical region, the cortical maps are plotted on the left hemisphere purely for visualization purposes. Top, a cortical map of age at peak regional volume (range 2–10 years). Middle, a cortical map of age at peak regional volume relative to age at peak GMV (5.9 years), highlighting regions that peak earlier (blue) or later (red) than GMV. Bottom, illustrative trajectories for the earliest peaking region (superior parietal lobe, blue line) and the latest peaking region (insula, red line), showing the range of regional variability relative to the GMV trajectory (grey line). Regional volume peaks are denoted as dotted vertical lines either side of the global peak, denoted as a dashed vertical line, in the bottom panel. The left y axis on the bottom panel refers to the earliest peak (blue line); the right y axis refers to the latest peak (red line).
Fig. 3
Fig. 3. Neurodevelopmental milestones.
Top, a graphical summary of the normative trajectories of the median (50th centile) for each global MRI phenotype, and key developmental milestones, as a function of age (log-scaled). Circles depict the peak rate of growth milestones for each phenotype (defined by the maxima of the first derivatives of the median trajectories (Fig. 1e)). Triangles depict the peak volume of each phenotype (defined by the maxima of the median trajectories); the definition of GMV:WMV differentiation is detailed in Supplementary Information 9.1. Bottom, a graphical summary of additional MRI and non-MRI developmental stages and milestones. From top to bottom: blue shaded boxes denote the age range of incidence for each of the major clinical disorders represented in the MRI dataset; black boxes denote the age at which these conditions are generally diagnosed as derived from literature (Methods); brown lines represent the normative intervals for developmental milestones derived from non-MRI data, based on previous literature and averaged across males and females (Methods); grey bars depict age ranges for existing (World Health Organization (WHO) and Centers for Disease Control and Prevention (CDC)) growth charts of anthropometric and ultrasonographic variables. Across both panels, light grey vertical lines delimit lifespan epochs (labelled above the top panel) previously defined by neurobiological criteria. Tanner refers to the Tanner scale of physical development. AD, Alzheimer’s disease; ADHD, attention deficit hyperactivity disorder; ASD, autism spectrum disorder (including high-risk individuals with confirmed diagnosis at a later age); ANX, anxiety or phobic disorders; BD, bipolar disorder; MDD, major depressive disorder; RMR, resting metabolic rate; SCZ, schizophrenia.
Fig. 4
Fig. 4. Case–control differences and heritability of centile scores.
a, Centile score distributions for each diagnostic category of clinical cases relative to the control group median (depicted as a horizontal black line). The median deviation of centile scores in each diagnostic category is overlaid as a lollipop plot (white lines with circles corresponding to the median centile score for each group of cases). Pairwise tests for significance were based on Monte Carlo resampling (10,000 permutations) and P values were adjusted for multiple comparisons using the Benjamini–Hochberg false discovery rate (FDR) correction across all possible case–control differences. Only significant differences from the control group (CN) median (with corrected P < 0.001) are highlighted with an asterisk. For a complete overview of all pairwise comparisons, see Supplementary Information 10, Supplementary Table 3. Groups are ordered by their multivariate distance from the CN group (see c and Supplementary Information 10.3). b, The CMD is a summary metric that quantifies the aggregate atypicality of an individual scan in terms of all global MRI phenotypes. The schematic shows segmentation of four cerebrum tissue volumes, followed by estimation of univariate centile scores, leading to the orthogonal projection of a single participant’s scan (Subx) onto the four respective principal components of the CN (coloured axes and arrows). The CMD for Subx is then the sum of its distances from the CN group mean on all four dimensions of the multivariate space. c, Probability density plots of CMD across disorders. Vertical black line depicts the median CMD of the control group. Asterisks indicate an FDR-corrected significant difference from the CN group (P < 0.001). d, Heritability of raw volumetric phenotypes and their centile scores across two twin studies (Adolescent Brain Cognitive Development (ABCD) and Human Connectome Project (HCP)); Supplementary Information 19), see Supplementary Information 13 for a full overview of statistics for each individual feature in each dataset. Data are mean ± s.e.m. (although some confidence intervals are too narrow to be seen). MCI, mild cognitive impairment. See Fig. 3 for other diagnostic abbreviations. FDR-corrected significance: *P < 0.05, **P < 0.01, ***P < 0.001.
Fig. 5
Fig. 5. Schematic overview of brain charts, highlighting methods for out-of-sample centile scoring.
Top, brain phenotypes were measured in a reference dataset of MRI scans. GAMLSS modelling was used to estimate the relationship between (global) MRI phenotypes and age, stratified by sex, and controlling for technical and other sources of variation between scanning sites and primary studies. Bottom, the normative trajectory of the median and confidence interval for each phenotype was plotted as a population reference curve. Out-of-sample data from a new MRI study were aligned to the corresponding epoch of the normative trajectory, using maximum likelihood to estimate the study specific offsets (random effects) for three moments of the underlying statistical distributions: mean (μ), variance (σ), and skewness (ν) in an age- and sex-specific manner. Centile scores of each phenotype could then be estimated for each scan in the new study, on the same scale as the reference population curve, while accounting for study-specific ‘batch effects’ on technical or other sources of variation (see Supplementary Information 1.8 for details). MLE, maximum likelihood estimation.

Comment in

References

    1. Cole TJ. The development of growth references and growth charts. Ann. Hum. Biol. 2012;39:382–394. - PMC - PubMed
    1. Stasinopoulos D, Rigby R. Generalized additive models for location scale and shape (GAMLSS) in R. J. Stat. Softw. 2007;23:1–46.
    1. Gilmore JH, Knickmeyer RC, Gao W. Imaging structural and functional brain development in early childhood. Nat. Rev. Neurosci. 2018;19:123–137. - PMC - PubMed
    1. Tau GZ, Peterson BS. Normal development of brain circuits. Neuropsychopharmacology. 2010;35:147–168. - PMC - PubMed
    1. Grydeland H, et al. Waves of maturation and senescence in micro-structural MRI markers of human cortical myelination over the lifespan. Cereb. Cortex. 2019;29:1369–1381. - PMC - PubMed

Publication types

Grants and funding