Review
. 2022 Aug;97(4):1640-1676.
doi: 10.1111/brv.12856. Epub 2022 Apr 7.

From fibre to function: are we accurately representing muscle architecture and performance?

Affiliations
Review

From fibre to function: are we accurately representing muscle architecture and performance?

James Charles et al. Biol Rev Camb Philos Soc. 2022 Aug.

Abstract

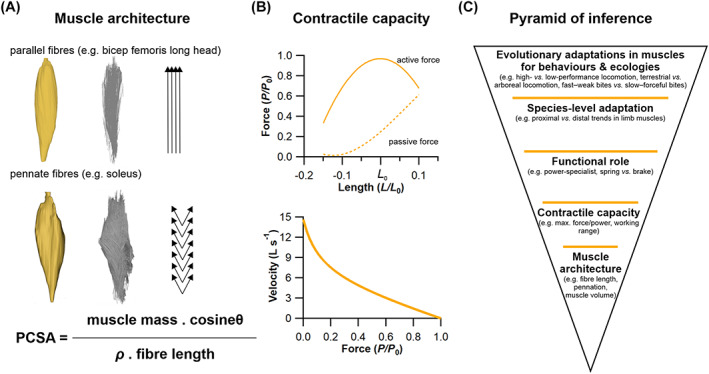
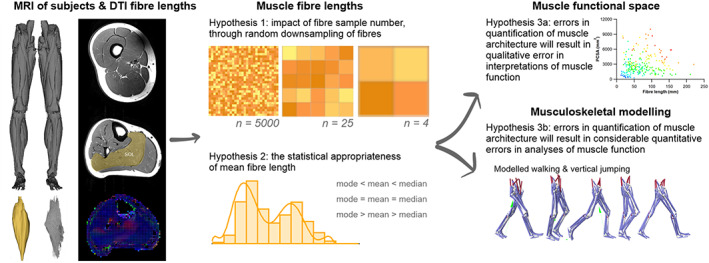
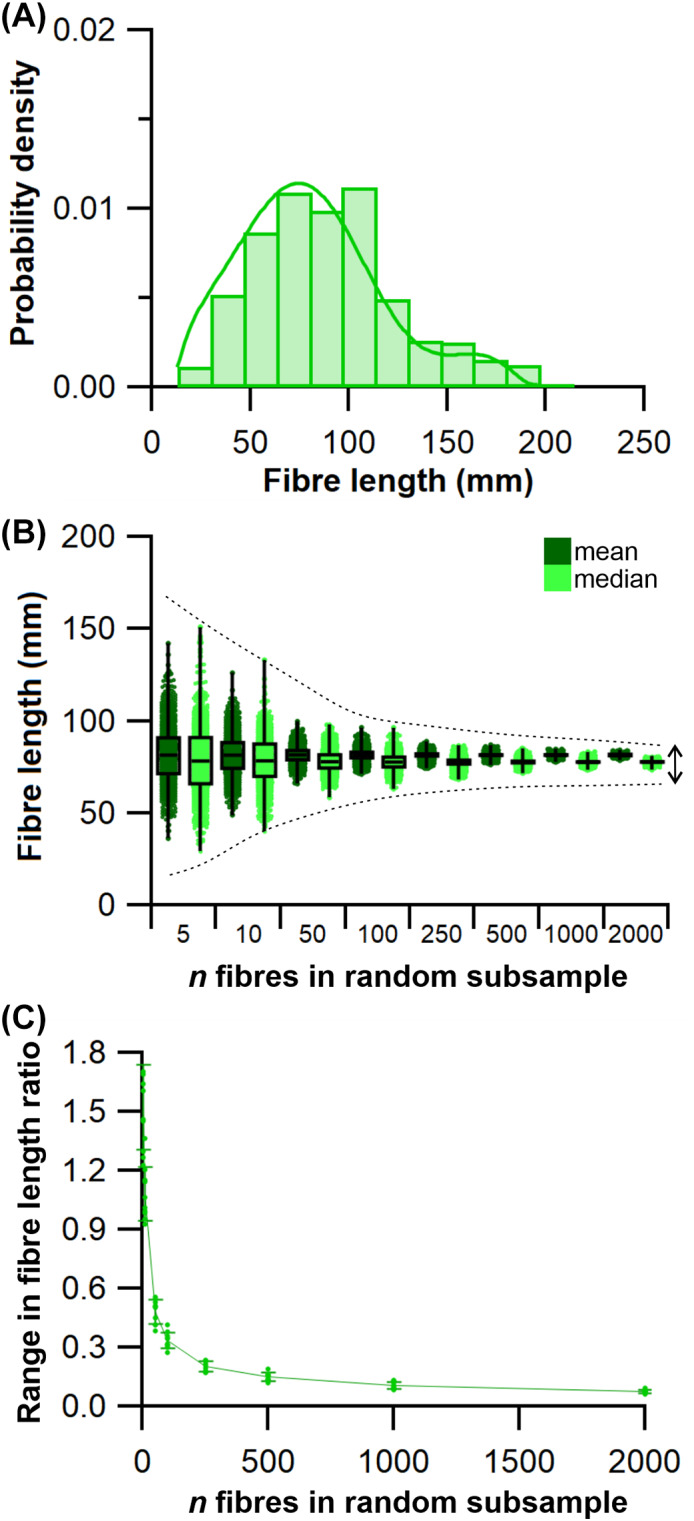
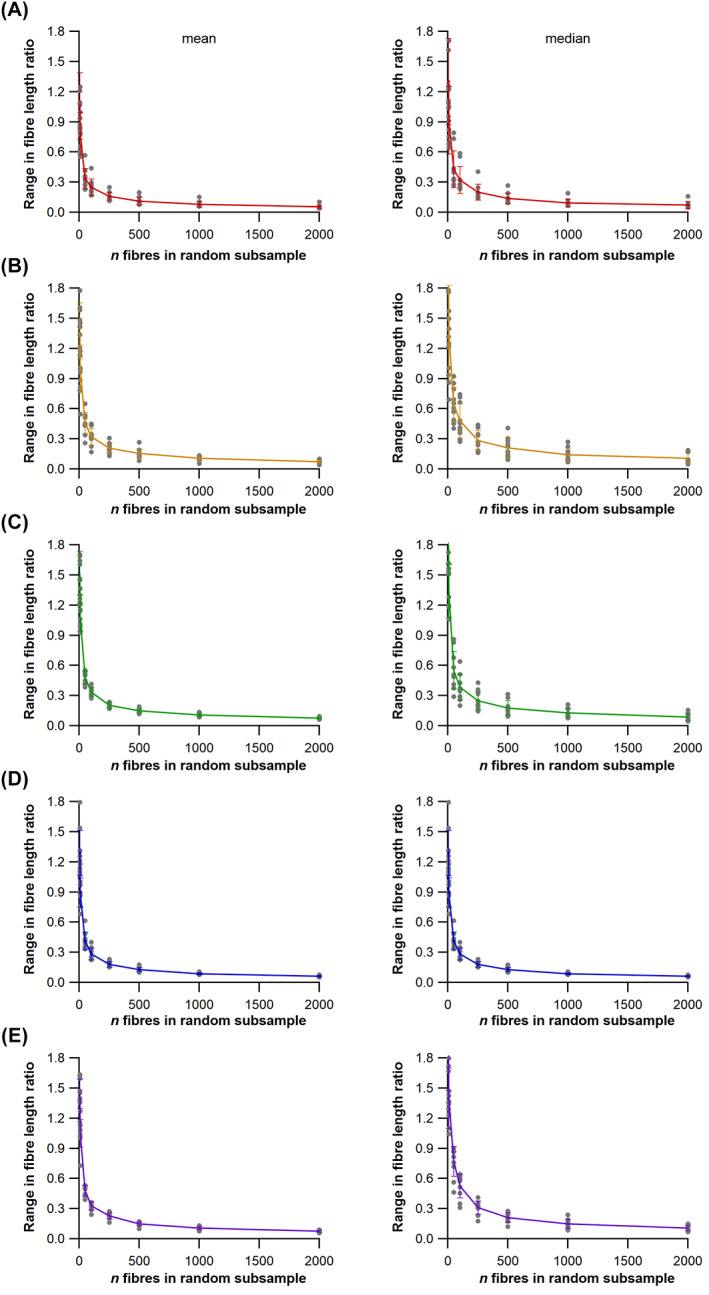
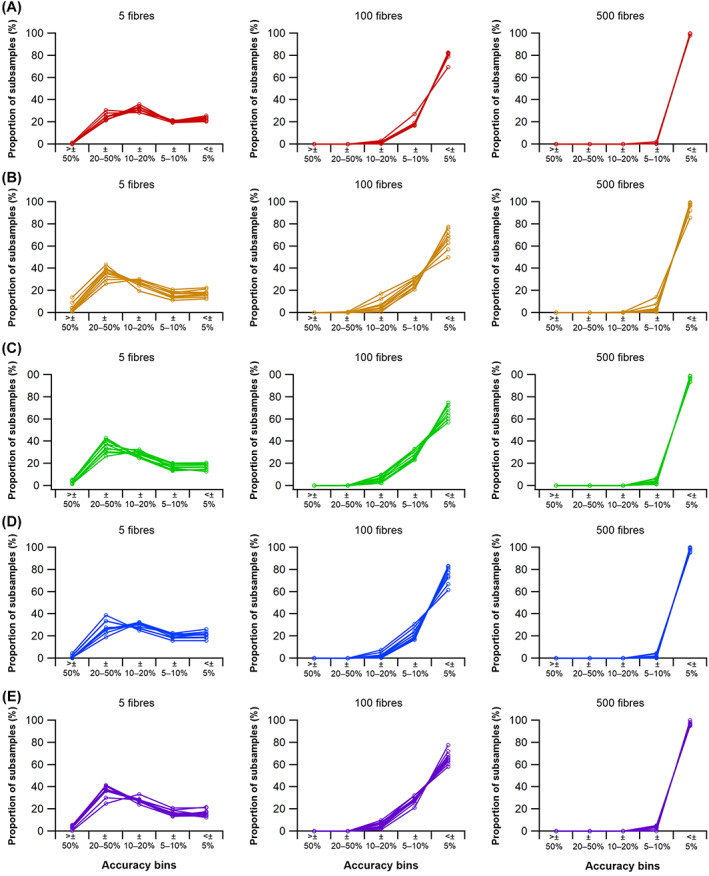
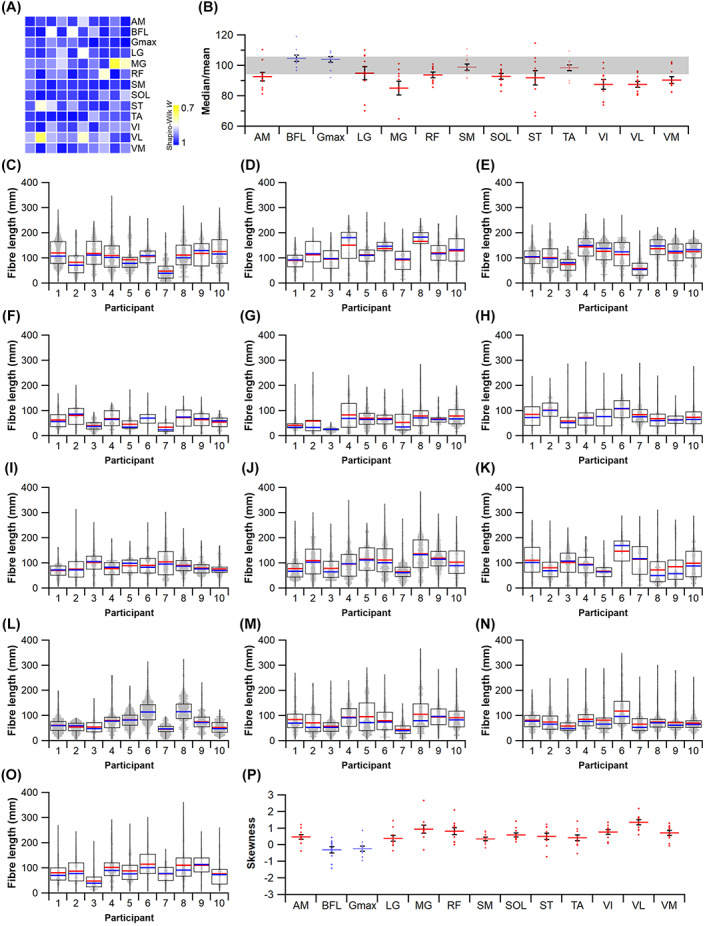
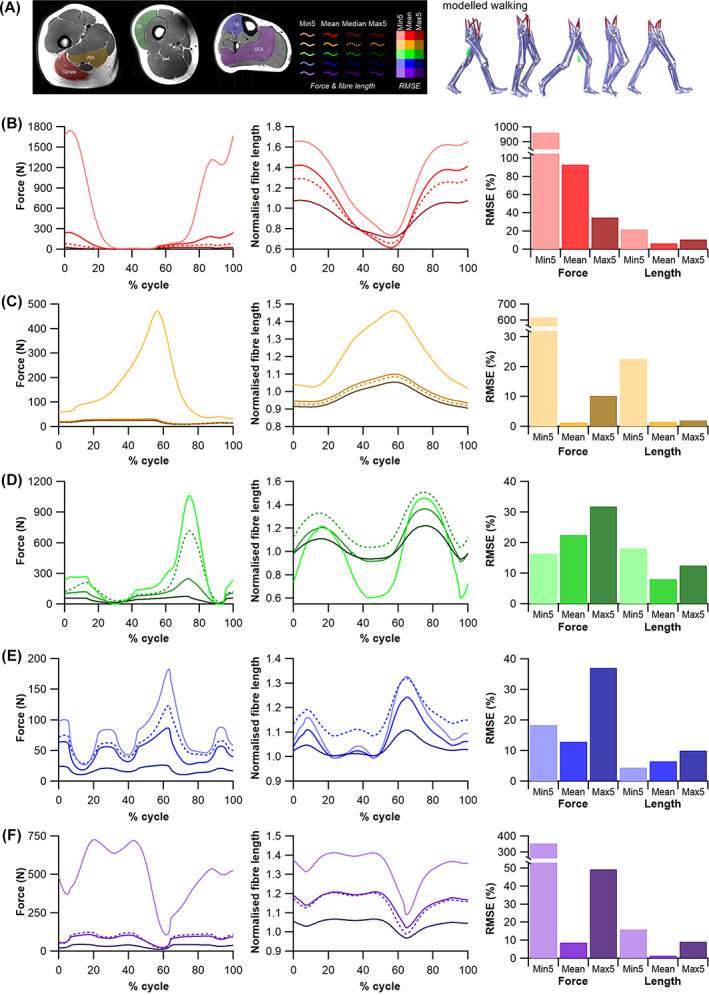
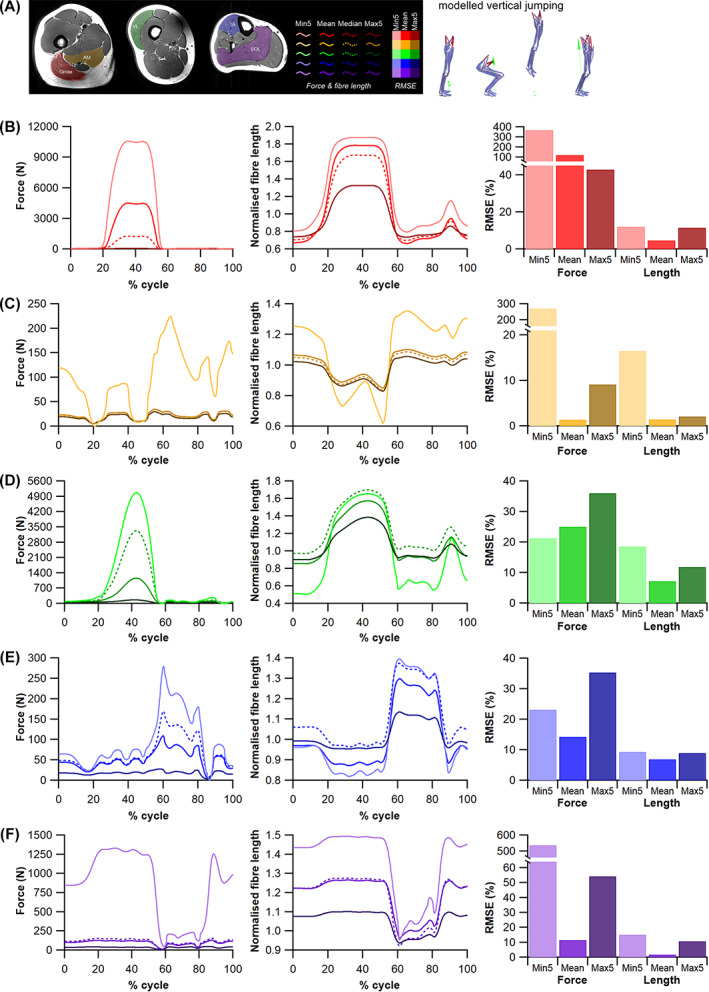
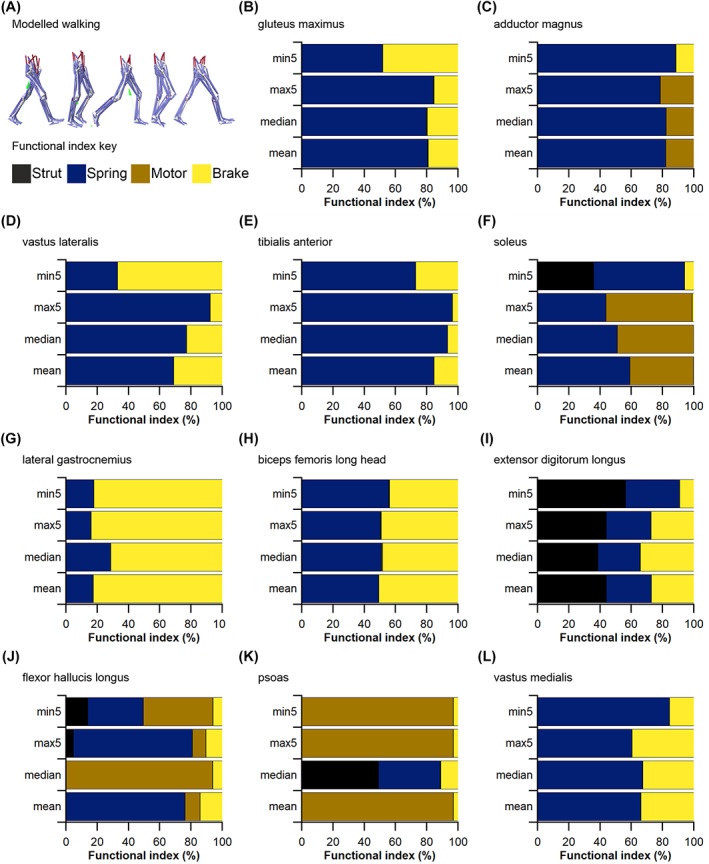
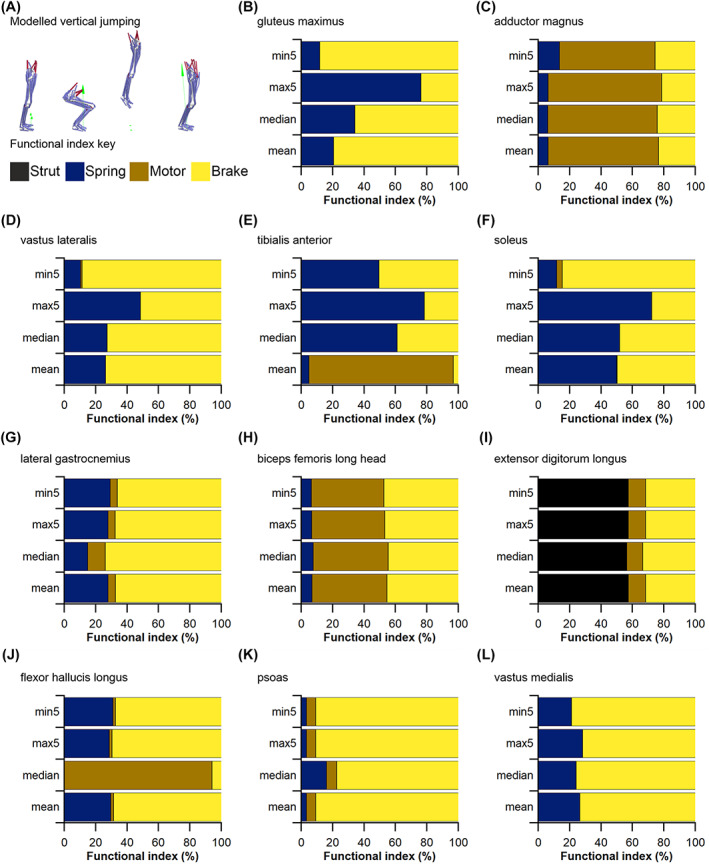
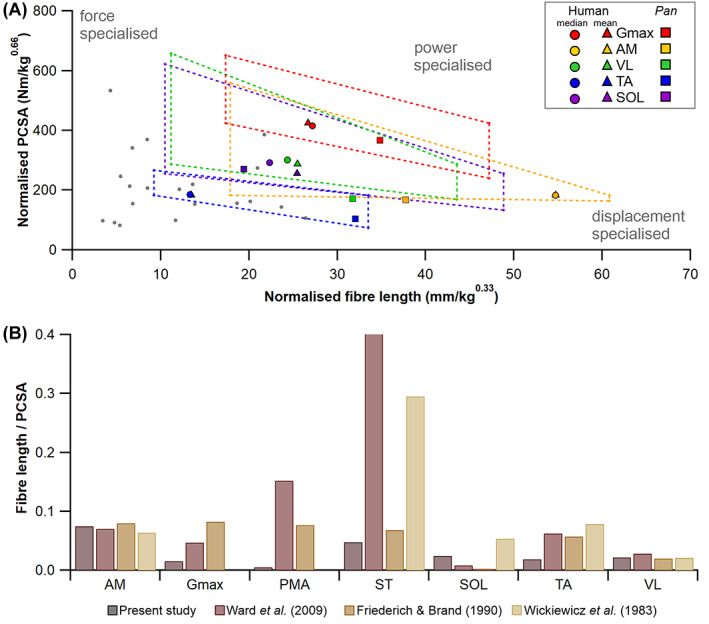
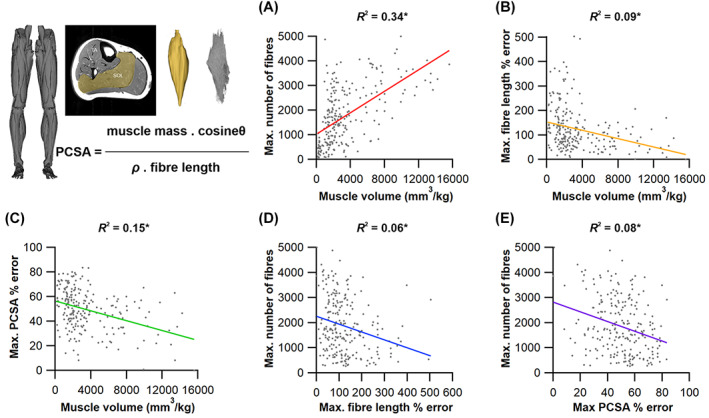
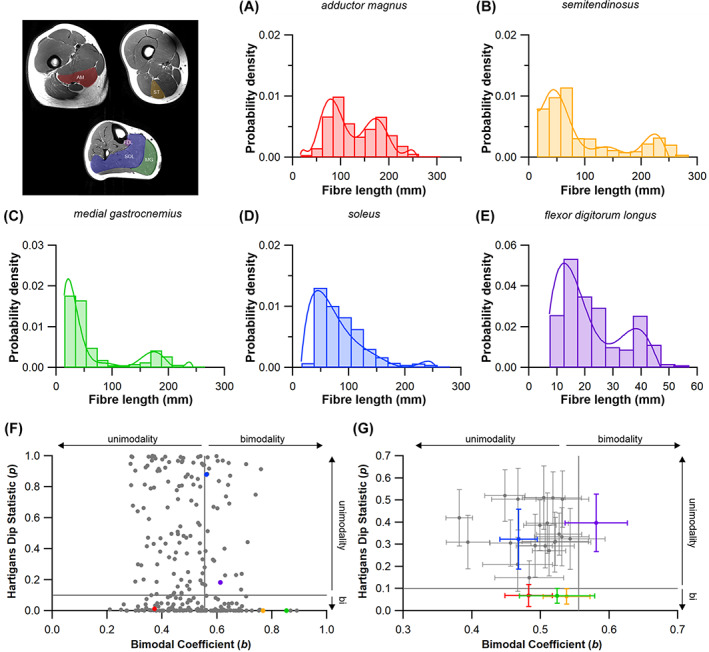
The size and arrangement of fibres play a determinate role in the kinetic and energetic performance of muscles. Extrapolations between fibre architecture and performance underpin our understanding of how muscles function and how they are adapted to power specific motions within and across species. Here we provide a synopsis of how this 'fibre to function' paradigm has been applied to understand muscle design, performance and adaptation in animals. Our review highlights the widespread application of the fibre to function paradigm across a diverse breadth of biological disciplines but also reveals a potential and highly prevalent limitation running through past studies. Specifically, we find that quantification of muscle architectural properties is almost universally based on an extremely small number of fibre measurements. Despite the volume of research into muscle properties, across a diverse breadth of research disciplines, the fundamental assumption that a small proportion of fibre measurements can accurately represent the architectural properties of a muscle has never been quantitatively tested. Subsequently, we use a combination of medical imaging, statistical analysis, and physics-based computer simulation to address this issue for the first time. By combining diffusion tensor imaging (DTI) and deterministic fibre tractography we generated a large number of fibre measurements (>3000) rapidly for individual human lower limb muscles. Through statistical subsampling simulations of these measurements, we demonstrate that analysing a small number of fibres (n < 25) typically used in previous studies may lead to extremely large errors in the characterisation of overall muscle architectural properties such as mean fibre length and physiological cross-sectional area. Through dynamic musculoskeletal simulations of human walking and jumping, we demonstrate that recovered errors in fibre architecture characterisation have significant implications for quantitative predictions of in-vivo dynamics and muscle fibre function within a species. Furthermore, by applying data-subsampling simulations to comparisons of muscle function in humans and chimpanzees, we demonstrate that error magnitudes significantly impact both qualitative and quantitative assessment of muscle specialisation, potentially generating highly erroneous conclusions about the absolute and relative adaption of muscles across species and evolutionary transitions. Our findings have profound implications for how a broad diversity of research fields quantify muscle architecture and interpret muscle function.

Keywords: biomechanics; functional morphology; locomotion; modelling; muscle; physiology.


Figures

Fig. 1
Fig. 1
The theoretical relationships between muscle fibre architecture, contractile capacity and functional inferences. (A) The architecture of skeletal muscle, also known as the arrangement of a muscle's fibres in relation to its axis of force generation, can be broadly classed as either parallel fibred, with long fibres and little to no pennation angle (θ) or internal tendon/aponeurosis, or pennate, with shorter fibres orientated at an angle to an internal aponeurosis. This architecture can have a substantial impact on a muscle's ability to produce force, which is primarily determined by its physiological cross‐sectional area (PCSA), the formulation of which depends on a muscle's mass, fibre length and density (ρ; which is considered relatively homogeneous in skeletal muscle). (B) These crucial architectural parameters have a large impact on a muscle's contractile capacity, often quantified by its force–length or force–velocity relationships, where L = length, L 0 = optimal length, P = force and P 0 = optimal force. (C) This forms the foundation of a pyramid of inference, similar to that of Witmer (1995), of muscle fibre to function, upon which predictions or observations of how a muscle functions in a dynamic context are subsequently used to infer species‐level adaptations in a muscle's function, and finally to generate hypotheses surrounding potential adaptations of a muscle across species spanning major evolutionary and/or ecological transitions.
Fig. 2
Fig. 2
The advantages of subject‐specific muscle architecture for predicting muscle functional performance. (A) In a recent study, Charles et al. (2020) created 10 subject‐specific lower limb musculoskeletal models which included individualised muscle architecture data obtained from medical imaging. Here, the accuracy of muscle torques around the hip, knee and ankle joints predicted from these models were compared to those predicted from the same models containing generic data from elderly cadaveric specimens. (B) The root mean squared (RMS) errors of the outputs from the subject‐specific models were substantially lower than those from the generic models around all joints and through all movements tested, highlighting the importance of subject‐specific muscle architecture to reflect in vivo muscle functional capacity accurately (B).
Fig. 3
Fig. 3
The concept of functional morphospace to examine muscle architectural functional specialisations. By relating the fibre length to the physiological cross‐sectional area (PCSA) of a muscle, it can be classified as either force specialised (short fibres, high PCSA), displacement specialised (long fibres, low PCSA), or power specialised (moderate to long fibres, moderate to high PCSA). Bates & Schachner (2012) found that the hip muscles of the alligator Alligator mississippiensis occupy a wider area of functional morphospace, and thus contain a wider range of architectural specialisations, than those in the ostrich Struthio camelus, (A). This pattern is reversed at the knee joint however, with the ostrich muscles displaying more adaptations for power and displacement specialisation than the alligator muscles (B). At the ankle, muscles are more force specialised in the ostrich compared to the more displacement specialised muscles of the alligator (C). Overall, these differences hint at possible adaptations of muscle architecture throughout evolutionary lineages. ADD, adductor femoris; CFL, caudofemoralis longus; FCL, flexor cruris lateralis; ILFB, iliofibularis; IT, iliotibialis.
Fig. 4
Fig. 4
A review of the number of fibres per muscle measured to calculate mean architectural properties in 243 published studies. (A) From the studies that reported the number of muscle fibres used to calculate mean fibre length, 80.8% measured fewer than 25 fibres per muscle, with 38.9% measuring 5 fibres or fewer per muscle. Only 1.8% of the papers that reported their totals used over 250 fibres. (B) In addition, 99% of the 243 papers reported the mean fibre length, while only 1% reported the median.
Fig. 5
Fig. 5
Overview of our experimental approach. T1 magnetic resonance imaging (MRI) was used to generate three‐dimensional meshes of 25 muscles of the lower limb of 10 subjects, and diffusion tensor imaging (DTI) was used to generate a sample of up to 5000 fibres from each of these muscles. To address Hypothesis 1, 1000 random subsamples of 5, 10, 50, 100, 250, 500, 1000 and 2000 fibres from the full sample were taken to assess the effect of fibre sample size on calculations of mean muscle fibre length and interpretations of functional specialisations. To address Hypothesis 2, the distributions of fibres within each muscle were assessed to quantify the statistical appropriateness of calculating mean or median fibre lengths to generate a single representative value. The functional implications of these two major assumptions often made during the collection of muscle architecture data, were tested using muscle function plots (Hypothesis 3a) to compare human and chimpanzee muscles, and musculoskeletal modelling and simulations (Hypothesis 3b), where muscle fibre dynamics during walking and jumping movements were predicted, and the potential errors introduced by these assumptions on these output metrics were calculated. PCSA, physiological cross‐sectional area; SOL, soleus.
Fig. 6
Fig. 6
An example of the approach used to quantify potential errors in fibre length measurements due to sample size. (A) Example distribution of fibre lengths within a single muscle. The distributions of fibre lengths within each muscle were studied to assess the appropriateness of calculating mean or median of these measured fibres and address Hypothesis 2 (HYP2). (B, C) Random subsamples of the full set of muscle fibres generated from diffusion tensor imaging were used to study the possible range of mean and median fibre lengths obtainable from different initial sample sizes, expressed as a fraction of the ‘true’ mean or median value, to address Hypothesis 1 (HYP1).
Fig. 7
Fig. 7
The effect of fibre number (n fibres) on mean and median fibre length. The effects on mean and median fibre length calculations from measuring random subsamples of 5, 10, 50, 100, 250, 500, 1000 and 2000 fibres from the full sample of fibres from the gluteus maximus (Gmax; A), adductor magnus (AM; B), vastus lateralis (VL; C), tibialis anterior (TA; D) and soleus (SOL; E) from all 10 subjects (lines represent data set means). For all muscles, the range of mean or median fibre lengths, expressed as a fraction of the ‘true’ mean or median value, was high in random subsamples of 5 fibres, but substantially lower in subsamples of >500 fibres.
Fig. 8
Fig. 8
The influence of fibre sample numbers on mean fibre length across 10 subjects. The percentage of mean fibre length values within random subsamples of 5, 100 and 500 fibres for the gluteus maximums (A), adductor magnus (B), vastus lateralis (C), tibialis anterior (D) and soleus (E) muscles relative to the mean value from the full set of fibres, i.e. falling within ‘accuracy bins’ indicating how close the randomly subsampled values were to the ‘true’ mean.
Fig. 9
Fig. 9
Statistical appropriateness of the use of mean fibre length. (A) Every muscle tested in this study violated the Shapiro–Wilk test for normality, indicating that no distribution of sampled fibres was normally distributed, despite a wide range of W statistics for these samples. (B) Dividing the median fibre length by the mean highlights the gross overestimation of fibre lengths when the mean is used, with data points falling outside the grey bar indicating ±5% difference from the mean. (C–O) Distributions of fibre lengths for all 10 participants across the adductor magnus (C), biceps femoris (long head) (D), gluteus maximus (E), lateral gastrocnemius (F), medial gastrocnemius (G) rectus femoris (H), semimembranosus (I), soleus (J), semitendinosus (K), tibialis anterior (L), vastus intermedius (M), vastus lateralis (N) and vastus medialis (O). Mean fibre length (red horizontal line) and median fibre length (blue horizontal line) are presented for each boxplot. (P) Skewness for each individual across each muscle. AM, adductor magnus; BFL, biceps femoris (long head); Gmax, gluteus maximus; LG, lateral gastrocnemius; MG, medial gastrocnemius; RF, rectus femoris; SM, semimembranosus; ST, semitendinosus; SOL, soleus; TA, tibialis anterior; VI, vastus intermedius; VL, vastus lateralis; VM, vastus medialis.
Fig. 10
Fig. 10
The influence of inaccurate fibre length measurements on simulations of walking. (A) Musculoskeletal modelling for walking. (B–F) Muscle fibre lengths and forces of the gluteus maximus (mid portion) (B), adductor magnus (hamstring part) (C), vastus lateralis (D), tibialis anterior (E) and soleus (F) predicted by static optimisation simulations of walking in models informed by the full mean value (Modelmean, mid‐tone line), median value (Modelmedian; mid‐tone dashed line), and the maximum (Modelmax5; darkest line) and minimum (Modelmin5; palest line) possible values from random subsamples of 5 fibres. The root mean squared errors (RMSEs) of these variables relative to Modelmedian are shown expressed as a percentage of the maximum Modelmedian value.
Fig. 11
Fig. 11
The influence of inaccurate fibre length measurements on simulations of vertical jumping. (A) Musculoskeletal modelling for vertical jumping. (B–F) Muscle fibre lengths and forces of the gluteus maximus (mid portion) (B), adductor magnus (hamstring part) (C), vastus lateralis (D), tibialis anterior (E) and soleus (F) predicted by static optimisation simulations of jumping in models informed by the full mean value (Modelmean, mid‐tone line), median value (Modelmedian; mid‐tone dashed line), and the maximum (Modelmax5; darkest line) and minimum (Modelmin5; palest line) possible values from random subsamples of 5 fibres. The root mean squared errors (RMSEs) of these variables relative to Modelmedian are shown expressed as a percentage of the maximum Modelmedian value.
Fig. 12
Fig. 12
Functional implications of fibre length sample size as predicted by a musculoskeletal model and simulation of walking. In four different model interactions containing muscles with optimal fibre length and maximum force values informed by the full mean value (Modelmean), median value (Modelmedian), and the maximum (Modelmax5) and minimum (Modelmin5) possible values from random subsamples of 5 fibres, all muscles were characterised as acting as struts, springs, motors or brakes depending on the level and timing of force and power generation. In Modelmean and Modelmedian, all muscles were informed by the appropriate values, while in Modelmax5 and Modelmin5, results are shown for only five muscles (B–F) informed by these properties, with the properties of all other muscles (e.g. G–L) determined by their Modelmean values. The vastus lateralis (D) and soleus (F) showed substantial changes in function relative to Modelmean due to reductions in fibre sample size (Modelmin5), while the flexor hallucis longus (J) showed a similarly large change in function in Modelmin5 despite no change in muscle force‐generating properties from Modelmean.
Fig. 13
Fig. 13
Functional implications of fibre length sample size as predicted by a musculoskeletal model and simulation of vertical jumping. In four different model interactions containing muscles with optimal fibre length and maximum force values informed by the full mean value (Modelmean), median value (Modelmedian), and the maximum (Modelmax5) and minimum (Modelmin5) possible values from random subsamples of 5 fibres, all muscles were characterised as acting as struts, springs, motors or brakes depending on the level and timing of force and power generation. In Modelmean and Modelmedian, all muscles were informed by the appropriate values, while in Modelmax5 and Modelmin5, results are shown for only five muscles (B–F) informed by these properties, with the properties of all other muscles (e.g. G–L) determined by their Modelmean values. The tibialis anterior (E) and soleus (F) showed substantial changes in function relative to Modelmean due to reductions in fibre sample size (Modelmin5), while changes in function in muscles with unchanged force‐generating properties from Modelmean were much less than those seen during walking.
Fig. 14
Fig. 14
Interpretations of muscle function and specialisation based on fibre architecture. (A) Relationship between normalised muscle fibre length and normalised physiological cross‐sectional area (PCSA) across human (●, ▴) and chimpanzee (■) lower limb muscles. Median fibre lengths are in grey (●) with selected muscle‐specific data points highlighted in colour, and with a colour‐matched mean data point (▴). Dashed quadrilaterals depict potential error in fibre length and PCSA dependent on the number of fibres used to calculate fibre length. These uncertainties yield large potential error on inferences of muscle functional specialisations (inferred from the relationship between fibre length and PCSA), where random subsamples of 5 fibres can predict a muscle to either be displacement specialised or force specialised, depending on the mean value used. (B) Muscle fibre length to PCSA ratio in human muscles derived from data in this study and previously published work. The ratios of muscle fibre length to PCSA in selected muscles of the lower limb for the data presented here compared to those from previous studies highlight the range of functional behaviours inferred for certain muscles, particularly the semitendinosus (ST), which may be interpreted as resulting from measurements of only a small subset of fibres in past literature. AM, adductor magnus; Gmax, gluteus maximum; PMA, psoas; SM, semitendinosus; SOL, soleus; TA, tibialis anterior; VL, vastus lateralis.
Fig. 15
Fig. 15
The relationships between muscle volume, maximum fibre number and percentage error in the lower limb muscles. (A) There was a moderately strong positive relationship between normalised muscle volume and the maximum number of fibres present, as measured using diffusion tensor imaging and deterministic fibre tractography. Neither of these metrics were strongly correlated with the maximum recovered percentage errors in either fibre length (B, D) or physiological cross‐sectional area (PCSA; C, E). This suggests that other factors, such as muscle architectural complexity, could instead explain the variation in fibre length, PCSA and contractile capacity errors seen here for the muscles of the lower limb. *P < 0.01. SOL, soleus.
Fig. 16
Fig. 16
Statistical measures of bimodality in fibre length distributions. Data from all 250 muscles sampled were assessed using Hartigan's Dip statistic and the Binomial Coefficient equation to assess if the distribution of muscles fibres presented as a uni‐ or bimodal distribution. (A–E) Example distributions taken from the adductor magnus (A), semitendinosus (B), medial gastrocnemius (C), soleus (D) and flexor digitorum longus (E) highlight the variability in fibre distribution. (F) Of the 250 individual muscles sampled, 153 were considered bimodal in distribution. 77 were identified only by Hartigans Dip statistic, 30 were considered multi‐modal only by the Binomial Coefficient, with 46 considered multi‐modal by both statistical tests. (G) Presented as a muscle average across the 10 participants the adductor magnus (A, G), semitendinosus (B, G) and medial gastrocnemius (C, G) were classified as statistically bimodal by the Hartigans Dip Statistic only (p) while the flexor digitorum longus (E, G) was classified as bimodal by the Binomial Coefficient only. The soleus (D) was classified as unimodal by both statistical tests. AM, adductor magnus; FDL, flexor digitorum longus; MG, medial gastrocnemius; SOL, soleus; ST, semitendinosus.

Similar articles

Cited by

References

    1. * Abourachid, A. (1993). Mechanics of standing in birds: functional explanation of lameness problems in giant turkeys. British Poultry Science 34, 887–898. - PubMed
    1. * Abrams, G. D. , Ward, S. R. , Fridén, J. & Lieber, R. L. (2005). Pronator teres is an appropriate donor muscle for restoration of wrist and thumb extension. The Journal of Hand Surgery 30, 1068–1073. - PubMed
    1. * Abrams, R. A. , Tsai, A. M. , Watson, B. , Jamali, A. & Lieber, R. L. (2000). Skeletal muscle recovery after tenotomy and 7‐day delayed muscle length restoration. Muscle & Nerve 23, 707–714. - PubMed
    1. Adams, N. F. , Rayfield, E. J. , Cox, P. G. , Cobb, S. N. & Corfe, I. J. (2019). Functional tests of the competitive exclusion hypothesis for multituberculate extinction. Royal Society Open Science 6, 181536. - PMC - PubMed
    1. * Al‐Amood, W. S. & Pope, R. (1972). A comparison of the structural features of muscle fibres from a fast‐and a slow‐twitch muscle of the pelvic limb of the cat. Journal of Anatomy 113, 49–60. - PMC - PubMed

Publication types