. 2022 Jun 6;221(6):e202110044.
doi: 10.1083/jcb.202110044. Epub 2022 Apr 7.

MOSPD2 is an endoplasmic reticulum-lipid droplet tether functioning in LD homeostasis

Affiliations

MOSPD2 is an endoplasmic reticulum-lipid droplet tether functioning in LD homeostasis

Mehdi Zouiouich et al. J Cell Biol. .

Abstract

Membrane contact sites between organelles are organized by protein bridges. Among the components of these contacts, the VAP family comprises ER-anchored proteins, such as MOSPD2, that function as major ER-organelle tethers. MOSPD2 distinguishes itself from the other members of the VAP family by the presence of a CRAL-TRIO domain. In this study, we show that MOSPD2 forms ER-lipid droplet (LD) contacts, thanks to its CRAL-TRIO domain. MOSPD2 ensures the attachment of the ER to LDs through a direct protein-membrane interaction. The attachment mechanism involves an amphipathic helix that has an affinity for lipid packing defects present at the surface of LDs. Remarkably, the absence of MOSPD2 markedly disturbs the assembly of lipid droplets. These data show that MOSPD2, in addition to being a general ER receptor for inter-organelle contacts, possesses an additional tethering activity and is specifically implicated in the biology of LDs via its CRAL-TRIO domain.


Figures

Figure 1.
Figure 1.
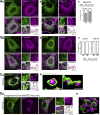
MOSPD2 is an ER-resident protein found enriched around LDs. (A) HeLa cells expressing GFP-MOSPD2 (green) were labeled with an anti-Calnexin antibody (magenta). GFP-MOSPD2 exhibited a reticular pattern (a), with additional ring- and comma-shaped structures (b). c: Percentage of cells with GFP-positive ring- or comma-shaped structures in the absence of treatment (NT) or after OA treatment. Mean ± SD; n = 3 independent experiments (NT: 300 cells, OA: 136 cells). (B) Confocal images of HeLa cells expressing GFP-VAP-A (green; a) and GFP-VAP-B (green; b), labeled as in A. c: Quantification as in panel A, c of VAP-A and VAP-B expressing cells. Mean ± SD; n = 3 independent experiments (GFP-VAP-A: NT: 119 cells, OA: 126 cells; GFP-VAP-B: NT: 140 cells, OA: 141 cells). (C) a: HeLa cells expressing GFP-MOSPD2 were treated with OA (400 µM, overnight) and LDs were labeled with Nile Red. b: 3D reconstruction from confocal images of MOSPD2-positive ER (green) around LDs (magenta). Images generated with the surface representation tool of the Chimera software (Pettersen et al., 2004). Scale bar: 500 nm. (D) a: Live imaging of CRISPR/Cas9-edited HeLa cells expressing mClover3-MOSPD2 (green) at the endogenous level, treated with OA, and labeled with LipidTOX (magenta). b: 3D reconstruction from confocal images of MOSPD2-positive ER (green) around LDs (magenta) using Imaris (white dashed rectangle from overlay panel). Scale bar: 500 nm. (A, B, and D) Images were acquired on a spinning-disk confocal microscope (Nikon CSU-X1, 100× NA 1.4). Scale bars: 10 μm (insets, 2 μm). (C) Confocal microscope (Leica SP5, 63× NA 1.4) images, scale bars: 10 μm (insets, 2 μm).
Figure S1.
Figure S1.
MOSPD2 is enriched around LDs in different cell lines. (A) HeLa cells expressing GFP-MOSPD2 (green) and not treated with OA were labeled with Nile Red to stain LDs (magenta). (B–D) Localization of GFP-MOSPD2 (green) in Huh-7 (B), 501-MEL (C), and MCF7 (D) cells. Cells were either treated with OA (right) or not treated (left). LDs were stained using Nile Red (magenta). Subpanels on the right are higher magnification images of the outlined areas. The overlay panel shows merged channels. The coloc panel displays a colocalization mask in which pixels of the green and magenta channels that co-localize are shown in white. Linescan shows fluorescence intensities of the green and magenta channels along the white arrow from the overlay subpanel. Black rectangles indicate the position of LDs. (A–D) Scale bars: 10 µm (insets, 2 µm). Confocal microscope (Leica SP5, 63× NA 1.4) images.
Figure S2.
Figure S2.
Colocalization of MOSPD2 with different organelles. (A–D) Colocalization in HeLa cells transfected with GFP-MOSPD2 (green) of MOSPD2 and endogenous EEA1 (A, magenta), Lamp1 (B, magenta), OPA-1 (C, magenta), and GM130 (D, magenta). Subpanels on the right are higher magnification images of the outlined areas. The overlay panel shows merged channels. The coloc panel displays a colocalization mask in which pixels of the green and magenta channels that co-localize are shown in white. Linescan shows fluorescence intensities of the green and magenta channels along the white arrow from the overlay subpanel. Black rectangles indicate the position of early endosomes (EE; A), late endosomes (LE; B), mitochondria (Mito.; C), and the Golgi apparatus (Golgi; D). Scale bars: 10 µm (insets, 2 µm). Images were acquired on a confocal microscope (Leica SP5, 63× NA 1.4).
Figure S3.
Figure S3.
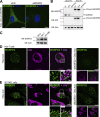
Characterization of CRISPR/Cas9 knock-in HeLa cells and endogenous localization of MOSPD2. (A) Live confocal images of HeLa cells expressing mClover3-MOSPD2 (green) at the endogenous level and transfected with control siRNAs (siCtrl) and siRNAs targeting MOSPD2 (siMOSPD2) to confirm the specificity of mClover3 signal. Scale bars: 10 µm. (B) Western blot (WB) analysis of MOSPD2 expression in WT (HeLa WT) and mClover3-MOSPD2 knock-in (HeLa KI) HeLa cells transfected with control siRNAs (siCtrl) and siRNAs targeting MOSPD2 (siMOSPD2). mClover3 was detected using anti-GFP antibodies. (C) Western blot analysis of MOSPD2 expression in HeLa, Huh-7, and 501-MEL cells. (D and E) Colocalization of endogenous MOSPD2 (labeled with anti-MOSPD2, in green) and LDs (labeled with LipidTOX, in magenta) in Huh-7 cells (D) or 501-MEL (E) after OA treatment. Panels on the right show the background signal of anti-MOSPD2 antibodies in cells transfected with siRNAs targeting MOSPD2 (siMOSPD2). Subpanels show the LD staining. Left: Subpanels on the bottom are higher magnification images of the area outlined. The overlay panel shows merged channels. Scale bars: 10 µm (insets, 2 µm). (A, D, and E) Images were acquired on a spinning-disk confocal microscope (Nikon CSU-X1, 100× NA 1.4). Source data are available for this figure: SourceData FS3.
Figure 2.
Figure 2.
MOSPD2 is involved in LD homeostasis. (A) Western blot analysis of MOSPD2 protein level in control HeLa cells (WT), HeLa cells transfected with control siRNAs (siCtrl), siRNAs targeting MOSPD2 (siMOSPD2), and in two MOSPD2-deficient HeLa cell clones (KO#1 and KO#2) established by CRISPR/Cas9 gene editing. (B) Representative confocal images of parental HeLa cells (WT), of HeLa cells transfected with control siRNAs (siCtrl), and with siRNAs targeting MOSPD2 (siMOSPD2), and of MOSPD2-deficient HeLa cell clones (KO#1 and KO#2) labeled with BODIPY 493/503 (LDs, magenta) and Hoechst 33258 (nuclei, blue). Scale bars: 10 µm. Images were acquired on a spinning-disk confocal microscope (Nikon CSU-X1, 100× NA 1.4). The contour of each cell is delimited by a white dotted line. (C) Number (a) and area (b) of LDs in cells shown in B. Data are displayed as Superplots (Lord et al., 2020) showing the mean number and area of LDs per cell (small dots) or per independent experiment (large dots). Independent experiments (n = 5) are color-coded. Means and error bars (SD) are shown as black bars. Data were collected from 398 (WT), 323 (siCtrl), 280 (siMOSPD2), 333 (KO#1), and 413 (KO#2) cells. One-way ANOVA with Tukey’s multiple comparisons test (ns, not significant; **, P < 0.01; ***, P < 0.001; ****, P < 0.0001; n = 5 independent experiments). (D) a: TLC analysis of lipids extracted from cells shown in A. Neutral lipids were separated with hexane/diethylether/AcOH (80:20:2 vol/vol) and revealed with primuline. CE and TAG were used as standards. b and c: Relative levels of CE (b) and TAG (c) detected by TLC. Means and error bars (SD) are shown. One-way ANOVA with Tukey’s multiple comparisons test (*, P < 0.05; **, P < 0.01; ***, P < 0.001; n = 4 independent experiments). (E) Enzymatic quantification of cholesterol (a), cholesterol ester (b), triacylglycerol, (c) and phospholipid (d) in control HeLa cells (WT) and MOSPD2-deficient HeLa cell clones (KO#1 and KO#2). Means and error bars (SD) are shown. One-way ANOVA with Tukey’s multiple comparisons test (*, P < 0.05; **, P < 0.01; n = 6 independent experiments). A.U., arbitrary unit. Source data are available for this figure: SourceData F2.
Figure S4.
Figure S4.
Image analysis workflows for LD and ER quantifications. (A) Cells stained with BODIPY 493/503 (LDs) and Hoechst (nuclei) were imaged on multiple z slices using a confocal microscope. Z-stack projection (max intensity) images were generated using Fiji and processed using CellProfiler. Cells were manually segmented and LDs identified as objects ≥2 pixels of diameter. Multi-parametric object measurements were performed on the identified LDs. (B) Cells were treated with OA at 50 µM for 6 h before imaging. Three channels were acquired: LDs (stained with HCS DeepRed LipidTox), the ER (stained with the ER marker mScarlet-ER), and MOSPD2/VAP-A (tagged with GFP). Cells were manually segmented and masks of the cytoplasm (i.e., without the nuclei) were generated with CellProfiler. LDs were identified as objects ≥4 pixels of diameter. Multiple areas (2-pixel wide) from 0 to 20 pixels around each LD were added. Multi-parametric measurements were performed for each area around LDs in the red (mScarlet-ER) and green (GFP-MOSPD2/VAP) channels.
Figure S5.
Figure S5.
VAP-A and VAP-B are not involved in LD homeostasis. (A) Western blot analysis of VAP proteins level in control HeLa cells (WT), HeLa cells transfected with control siRNAs (siCtrl), and with siRNAs targeting VAP-A (siVAP-A), VAP-B (siVAP-B), and both (siVAP-A + B). The band labeled with an * on VAP-B blot corresponds to cross-reactivity with VAP-A. (B) Representative confocal images of parental HeLa cells (WT) and HeLa cells transfected with control siRNAs (siCtrl), and with siRNAs targeting VAP-A (siVAP-A), VAP-B (siVAP-B), or both (siVAP-A + B). Cells were labeled with BODIPY 493/503 (LD, magenta) and Hoechst 33258 (nuclei, blue). The cell contour is delimited by a white dotted line. Scale bars: 10 µm. Images were acquired on a spinning-disk confocal microscope (Nikon CSU-X1, 100× NA 1.4). (C) Number (a) and area (b) of LDs in cells shown in B. Data are displayed as Superplots showing the mean number and area of LDs per cell (small dots), and the mean number and area of LDs per independent experiment (large dots). Independent experiments (n = 4) are color-coded. Means and error bars (SD) are shown as black bars. Data were collected from 98 (WT), 118 (siCtrl), 134 (siVAP-A), 129 (siVAP-B), and 135 (siVAP-A + VAP-B) cells. One-way ANOVA with Tukey’s multiple comparisons test (ns, not significant; n = 4 independent experiments). Source data are available for this figure: SourceData FS5.
Figure 3.
Figure 3.
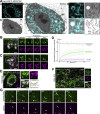
MOSPD2 is dynamically recruited to ER–LD contact sites. (A) CLEM of HeLa/GFP-MOSPD2 cells. a: fluorescence microscopy image; b: EM image; c: correlation of GFP-MOSPD2 and EM images (scale bar: 2 µm); d: composite showing higher magnification images of the area outlined in black in c (scale bar: 500 nm); bottom right: interpretation scheme showing contacts between organelles; ER and lipid droplets are in cyan and pink, respectively. Mitochondria and endosomes/lysosomes are in light yellow and gray, respectively. (B–D) FRAP analysis of MOSPD2 and PLIN2 mobility. GFP-MOSPD2 (B) and GFP-PLIN2 (C) expressing cells were treated with OA and labeled with LipidTOX. GFP fluorescence was photobleached in the area outlined in white, and images acquired every second over a 1-min period. Scale bars: 2 µm. (D) Lineplot showing the relative fluorescence intensity in the photobleached region of GFP-MOSPD2 (green) and GFP-PLIN2 (purple) expressing cells. The grey curve shows the relative fluorescence intensity of GFP-positive LDs that were not bleached. Means and error bars (SD) of relative fluorescence intensities of 56 (GFP-MOSPD2), 57 (GFP-PLIN2), and 72 (unbleached control) regions of interest from 20, 13, and 26 cells, respectively. Data from three independent experiments. (E and F) HeLa cells expressing GFP-MOSPD2 (green) were treated with OA and labeled with anti-PLIN3 antibodies (magenta). Images were acquired by confocal microscopy (Leica SP8, 63× NA 1.4; E), or by STED super-resolution microscopy (F). MOSPD2 and PLIN3 were heterogeneously distributed around LDs. Scale bar: 10 µm (insets, 2 µm) in E and 5 µm (insets, 1 µm) in F. Subpanels on the right are higher magnification images of the area outlined. The overlay panel shows merged channels. In E, linescan shows fluorescence intensities of the green and magenta channels along the white circular arrow of the overlay subpanel (i.e., at the surface of LDs). (G) HeLa cells expressing GFP-MOSPD2 were imaged live during LDs induction (stained with LipidTOX) by OA addition. The white arrow shows an enrichment of MOSPD2 signal before the appearance of LipidTOX staining. The yellow arrow shows the growth of a LD positive for MOSPD2 before the start of the induction. Images were acquired every 90 s (t0-900) on a spinning-disk confocal microscope (Nikon CSU-X1, 100× NA 1.4). Scale bar: 2 µm.
Figure 4.
Figure 4.
MOSPD2 regulates ER–LD contact sites. (A) TEM images of control HeLa (a) and HeLa/GFP-MOSPD2 cells (b) with their interpretation scheme; the ER and LDs are in green and magenta, respectively. Mitochondria and endosomes are in light yellow and gray, respectively. Scale bars: 500 nm. (B) HeLa cells stably expressing the mScarlet-ER marker (green) were either not transfected (NT, top), transfected with GFP-MOSPD2 (gray, middle), or with GFP-VAP-A (gray, bottom). Cells were treated with OA (50 µM for 6 h) and LDs stained with LipidTOX (magenta). Images were acquired on a confocal microscope (Leica SP5; 63× NA 1.4). Scale bars: 10 µm (insets, 2 µm). (C) Schematic representation of the method used for fluorescence quantification around LDs: two pixels-wide areas were segmented around LDs (here represented for a 1-µm-wide LD), and the mean mScarlet fluorescence intensity was measured in each area. (D) Fluorescence intensity of the ER marker mScarlet-ER around LDs in untransfected (NT, red), GFP-MOSPD2 (green), and GFP-VAP-A (purple) transfected cells. Means ± SD (NT: 39 cells; GFP-MOSPD2: 42 cells; GFP-VAP-A: 46 cells; from four independent experiments). The relative mScarlet fluorescence intensity corresponds to the mean fluorescence intensity of mScarlet in each area, divided by the mean fluorescence intensity in the cytoplasm away from LDs (10–20 pixels distance from LDs). (E) Relative enrichment of GFP-MOSPD2 and GFP-VAP-A around LDs. The Peri-LD enrichment ratio is the ratio of the mean GFP fluorescence intensity (GFP-MOSPD2 or GFP-VAP-A) in the vicinity of LDs (0–4 pixels distance from LDs; see C), to the mean fluorescence intensity of GFP at a distance from LDs (10–20 pixels distance from LDs). MOSPD2 fluorescence is twice as high around LDs as in the remainder of the cytoplasm, whereas VAP-A fluorescence is at the same level next to LDs and in the rest of the cytoplasm. Means ± SD (GFP-MOSPD2: 42 cells; GFP-VAP-A: 46 cells; data from four independent experiments).
Figure 5.
Figure 5.
Seipin is dispensable for MOSPD2-mediated ER–LD contact formation and the GFP-MOSPD2 RD/LD mutant is localized in ER–LD contacts. (A) Representative confocal images of the GFP-MOSPD2 WT (green) localization in cells transfected with control siRNAs (left) and siRNAs targeting Seipin (right) and left untreated (a) or treated with OA (b). LDs were stained with Nile Red (magenta). (B) Representative confocal images of the GFP-MOSPD2 WT (green) localization in WT (left) and Seipin knock-out (right) cells treated with OA. LDs were stained with LipidTox (magenta). Note that Seipin silencing or knock-out results in heterogeneous lipid droplet size. In absence of Seipin, MOSPD2 still mediates ER–LD contact formation. (C) a: Representative confocal images of GFP-MOSPD2 WT and RD/LD mutant expressing cells. Cells were not treated with OA. LDs were stained with Nile Red (magenta). b: percentage of cells with GFP-positive ring- or comma-shaped structures. Mean ± SD; n = 4 independent experiments (WT: 156 cells; RD/LD: 162 cells). (D) CLEM of a GFP-MOSPD2 RD/LD expressing cell. a: GFP-MOSPD2 RD/LD fluorescence microscopy image; b: EM image; c: correlation of GFP-MOSPD2 RD/LD fluorescence and EM images (scale bar: 2 µm); d: higher magnification images of the area outlined in black (scale bar: 500 nm); bottom right: interpretation scheme showing contacts between organelles; ER and lipid droplets are in cyan and pink, respectively. Mitochondria, endosomes/lysosomes and nucleus are in light yellow, gray and light blue, respectively. (A and C) Confocal microscope (Leica SP8, 63× NA 1.4) images. (B) Zeiss LSM800 Airyscan images. Scale bars: 10 μm (insets, 2 μm).
Figure 6.
Figure 6.
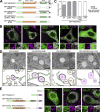
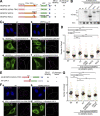
ER–LD contact sites mediated by MOSPD2 depends on its CRAL-TRIO and TM domains. (A) Schematic representation of the different WT and mutant proteins used in the study. Two kinds of mutants were utilized: deletions of specific domains (ΔCRAL-TRIO, ΔMSP, ΔTM) and point mutation (RD/LD) impairing the MSP domain function. (B) Representative confocal images of the GFP-MOSPD2 WT and mutants (green) localization. Cells were treated with OA and LDs stained with Nile Red (magenta). (C) Quantification of cells presenting ring- and comma-shaped staining. Mean ± SD; n = 3 independent experiments (WT: 67 cells; ΔMSP: 138 cells; RD/LD: 152 cells; ΔCRAL-TRIO: 140 cells; ΔTM: 64 cells). (D) EM images of HeLa/GFP-MOSPD2, HeLa/GFP-MOSPD2 ΔMSP, HeLa/GFP-MOSPD2 RD/LD, and HeLa/GFP-MOSPD2 ΔCRAL-TRIO cells (top) and their interpretation scheme (bottom); the ER and LDs are in green and magenta, respectively. Mitochondria and endosomes are in light yellow and gray, respectively. Scale bars: 500 nm. (E) Left: schematic representation of the different chimeric constructs in which the MOSPD2 TM domain is replaced by the TM of SAC1 (purple). Right: localization of these chimeric proteins (green) and LDs stained with Nile Red (magenta) in HeLa cells treated with OA. In B and E, subpanels on the bottom are higher magnification images of the area outlined. The overlay panel shows merged channels. (B and E) Images were acquired on a confocal microscope (Leica SP8, 63× NA 1.4). Scale bars: 10 µm (insets, 2 µm).
Figure 7.
Figure 7.
An amphipathic helix in the CRAL-TRIO domain of MOSPD2 mediates its localization at ER–LD contacts. (A) Schematic representation of MOSPD2 showing the position of the amphipathic helix (red) and its sequence. The arrowhead shows the position of residue W201. (B) Helical wheel representation of the WT (left) and W201E mutant (right) AH (aa 189-203) generated with HeliQuest (http://heliquest.ipmc.cnrs.fr/; left). The W201E mutation alters the amphipathic character of the helix by reducing its hydrophobic moment (µH) from 0.436 to 0.254. (C) WebLogo generated from an alignment of MOSPD2 AH sequence from 44 species. The AH is highlighted in light orange and 10 flanking residues from either side are shown. (D) Ribbon diagram of the structure model of the CRAL-TRIO domain of human MOSPD2 (Uniprot Q8NHP6; residues 1-241) obtained with AlphaFold (Jumper et al., 2021). The domain is in light grey except for the amphipathic helix depicted in stick model with residues colored as in B. (E) Far-UV circular dichroism spectrum of the MOSPD2 CRAL-TRIO domain and its W201E variant (6.7 μM) in 20 mM Tris, pH 7.4, 120 mM NaF buffer. MRE, mean residue ellipticity. The percentage of α-helix, β-sheet and turn, deriving from the analysis of the spectrum (WT) are given as well as the values deriving from the structure model (AlphaFold) using the Define Secondary Structure of Protein algorithm. (F) Left: Schematic representation of GFP-MOSPD2 constructs either WT (GFP-MOSPD2), bearing a mutation in the AH (GFP-MOSPD2 W201E), or containing a deletion of the CRAL-TRIO domain together with an insertion of the AH (AH-MOSPD2-ΔCRAL-TRIO). Right: Localization of these constructs in HeLa cells treated with OA; LDs were stained with Nile Red (magenta). Images were acquired on a confocal microscope (Leica SP5, 63× NA 1.4). Scale bars: 10 µm (insets, 2 µm). (G) Quantification of cells showing ring- or comma-shaped staining for these constructs. Mean ± SD; n = 3 independent experiments (MOSPD2 WT:117 cells; MOSPD2 W201E: 156 cells; AH-MOSPD2-ΔCRAL-TRIO: 113 cells). (H) Left: Schematic representation of WT GFP-VAP-A and GFP-AH-VAP-A chimera in which the AH of MOSPD2 was fused at the N-terminus of VAP-A. Right: localization of the different constructs. LDs were stained with Nile Red in HeLa cells treated with OA. Confocal microscope (Leica SP5, 63× NA 1.4) images. Scale bars: 10 µm (insets, 2 µm). (I) Quantification of cells showing ring- or comma-shaped staining for GFP-VAP-A and GFP-AH-VAP-A chimera. Mean ± SD; n = 3 independent experiments (VAP-A WT: 109 cells; AH-VAP-A: 102 cells). In F and H, composite subpanels on the bottom are higher magnification images of the area outlined. The overlay panel shows merged channels.
Figure 8.
Figure 8.
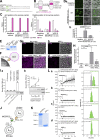
The CRAL-TRIO domain of MOSPD2 directly interacts with aLDs. (A) Peptides used for aLDs flotation assays. Peptides corresponding to the WT or W201E mutant AH of MOSPD2 (residues 187-205), and negative control composed of a random sequence, were coupled with FITC at their amino-terminal end. (B) Principle of aLDs flotation assays. Fluorescent peptides were incubated with aLDs containing 1 mol% Rhodamine-PE, then ultracentrifuged to allow aLDs to float on the sucrose cushion. Top, middle and bottom fractions were collected and FITC and rhodamine fluorescence quantified. (C) aLDs flotation assays. Left: Relative rhodamine fluorescence (i.e., aLDs); right: Relative FITC fluorescence (i.e., peptides), in the bottom (light pink), middle (pink) and top (dark pink) fractions. Means (± SD) from n = 5 independent experiments. (D) aLDs peptide interaction assay. a: Representative images of aLDs incubated with peptides shown in A. Scale bars: 10 μm. b: quantification of peptide fluorescence on aLDs. Means (± SD); n = 2 independent experiments (negative control: 1,397; WT AH : 231; W201E AH: 198 aLDs) . Student’s t test (****, P < 0.0001). (E) Coomassie blue staining of the recombinant MSPHis6, WT CRAL-TRIOHis6, and mutant CRAL-TRIOHis6 W201E proteins after SDS-PAGE. (F) Principle of aLDs pull-down assay. Proteins were immobilized on magnetic NTA-Ni2+ beads, owing to their His6 tag, and incubated with fluorescent aLDs. (G) Representative confocal images of NTA-Ni2+ beads either not coated with recombinant proteins (a, no protein) or coated with recombinant domains of MOSPD2 (b, MSPHis6; c, WT CRAL-TRIOHis6; and d, mutant CRAL-TRIOHis6 W201E) and incubated with fluorescent aLDs (magenta). Left: Confocal section of aLD fluorescence; right: Superposition with brightfield images showing the beads. Spinning-disk confocal microscope (Nikon CSU-X1, 100× NA 1.4) images. Scale bars: 10 µm. (H) Quantification of aLDs recruitment on NTA-Ni2+ beads. Rhodamine fluorescence was measured using a fluorimeter. Means ± SD. Kruskal–Wallis with Tukey’s multiple comparisons test (ns, not significant; ****, P < 0.0001; n = 6 independent experiments). (I) a: Flotation assays. CRAL-TRIOHis6 (0.75 µM) was mixed with liposomes (0.75 mM lipids) only made of DOPC or diphyt-PC or composed of DOPC/DOPS (7/3 mol/mol) or diphyt-PC/diphyt-PS (7/3 mol/mol) in HK buffer at 25°C for 10 min. After centrifugation, the liposomes were recovered at the top of a sucrose cushion and analyzed by SDS-PAGE. The amount of protein recovered in the top fraction (lane 1–4) was quantified and the fraction of liposome-bound CRAL-TRIOHis6 was determined using the content of lane 5 (total 100%) as a reference. Data are represented as mean ± SEM (error bars; n = 4). b: Flotation assays. WT (closed circle) and W201E mutant (open circle) MOSPD2 CRAL-TRIOHis6 proteins (0.75 µM) were mixed for 10 min with liposomes (0.75 mM lipids) only made of diphyt-PC or additionally containing 10 or 30 mol% diphyt-PS. Data are represented as mean ± SEM (error bars; n = 3–5). (J) Principle of the membrane tethering assay. (K) Coomassie blue staining of the recombinant MOSPD2His6 and MSPHis6 proteins after SDS-PAGE. (L) Membrane tethering assays. LA liposomes (50 µM total lipids) composed of DOPC/DOGS-NTA-Ni2+ (98/2 mol/mol; a, b, and d) or DOPC (b) were mixed with LB liposomes (50 µM), composed of diphyt-PC/diphyt-PS (70/30 mol/mol) (a, b, and d) or DOPC (c) in HK buffer at 25°C. After 2 min, MOSPD2His6 (a–c) or MSPHis6 (d; 0.4 µM) was added and the size of liposomes was measured for 23 min. Left: Mean radius (dots) and polydispersity (shaded area) over time. Right: Hydrodynamic radius (RH) distribution before (gray bars) and after the reaction (green bars). These experiments are representative of several independent experiments (n = 3–5). Source data are available for this figure: SourceData F8.
Figure 9.
Figure 9.
The capacity of MOSPD2 to form ER–LD contact sites is necessary but not sufficient to regulate LDs. (A) Schematic representation of mScarlet-MOSPD2 constructs either WT (mScarlet-MOSPD2) or containing a deletion of the MSP domain (ΔMSP) or the CRAL-TRIO domain (ΔCRAL-TRIO), a mutation in the MSP domain (RD/LD) or in the CRAL-TRIO domain (W201E). For each construct, the LD tethering activity and the rescue (see panels below) are summarized as + or −. (B) Western Blot analysis of WT and MOSPD2 knock-out (KO#1) HeLa cells. MOSPD2 expression was rescued in MOSPD2 knock-out cells using mScarlet-MOSPD2 expression constructs either WT or mutant (mScarlet-MOSPD2 ΔCRAL-TRIO, W201E, and RD/LD). NT, non-transfected. (C) Representative confocal images of WT and MOSPD2 knock-out (KO#1) HeLa cells in which MOSPD2 expression was restored using mScarlet-MOSPD2 constructs (c, d, e, and f; green) depicted in panel A. As control, untransfected WT (a) and MOSPD2 knock-out (b) cells were imaged. LDs were stained with BODIPY 493/503 (magenta) and nuclei with Hoechst (blue). (D) Quantification of the number of LDs in cells shown in B. Data are displayed as Superplots showing the mean number of LDs per cell (small dots) and the mean number of LDs per independent experiment (large dots). Independent experiments (n = 5) are color-coded. Means and error bars (SD) are shown as black bars. Data were collected from 213 (WT), 200 (KO#1), 150 (KO + mScarlet-MOSPD2 WT), 238 (KO + mScarlet-MOSPD2 ΔCRAL-TRIO), 126 (KO + mScarlet-MOSPD2 W201E), and 118 (KO + mScarlet-MOSPD2 RD/LD) cells. One-way ANOVA with Tukey’s multiple comparisons test (ns, not significant; ***, P < 0.001; n = 5 independent experiments). (E) Schematic representation of mScarlet constructs containing the deletion of the CRAL-TRIO domain together with an insertion of the AH (AH-MOSPD2-ΔCRAL-TRIO), and of the GFP-AH-VAP-A chimera in which the AH of MOSPD2 was fused at the N-terminus of VAP-A. For both constructs, the LD tethering activity and the rescue (see panels below) are summarized as + or −. (F) Representative confocal images of WT and MOSPD2 knock-out (KO#1) of HeLa cells in which constructs (green) from panel E were expressed (c and d). As control, untransfected WT (a) and MOSPD2 knock-out (b) cells were imaged. LDs were stained with BODIPY 493/503 (magenta) and nuclei with Hoechst (blue). (G) Quantification of the number of LDs in cells shown in F. Data are displayed as Superplots showing the mean number of LDs per cell (small dots) and the mean number of LDs per independent experiment (large dots). Independent experiments (n = 5) are color-coded. Means and error bars (SD) are shown as black bars. Data were collected from 202 (WT), 192 (KO#1), 156 (KO + mScarlet-MOSPD2 WT), 147 (KO + mScarlet-AH-MOSPD2-ΔCRAL-TRIO), and 155 (KO + mScarlet-AH-VAP-A). One-way ANOVA with Tukey’s multiple comparisons test (ns, not significant; **, P < 0.01; ***, P < 0.001; n = 5 independent experiments). (C and F) Images were acquired on a spinning-disk confocal microscope (Nikon CSU-X1, 100× NA 1.4). Scale bars: 10 µm. The cell contour is shown with a white dotted line. Source data are available for this figure: SourceData F9.
Figure 10.
Figure 10.
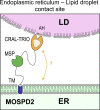
Schematic representation of ER–LD contact sites mediated by MOSPD2. MOSPD2 tethers the ER to LDs thanks to its TM and CRAL-TRIO domains. The amphipathic helix located in the CRAL-TRIO domain directly interacts with the surface of LDs. The CRAL-TRIO domain of MOSPD2 might also be involved in lipid binding and/or transport between the ER and LDs.

References

    1. Alpy, F., Latchumanan V.K., Kedinger V., Janoshazi A., Thiele C., Wendling C., Rio M.-C., and Tomasetto C.. 2005. Functional characterization of the MENTAL domain. J. Biol. Chem. 280:17945–17952. 10.1074/jbc.M500723200 - DOI - PubMed
    1. Alpy, F., Rousseau A., Schwab Y., Legueux F., Stoll I., Wendling C., Spiegelhalter C., Kessler P., Mathelin C., Rio M.-C., et al. . 2013. STARD3 or STARD3NL and VAP form a novel molecular tether between late endosomes and the ER. J. Cell Sci. 126:5500–5512. 10.1242/jcs.139295 - DOI - PubMed
    1. Bankaitis, V.A., Aitken J.R., Cleves A.E., and Dowhan W.. 1990. An essential role for a phospholipid transfer protein in yeast Golgi function. Nature. 347:561–562. 10.1038/347561a0 - DOI - PubMed
    1. Bankaitis, V.A., Mousley C.J., and Schaaf G.. 2010. The Sec14 superfamily and mechanisms for crosstalk between lipid metabolism and lipid signaling. Trends Biochem. Sci. 35:150–160. 10.1016/j.tibs.2009.10.008 - DOI - PMC - PubMed
    1. Bligh, E.G., and Dyer W.J.. 1959. A rapid method of total lipid extraction and purification. Can J. Biochem. Physiol. 37:911–917. 10.1139/o59-099 - DOI - PubMed

Publication types

MeSH terms