. 2022 Jun 6;219(6):e20210693.
doi: 10.1084/jem.20210693. Epub 2022 Apr 7.

IL-17-induced HIF1α drives resistance to anti-PD-L1 via fibroblast-mediated immune exclusion

Affiliations

IL-17-induced HIF1α drives resistance to anti-PD-L1 via fibroblast-mediated immune exclusion

Xing Chen et al. J Exp Med. .

Abstract

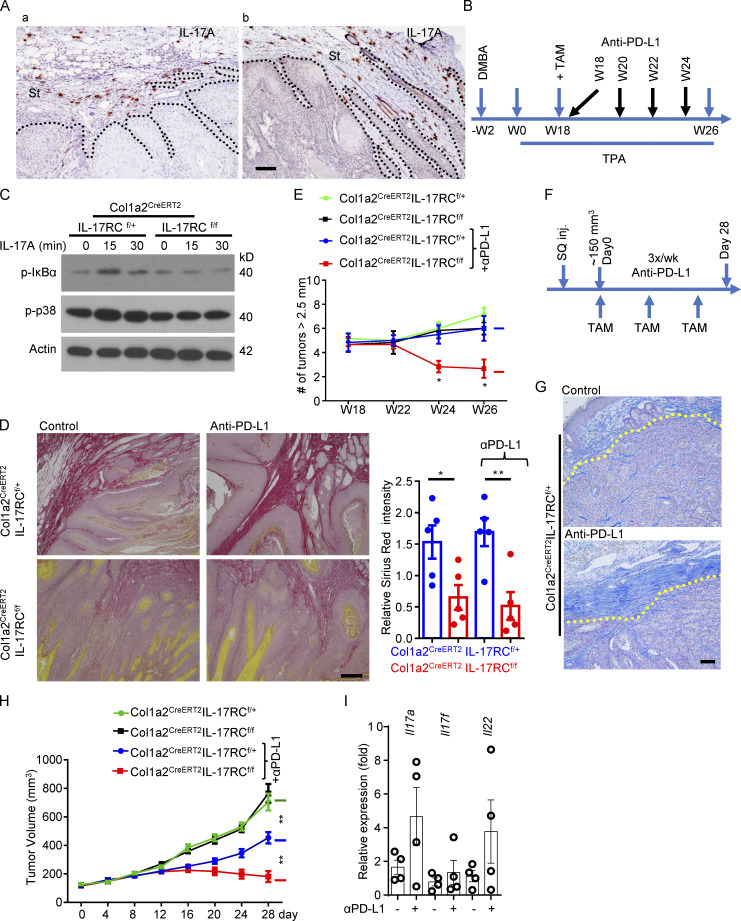
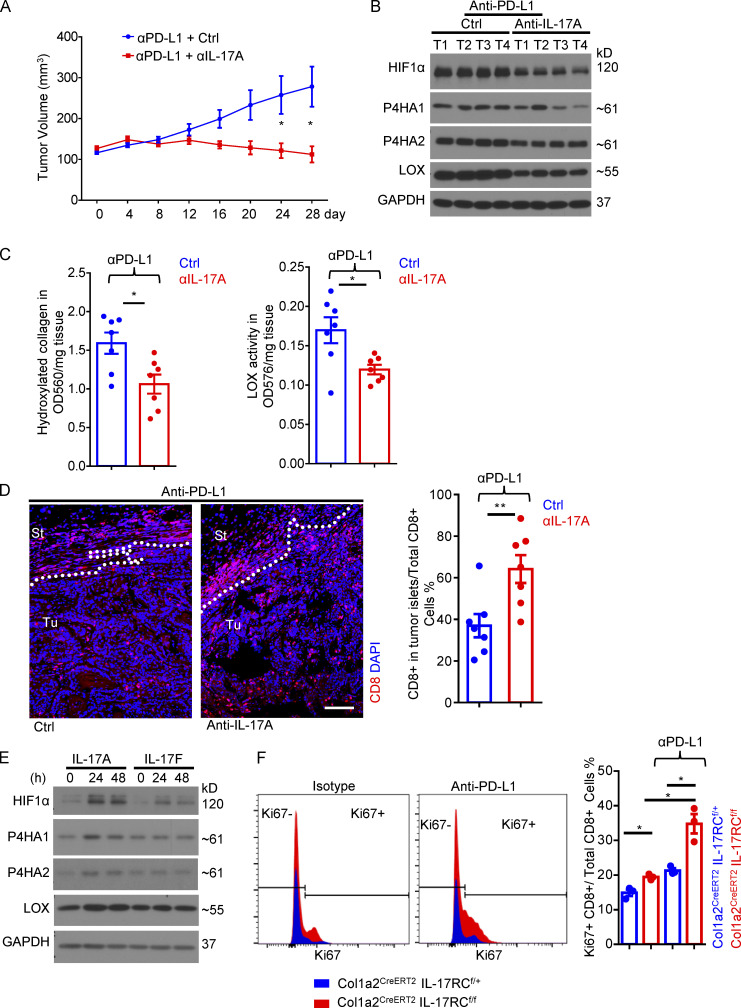
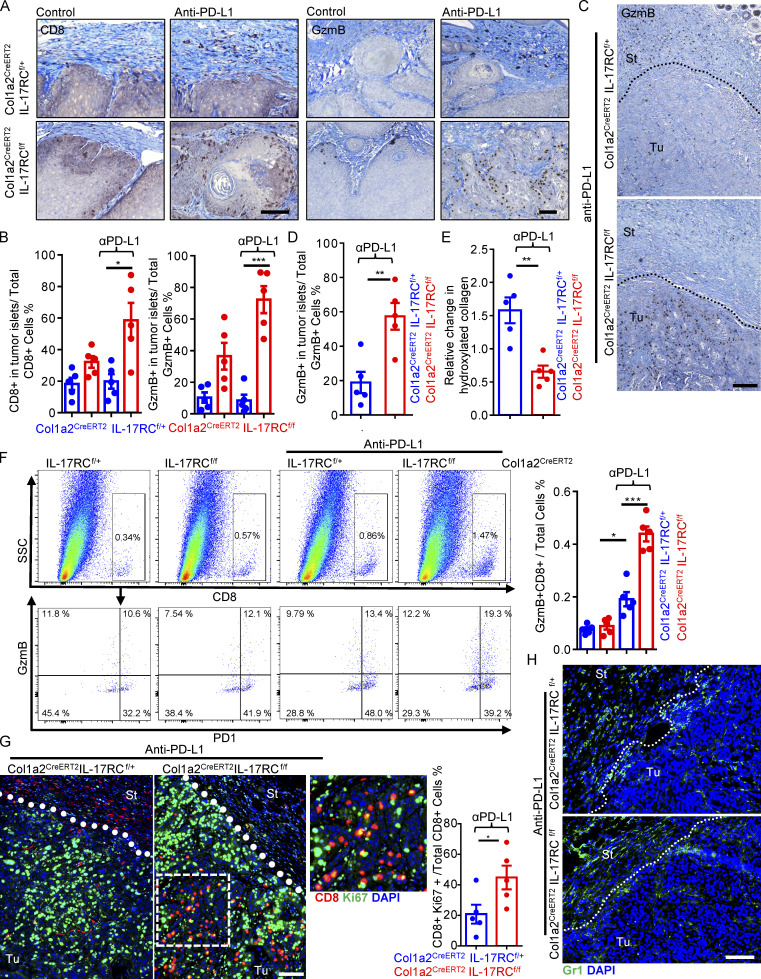
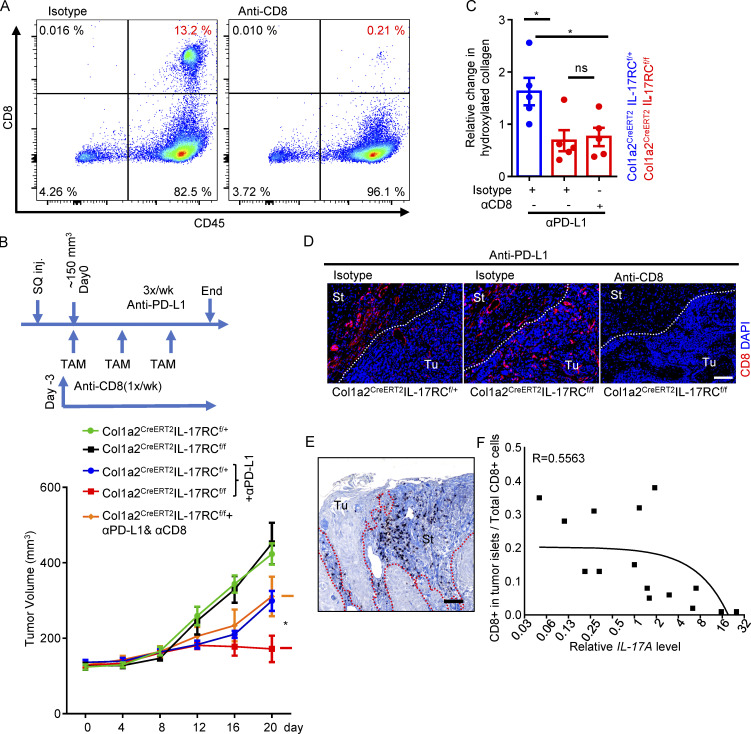
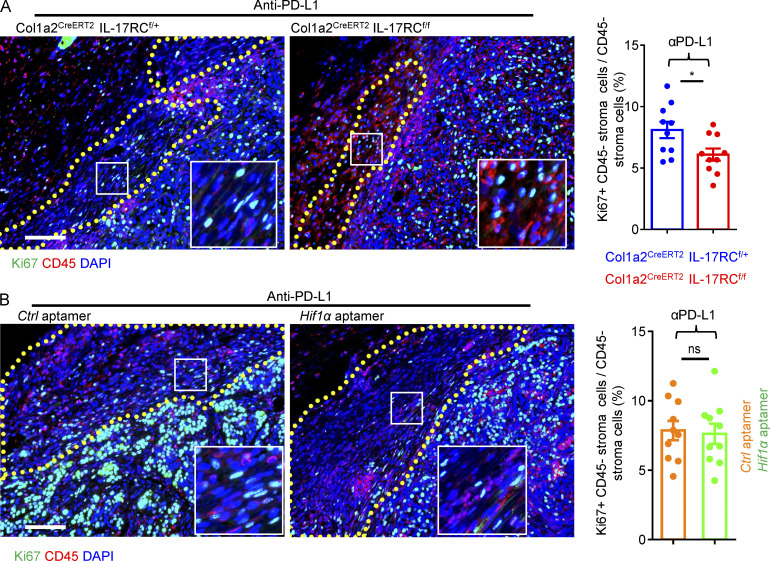
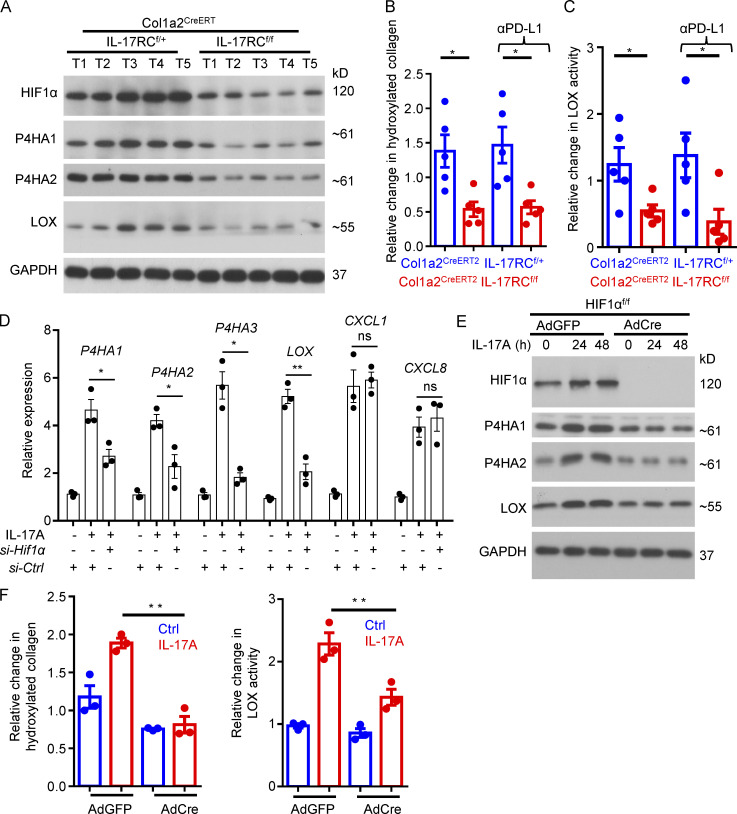
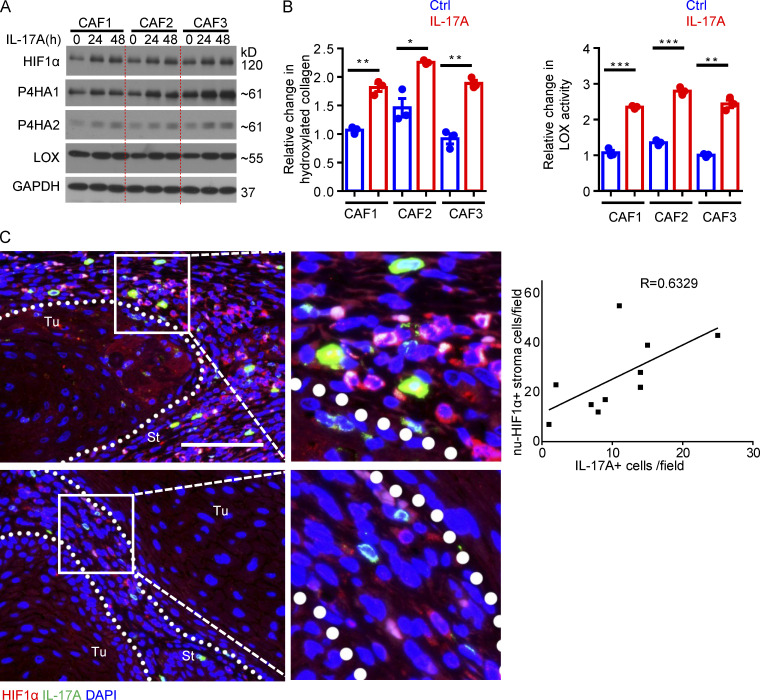
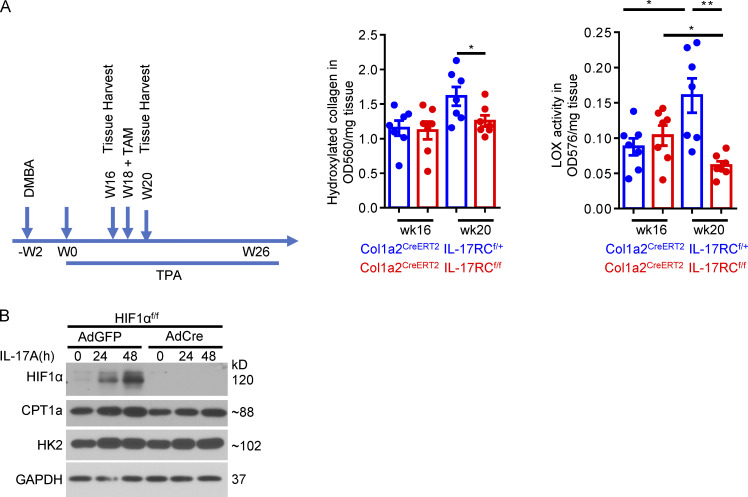
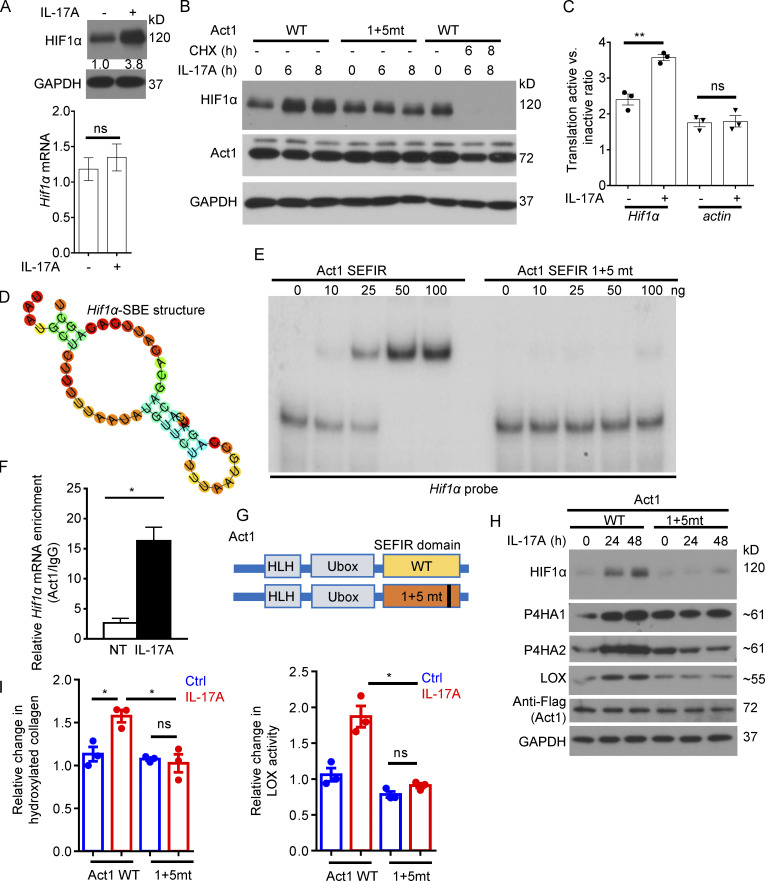
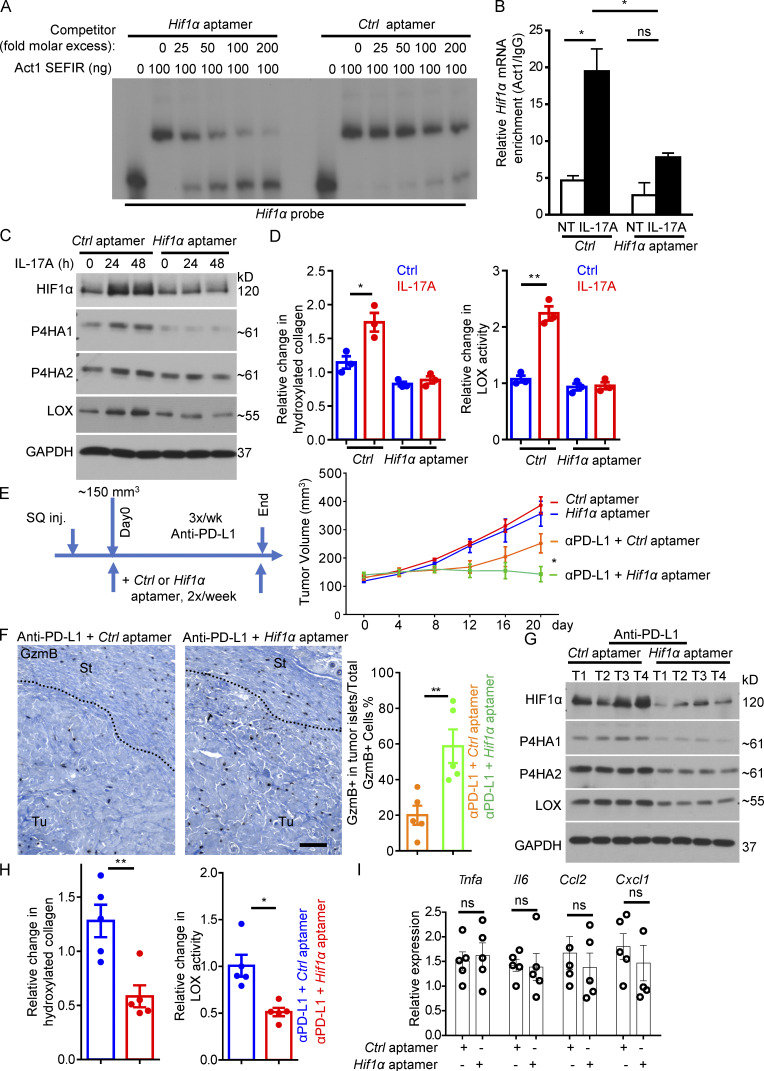
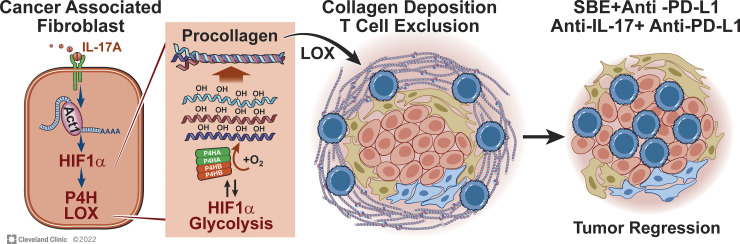
Increasing evidence suggests that intratumoral inflammation has an outsized influence on antitumor immunity. Here, we report that IL-17, a proinflammatory cytokine widely associated with poor prognosis in solid tumors, drives the therapeutic failure of anti-PD-L1. By timing the deletion of IL-17 signaling specifically in cancer-associated fibroblasts (CAFs) in late-stage tumors, we show that IL-17 signaling drives immune exclusion by activating a collagen deposition program in murine models of cutaneous squamous cell carcinoma (cSCC). Ablation of IL-17 signaling in CAFs increased the infiltration of cytotoxic T cells into the tumor mass and sensitized otherwise resistant cSCC to anti-PD-L1 treatment. Mechanistically, the collagen deposition program in CAFs was driven by IL-17-induced translation of HIF1α, which was mediated by direct binding of Act1, the adaptor protein of IL-17 receptor, to a stem-loop structure in the 3' untranslated region (UTR) in Hif1α mRNA. Disruption of Act1's binding to Hif1α mRNA abolished IL-17-induced collagen deposition and enhanced anti-PD-L1-mediated tumor regression.


Conflict of interest statement

Disclosures: T. Herjan, L. Hong, C. Liu, and Xiaoxia Li reported a patent to US20200157544A1 pending, a patent to EP3655007A4 pending, and a patent to CN111093678A pending. No other disclosures were reported.

Figures

Figure 1.
Figure 1.
Ablation of IL-17 signaling in fibroblasts sensitizes cutaneous SCC to anti–PD-L1–mediated regression. (A) Representative images of IL-17A expression (immunohistochemical staining) in established tumors induced by DMBA/TPA alone (a) or tumors induced by DMBA/TPA combined with anti–PD-L1 treatment (b). St, stroma area. (B) Treatment schedule of DMBA/TPA model for experiments in C–E. (C) CAFs of DMBA/TPA-induced tumors from IL-17RCf/+Col1a2CreERT2 and IL-17RCf/fCol1a2CreERT2 mice (harvested and expanded at the endpoint of this model) were treated with IL-17A followed by Western analysis of IL-17 response. (D) Representative images of Sirius Red staining to show the collagen deposition of the DMBA/TPA-induced tumors from indicated mice. Bar graph shows relative intensity of Sirius Red–stained collagen from random area of five independent tumors. Error bars represent ± SEM. *, P < 0.05; **, P < 0.01 by t test. (E) Total number of tumors (≥2.5 mm in diameter) per mouse from DMBA/TPA model over the time course of DMBA/TPA model described in B. Mice with similar tumor burden (six mice in each group) were selected and randomly grouped at week 18 for TAM induction and further anti–PD-L1 treatment. *, P < 0.05 by t test at indicated time points. Error bars represent ± SEM. Data are representative of two independent experiments. (F) Treatment schedule for PDVC57 tumor model–based experiments in G–I. SQ inj., subcutaneously injected. (G) Control and anti–PD-L1 treated PDVC57 tumors from endpoint of IL-17RCf/+Col1a2CreERT2 mice of F were characterized for extensive stroma using aniline blue staining. (H) Graph shows the tumor volumes of PDVC57 model described in F. Mice with similar tumor size (∼150 mm3, five mice in each group) were selected for TAM induction and further anti–PD-L1 treatment. **, P < 0.01 by t test for the indicated groups at the endpoint. Error bars represent ± SEM. Data are representative of two independent experiments. (I) Relative mRNA levels of indicated genes in PDVC57 tumors treated with or without anti–PD-L1 from IL-17RCf/+Col1a2CreERT2 mice. n = 4 biological samples each group. Error bars represent ± SEM. Scale bars for A and G = 100 μm; D = 200 μm. α is used for “anti-” in bar graphs throughout. Dotted lines in A and G are used to show the main boundary of tumor islets and stroma areas.
Figure S1.
Figure S1.
IL-17A neutralization sensitizes cutaneous SCC to antiPD-L1–mediated regression. (A) Tumor volumes from PDVC57 cell–derived syngeneic model over the time course of anti–PD-L1 + isotype (Ctrl) or anti–PD-L1 + anti–IL-17A treatment. C57BL/6 mice with similar tumor size (seven mice in each group) were used for indicated treatments. Error bars represent ± SEM. *, P < 0.05 by t test. (B) Western analysis of tumor pieces from four random biological samples of A. (C) Hydroxyproline assay and LOX assay in tumor lysates (n = 7) from anti–PD-L1 + isotype (Ctrl) or anti–PD-L1 + anti–IL-17A neutralizing antibody treated mice in A. Error bars represent ± SEM. *, P < 0.05 by t test. (D) Representative images of CD8 staining of tumors from anti–PD-L1 + isotype (Ctrl) or anti–PD-L1 + anti–IL-17A neutralizing antibody treated mice in A. Bar graph represents the percentage of CD8+ T cells in the tumor islets over the total CD8+ T cells (in stroma and in tumor islets). n = 7 biological samples. Error bars represent ± SEM. **, P < 0.01 by t test. St, stroma; Tu, tumor islets. Dotted lines are used to show the main boundary of tumor islets and stroma areas. Scale bar = 100 μm. (E) Dermal fibroblasts were treated with IL-17A and IL-17F for indicated times followed by Western analysis. Data are representative of at least three independent experiments. (F) Tumor tissues from endpoint of PDVC57 model as described in Fig. 1 F with IL-17RCf/+Col1a2CreERT2 or IL-17RCf/fCol1a2CreERT2 mice were harvested, dissociated, and examined by flow cytometry analysis for indicated markers. Cells gated on CD8+ were subjected to Ki67 analysis in histograms. Bar graph indicates CD8+Ki67+/total CD8+ T cell ratio in the whole tumor from three independent specimens. Error bars represent ± SEM. *, P < 0.05 by t test. Data are representative of two independent experiments.
Figure 2.
Figure 2.
Ablation of IL-17 signaling in fibroblast increases cytotoxic T cell activity in tumor islets. (A and B) Immune staining (A) and quantification (B) of tumors for CD8 and granzyme B from indicated mice of DMBA/TPA model at week 26 (Fig. 1 E). Bar graph (B) represents CD8+ cell or GzmB+ cell ratio in the tumor islets over total CD8+ or GzmB+ cells (in stroma and in tumor islets). Five specimens were used. Error bars represent ± SEM. *, P < 0.05; ***, P < 0.001 by t test. (C and D) Immune staining (C) and quantification (D) for granzyme B from endpoint PDVC57 tumors of Fig. 1 H. Bar graph indicates GzmB+ cell ratio in the tumor islets over total GzmB+ cells (in the stroma and in tumor islets). n = 5. Error bars represent ± SEM. **, P < 0.01 by t test. St, stroma; Tu, tumor islets. (E) Tumor tissue from endpoint PDVC57 tumors of Fig. 1 H were subjected to hydroxyproline assay for relative hydroxylated collagen levels. n = 5. Error bars represent ± SEM. **, P < 0.01 by t test. (F) Tumor tissues from endpoint of PDVC57 model as described in Fig. 1 F were harvested, dissociated, and examined by flow cytometry analysis for indicated markers. Bar graph indicates GzmB+CD8+ T cells/total cells ratio in the tumor from five independent specimens. Error bars represent ± SEM. *, P < 0.05; ***, P < 0.001 by t test. SSC, side scatter. (G and H) Immunofluorescence staining for CD8/Ki67 (G) and Gr1 (H; frozen sections) from endpoint of indicated tumors in Fig. 1 H. Bar graph indicates CD8+Ki67+/Total CD8 T cell ratio in the tumor. n = 5. Error bars represent ± SEM. *, P < 0.05 by t test. Scale bars for A, C, G, and H = 100 μm. St, stroma; Tu, tumor islets. Dotted lines are used to show the main boundary of tumor islets and stroma areas. All data in Fig. 2 are representative of two independent experiments.
Figure 3.
Figure 3.
CD8 depletion abrogated the sensitivity to antiPD-L1 in IL-17RCf/fCol1a2CreERT2 mice. (A) Flow cytometry analysis of splenic CD8 cells after anti-CD8 depletion. (B) CD8 T cell depletion abrogated the sensitivity to anti–PD-L1 in IL-17RCf/f Col1a2CreERT2 mice. Graph presents tumor volumes from PDVC57 model over the time course. Mice with similar tumor size (∼150 mm3, five mice in each group) were selected for TAM induction and treatments of anti-CD8 and anti–PD-L1. Error bars represent ± SEM. *, P < 0.05 by t test for the indicated groups at the endpoint. SQ inj., subcutaneously injected. (C) Tumor tissue from indicated groups from B were subjected to hydroxyproline assay for relative hydroxylated collagen levels. n = 5 independent specimens. Error bars represent ± SEM. *, P < 0.01 by t test. (D) Representative images of CD8 staining from in indicated groups of B. Scale bar = 100 μm. Data for A–D are representative of two independent experiments. (E) Human cutaneous SCC sections were stained for CD8 and counterstained with aniline blue. Scale bar, 100 μm. St, stroma; Tu, tumor islets. Dotted lines in D and E are used to show the main boundary of tumor islets and stroma areas. (F) Graph shows correlation of immune exclusion (measured by ratio values of CD8 T cells in tumor compartments) and levels of IL-17A (determined by RT-PCR) in 15 randomly selected human cutaneous SCCs.
Figure S2.
Figure S2.
Fibroblast proliferation status in antiPD-L1–treated tumors. (A) Paraffin sections of anti–PD-L1–treated PDVC57 tumors from indicated mice of Fig. 1 H were stained for proliferative marker Ki67 (green) and hematopoietic marker CD45 (red) and counterstained with DAPI (blue). Major stroma areas are demarcated with dotted lines. Bar graph shows percentages of CD45 cells with positive Ki67 nuclei staining in stromal areas from 10 fields of five biologically independent tumors. Error bars represent ± SEM. *, P < 0.05 by t test. (B) Representative staining of Ki67 (green), CD45 (red), and DAPI (blue) in tumors from Fig. 6E (mice treated with anti–PD-L1 and control [Ctrl] or Hif1α targeting aptamer). Major stroma areas are demarcated with dotted lines. Bar graph shows percentages of CD45 cells with positive Ki67 nuclei staining in stromal areas from 10 fields of five biologically independent tumors. Error bars represent ± SEM. t test.
Figure 4.
Figure 4.
IL-17–induced collagen deposition in fibroblasts through HIF1α cascade. (A) Western analysis of indicated proteins in tumor lysates from indicated mice on DMBA/TPA model treated with anti–PD-L1 at week 26 as described in Fig. 1 B. Each lane indicates an individual sample. (B and C) Tumor tissues from same experiment of A were subjected to hydroxyproline assay (B) and LOX assay (C). n = 5 tumors. Error bars represent ± SEM. *, P < 0.05 by t test. Data are representative of two independent experiments for A–C. (D) Human SCC CAFs were subjected to Hif1α knockdown by transfection with si-Ctrl or si-Hif1α. Cells were then treated with IL-17A for 24 h, followed by RT-PCR analysis. Bar graph represents related gene expression level of indicated genes. n = 3 technical repeats. Error bars represent ± SEM. *, P < 0.05; **, P < 0.01 by t test. (E and F) Dermal fibroblasts were isolated from HIF1αf/f mice, followed by infection with adenovirus encoding GFP or Cre. Cells were then untreated or treated with IL-17A for indicated times, followed by Western analysis (E) or hydroxyproline assay and LOX assay (F). n = 3 technical repeats. Error bars represent ± SEM. **, P < 0.01 by t test. Data are representative of three independent experiments for D–F.
Figure S3.
Figure S3.
IL-17 induced HIF1α expression and collagen deposition in human CAFs. (A) Western blot analysis of IL-17A–treated CAFs for 24 and 48 h. (B) Hydroxyproline assay and LOX assay for IL-17A–treated and untreated (Ctrl) human CAFs (48 h). n = 3 technical repeats. Error bars represent ± SEM; *, P < 0.05; **, P < 0.01; ***, P < 0.001 by t test. CAFs for A and B were from three independent human cutaneous SCCs, and data are representative of three independent experiments. (C) Immunofluorescence analysis of IL-17A (green)–producing cells and HIF1α (red) expression in two representative cutaneous SCCs. Scale bar, 100 μm. St, stroma; Tu, tumor islets. Dotted lines are used to show the main boundary of tumor islets and stroma areas. Graph shows correlation of nuclear HIF1α-positive cells (nu-HIF1α+) and IL-17A–producing cells in random stroma areas (40× magnification) of 10 human cutaneous SCCs.
Figure S4.
Figure S4.
Ablation of IL-17 signaling in fibroblasts compromised hydroxylated collagen accumulation and LOX activity in the DMBA/TPA model. (A) Tumor tissues harvested from DMBA/TPA model of indicated genotype at week 16 (TAM untreated) and week 20 (TAM treated at week 18) were subjected to hydroxyproline assay and LOX assay. n = 7 independent specimens of three mice in each group. Error bars represent ± SEM. *, P < 0.05; **, P < 0.01 by t test. (B) Primary skin fibroblasts from HIF1αf/f mice were infected with adenovirus carrying vectors for either GFP (AdGFP) or Cre recombinase (AdCre) to generate control and HIF1α knockout fibroblasts. Infected cells were treated with IL-17A for indicated time and analyzed by Western blot. Western data are representative of three independent experiments.
Figure 5.
Figure 5.
IL-17 induced collagen deposition via Act1-mediated translational control of HIF1α in fibroblasts. (A) CAFs of DMBA/TPA-induced tumors were treated with IL-17A for 8 h followed by RT-PCR and Western analysis of HIF1α expression. Numbers indicate fold-change of HIF1α protein. Bar graph shows relative Hif1α mRNA level. n = 3. Error bars represent ± SEM. t test. (B) Dermal fibroblasts from Act1-deficient mice restored with Act1 WT and Act1 RNA binding mutant (SEFIR1 + 5 mt, referred as 1+5mt) were then untreated or treated with IL-17A (with or without treatment with cycloheximide [CHX], 100 μg/ml) for 6 and 8 h, followed by Western analysis. Data are representative of at least three independent experiments for A and B. (C) CAFs of DMBA/TPA-induced tumors were treated with IL-17A for 8 h followed by polysome fractionation and RT-PCR. Error bars represent ± SEM. **, P < 0.01 by t test. Data are representative of two independent experiments. (D) Secondary-structure prediction of Hif1α-SEB from mouse Hif1α mRNA 3′ UTR (RNAfold web server, http://rna.tbi.univie.ac.at/cgi-bin/RNAWebSuite/RNAfold.cgi). (E) REMSA of purified recombinant Act1 SEFIR and SEFIR RNA binding mutant (1+5mt) to the mouse Hif1α 3′ UTR SBE-containing region (transcript position: 3,113–3,200). (F) Dermal fibroblasts were treated with IL-17A for 8 h followed by anti-Act1 RIP and RT-PCR for Hif1α mRNA. n = 3 technical repeats. Error bars represent ± SD. *, P < 0.05 by t test. (G and H) Dermal fibroblasts were isolated from Act1-deficient mice and retrovirally restored with wild-type Act1 or mutant Act that is defective in the ability to bind to mRNA (referred as 1+5mt; G). HLH, helix-loop-helix. Cells were then treated or not with IL-17A for indicated times followed by Western analysis (H). (I) Act1-deficient dermal fibroblasts restored with Act1 WT or Act1(1+5mt) were left untreated or treated with IL-17A, then subjected to hydroxyproline assay and LOX assay. n = 3 technical repeats. Error bars represent ± SEM. *, P < 0.05 by t test. Data are representative of at least three independent experiments for E–I.
Figure 6.
Figure 6.
Targeting IL-17 induced Act1-Hif1α-SBE interaction and reconditioned the TME for improved responses to antiPD-L1. (A) Competition REMSA of recombinant Act1 SEFIR domain using the Hif1α mRNA 3′ UTR SBE-containing region as a probe (Fig. 5 E) and either Hif1α aptamer or control aptamer. (B) CAFs of DMBA/TPA-induced tumors transfected with control or Hif1α aptamers were treated with IL-17A for 8 h followed by anti-Act1 RIP and RT-PCR analysis for Hif1α mRNA. n = 3 technical repeats. Error bars represent ± SD. *, P < 0.05 by t test. (C) CAFs of DMBA/TPA-induced tumors transfected with control or Hif1α aptamers were then untreated or treated with IL-17A for indicated times followed by Western analysis. (D) CAFs of DMBA/TPA-induced tumors transfected with control or Hif1α aptamers were then untreated or treated with IL-17A, followed by hydroxyproline assay and LOX assay. n = 3 technical repeats. Error bars represent ± SEM. *, P < 0.05; **, P < 0.01 by t test. Data are representative of at least three independent experiments for A–D. (E) Tumor volumes from PDVC57 model over the time course of experiment with control or Hif1α aptamer. C57BL/6 mice with similar tumor size (five mice in each group) were used for indicated treatments. Error bars represent ± SEM. *, P < 0.05 by t test. SQ inj., subcutaneously injected. (F) Representative images of CD8 staining of tumors from anti–PD-L1 + Ctrl aptamer or anti–PD-L1 + Hif1α aptamer treated tumors from E. Scale bar, 100 μm. Bar graph represents GzmB+ cell ratio in the tumor islets over total GzmB+ cells (in stroma and in tumor islets). Dotted lines are used to show the main boundary of tumor islets and stroma areas. n = 5 biological samples. Error bars represent ± SEM. **, P < 0.01 by t test. St, stroma; Tu, tumor islets. (G and H) Western analysis of indicated proteins (G) and hydroxyproline assay and LOX assay (H) in tumor lysates from control aptamer or Hif1α aptamer treated tumors that had been under immunotherapy (anti–PD-L1) from endpoint of E. n = 5. Error bars represent ± SEM. *, P < 0.05; **, P < 0.01 by t test. Each lane indicates an individual sample. (I) Relative mRNA level of indicated gene expression in PDVC57 tumors treated with control or Hif1α aptamer together with anti–PD-L1. n = 5 biological samples. Error bars represent ± SEM. t test. Data are representative of two independent experiments for E–I.
Figure 7.
Figure 7.
Model for the IL-17–induced, Act1-promoted, HIF1α-mediated collagen deposition program.

Comment in

References

    1. Akbay, E.A., Koyama S., Liu Y., Dries R., Bufe L.E., Silkes M., Alam M.M., Magee D.M., Jones R., Jinushi M., et al. . 2017. Interleukin-17A promotes lung tumor progression through neutrophil attraction to tumor sites and mediating resistance to PD-1 blockade. J. Thorac. Oncol. 12:1268–1279. 10.1016/j.jtho.2017.04.017 - DOI - PMC - PubMed
    1. Amatya, N., Childs E.E., Cruz J.A., Aggor F.E.Y., Garg A.V., Berman A.J., Gudjonsson J.E., Atasoy U., and Gaffen S.L.. 2018. IL-17 integrates multiple self-reinforcing, feed-forward mechanisms through the RNA binding protein Arid5a. Sci. Signal. 11:eaat4617. 10.1126/scisignal.aat4617 - DOI - PMC - PubMed
    1. Bentovim, L., Amarilio R., and Zelzer E.. 2012. HIF1alpha is a central regulator of collagen hydroxylation and secretion under hypoxia during bone development. Development. 139:4473–4483. 10.1242/dev.083881 - DOI - PubMed
    1. Binnewies, M., Roberts E.W., Kersten K., Chan V., Fearon D.F., Merad M., Coussens L.M., Gabrilovich D.I., Ostrand-Rosenberg S., Hedrick C.C., et al. . 2018. Understanding the tumor immune microenvironment (TIME) for effective therapy. Nat. Med. 24:541–550. 10.1038/s41591-018s4150014-x - DOI - PMC - PubMed
    1. Buchmann, A., Ruggeri B., Klein-Szanto A.J., and Balmain A.. 1991. Progression of squamous carcinoma cells to spindle carcinomas of mouse skin is associated with an imbalance of H-ras alleles on chromosome 7. Cancer Res. 51:4097–4101. - PubMed

Publication types

MeSH terms