. 2022 Oct;129(5):1144-1182.
doi: 10.1037/rev0000366. Epub 2022 Apr 7.

Salience by competitive and recurrent interactions: Bridging neural spiking and computation in visual attention

Affiliations

Salience by competitive and recurrent interactions: Bridging neural spiking and computation in visual attention

Gregory E Cox et al. Psychol Rev. 2022 Oct.

Abstract

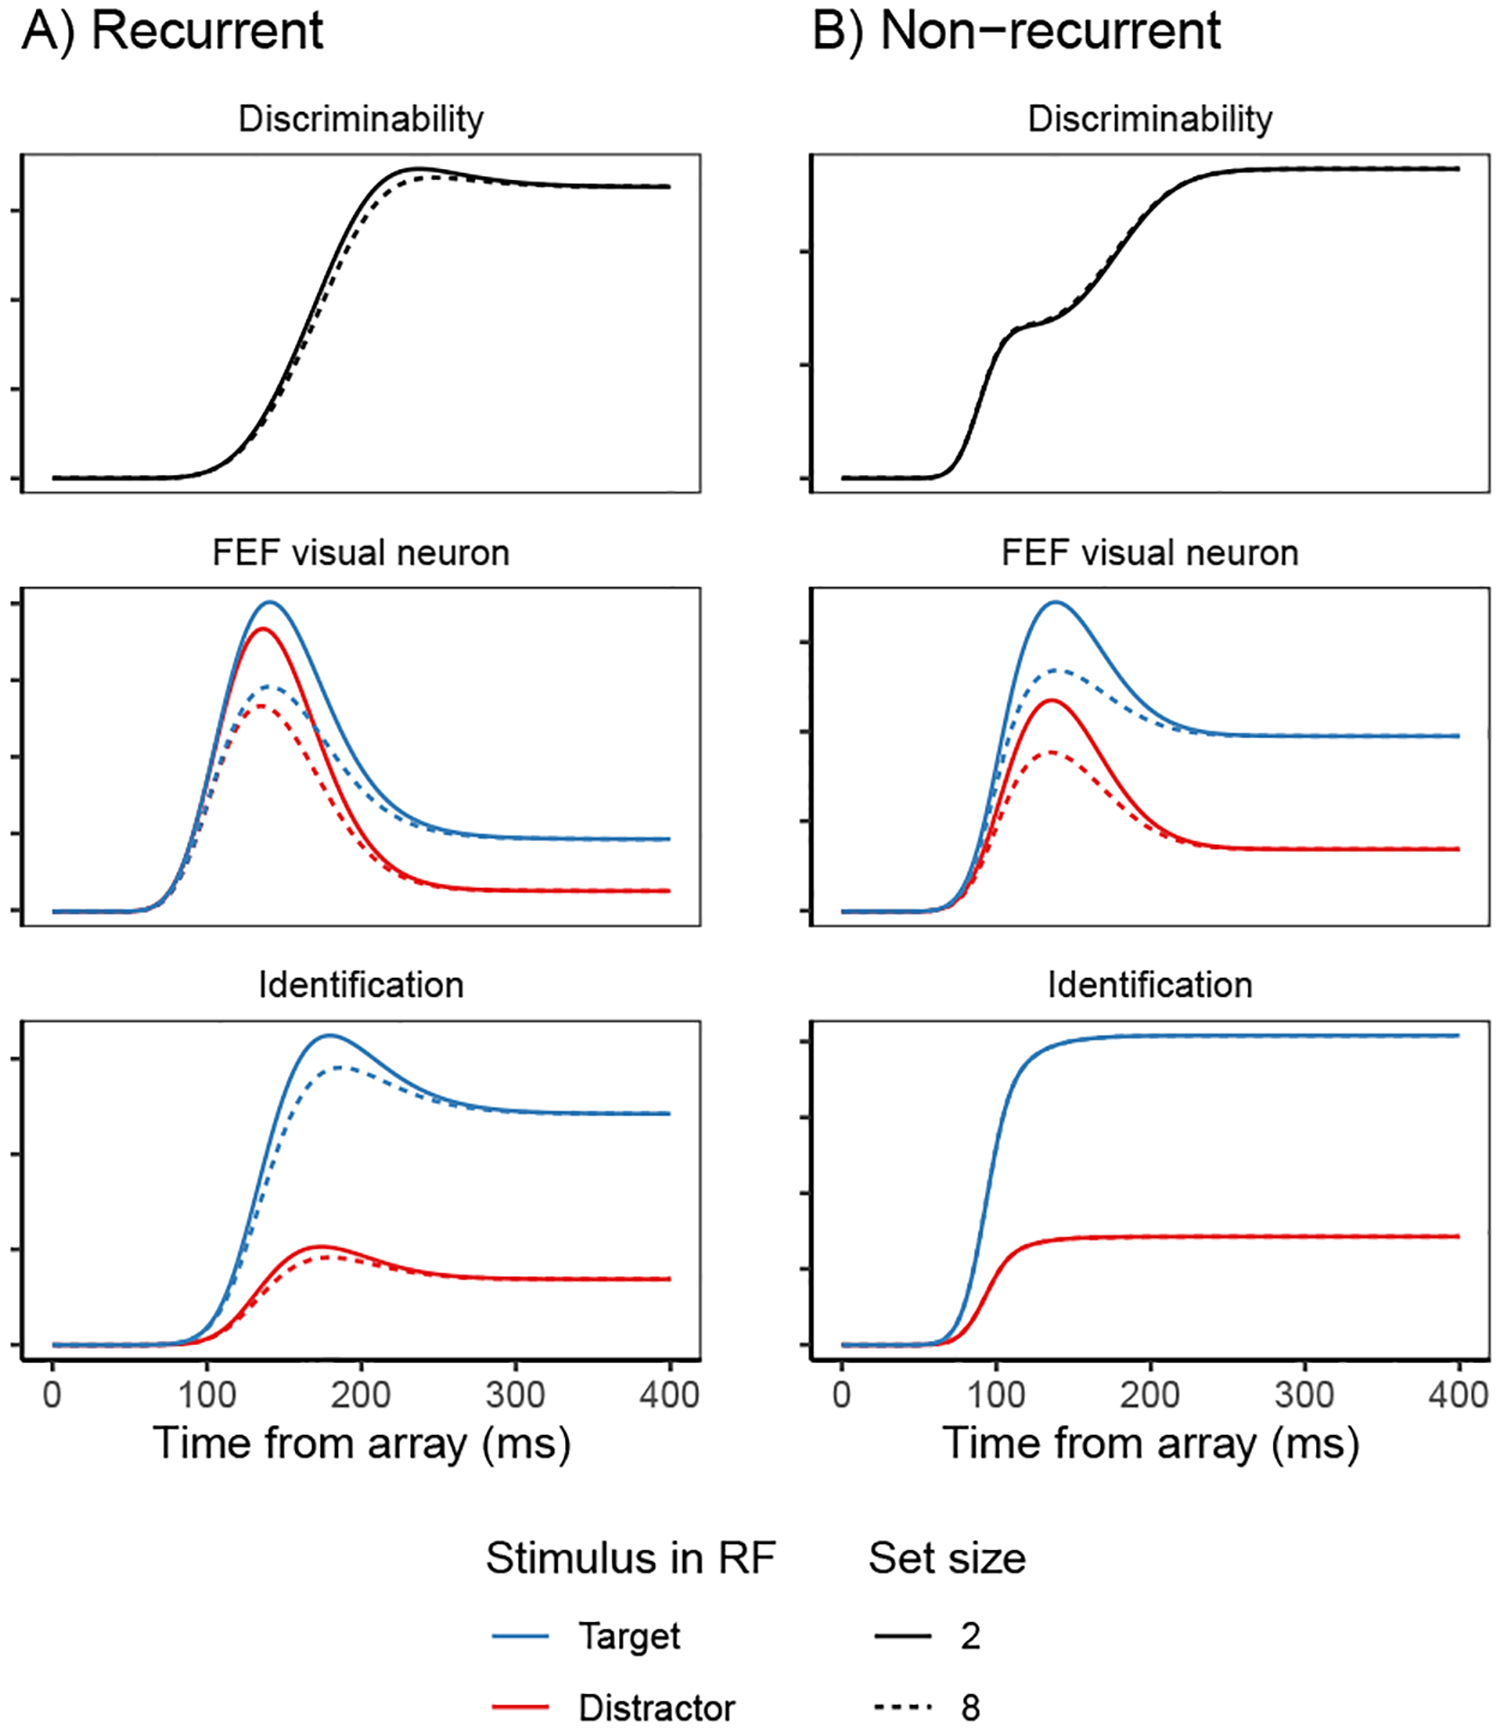
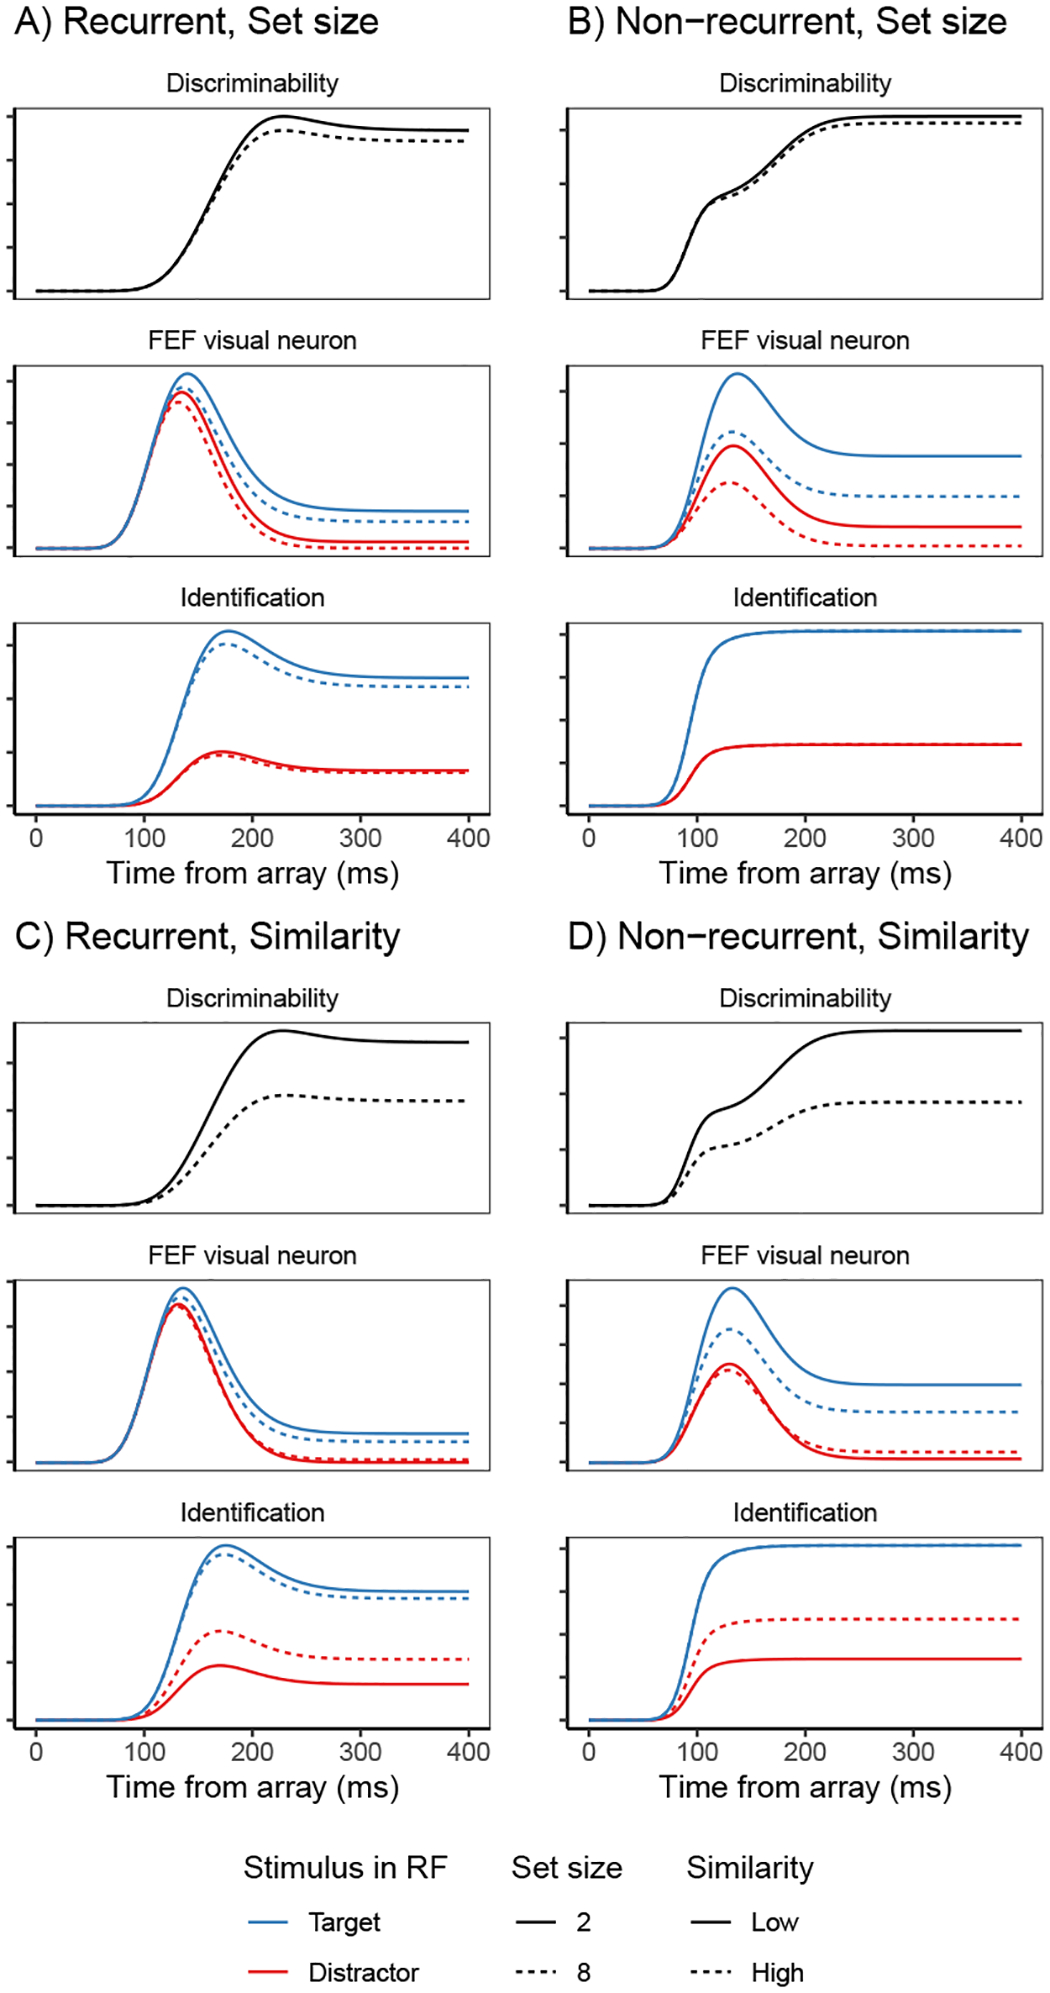
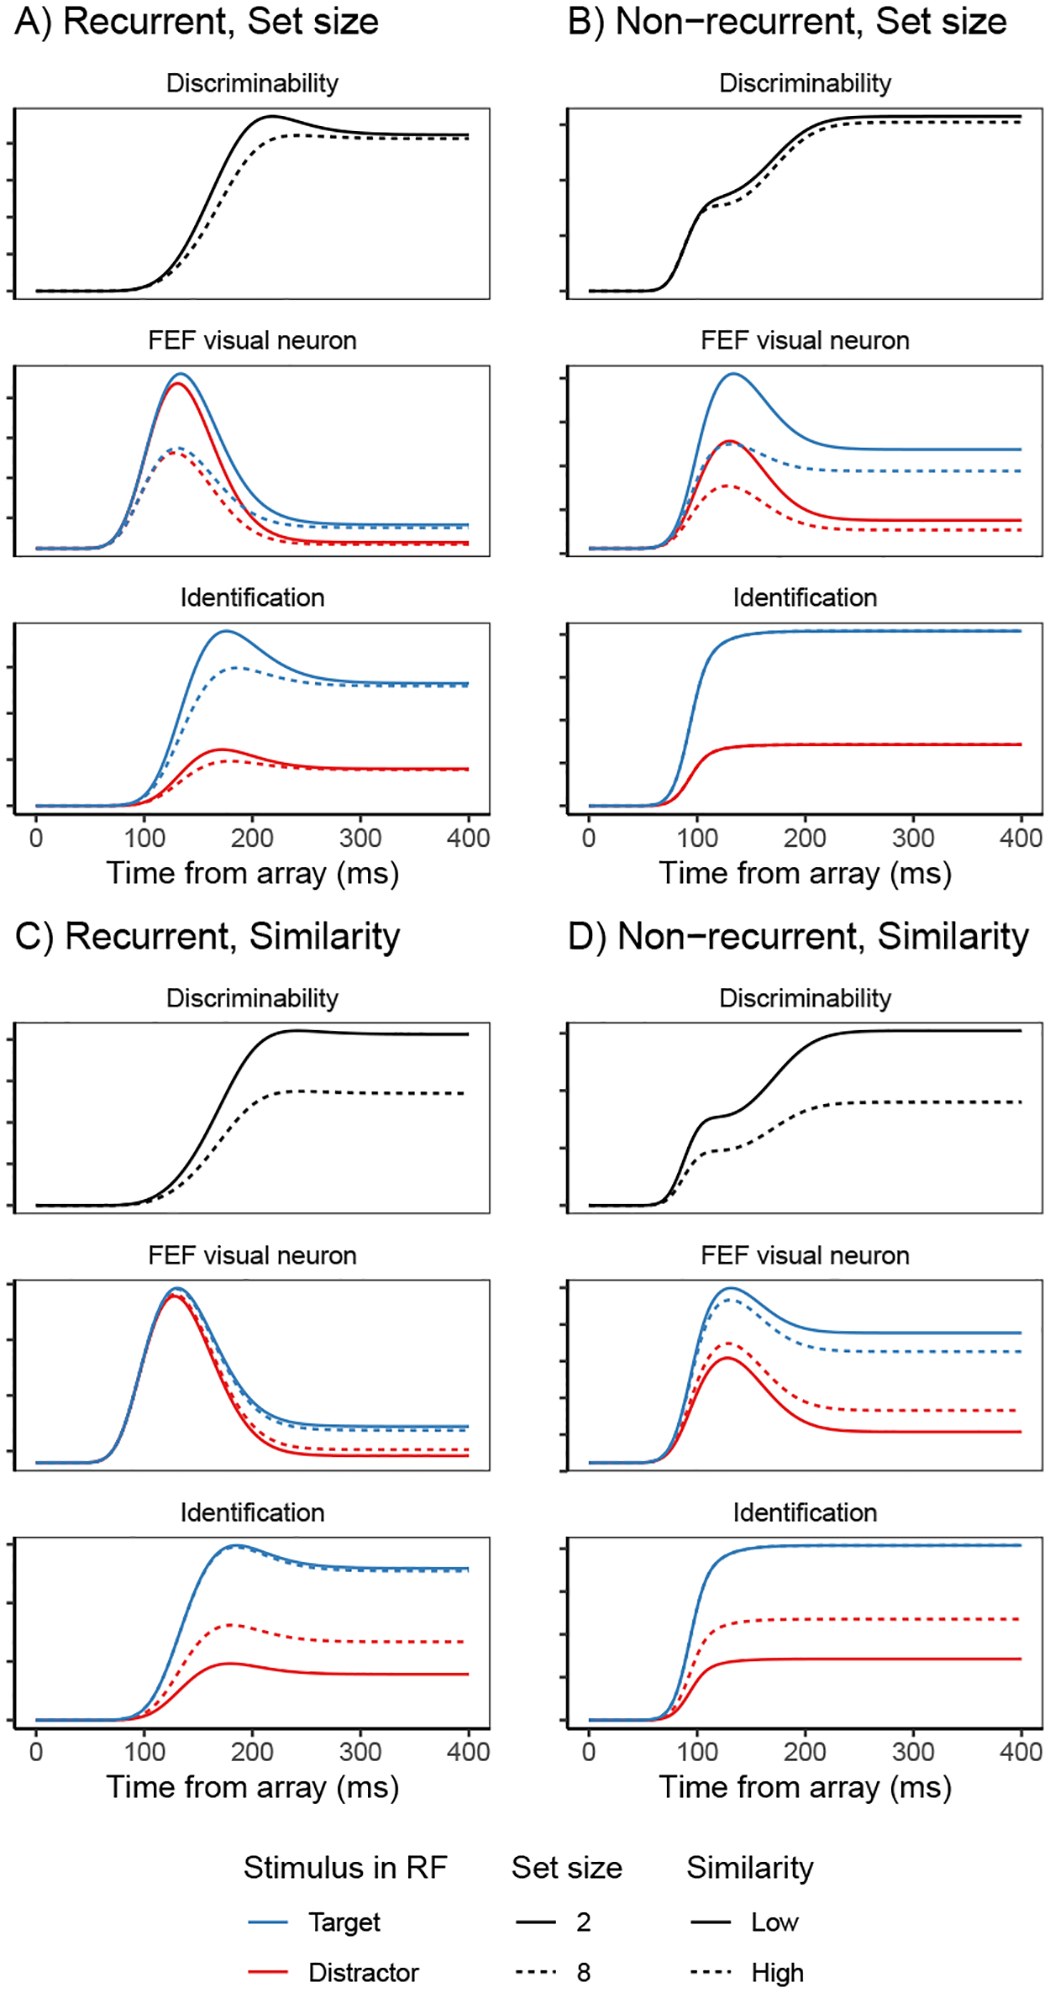
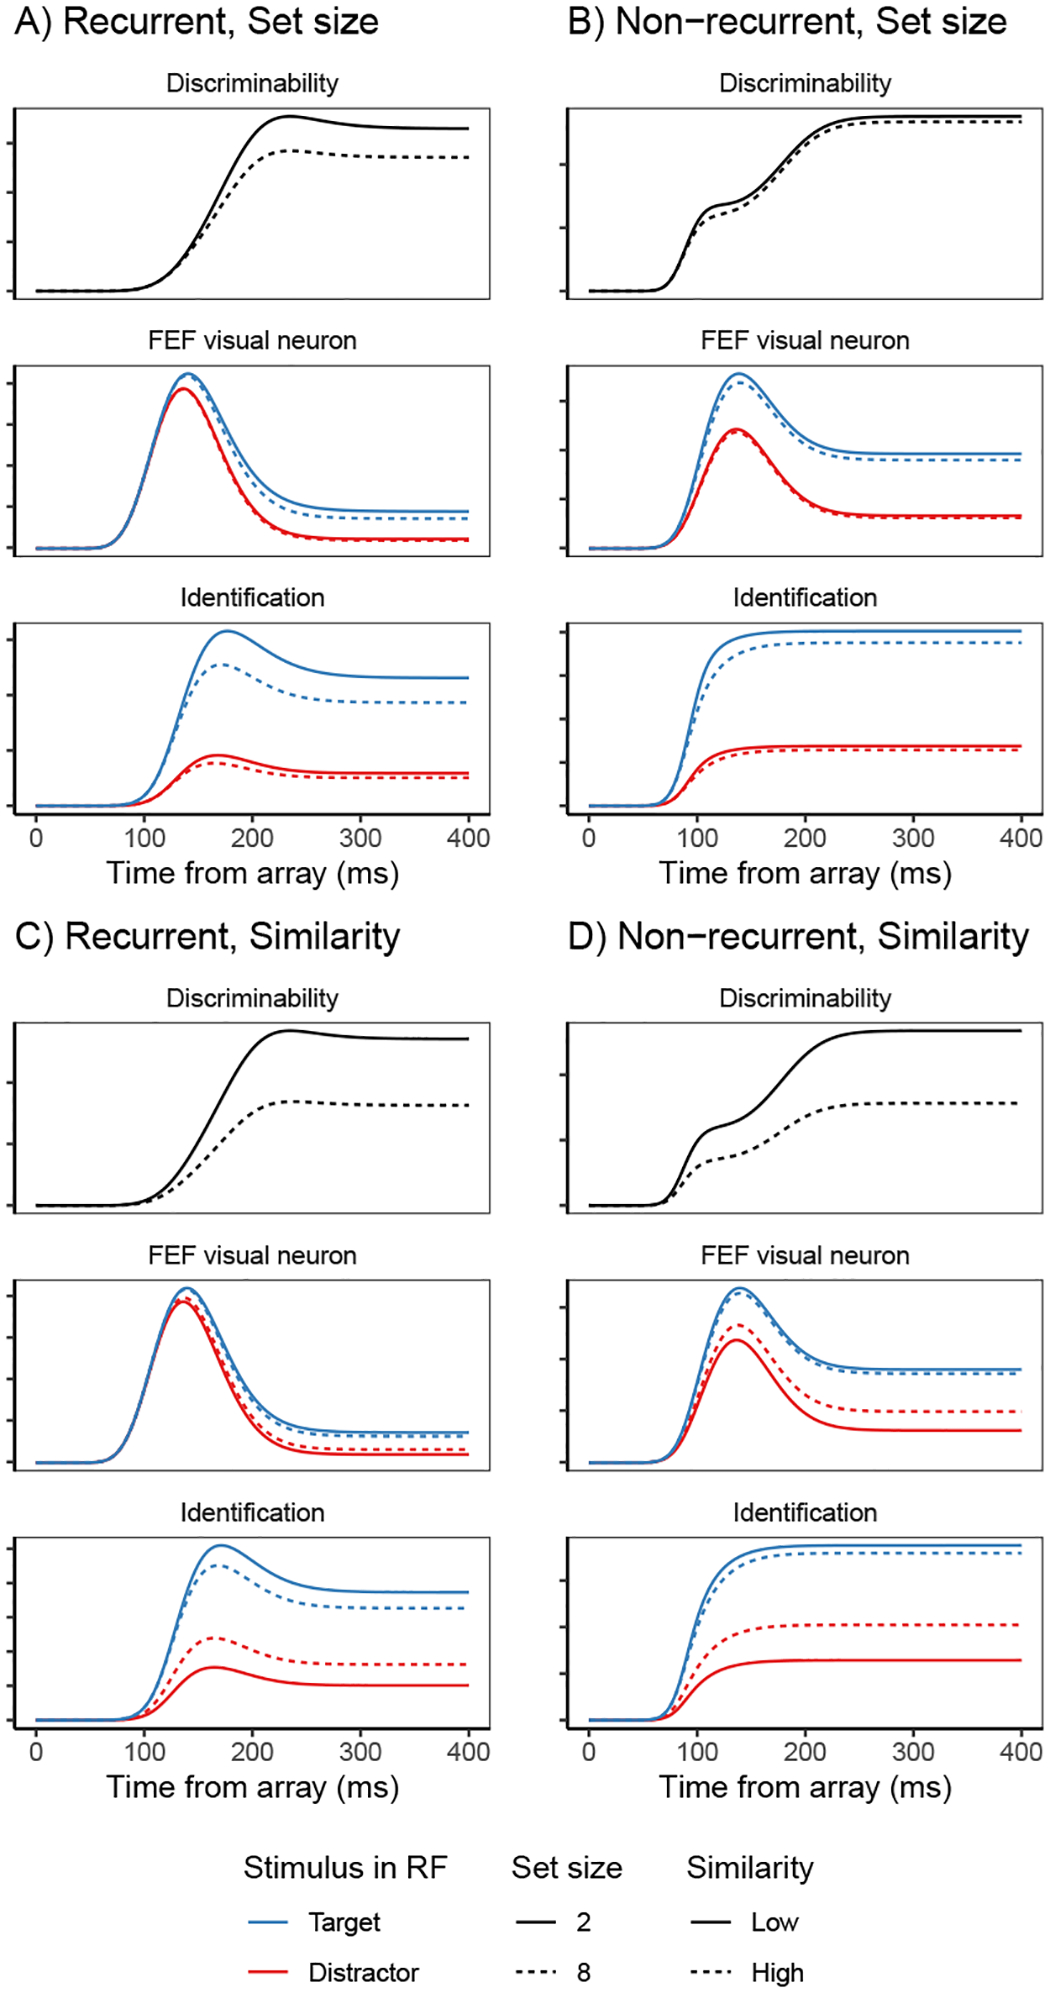
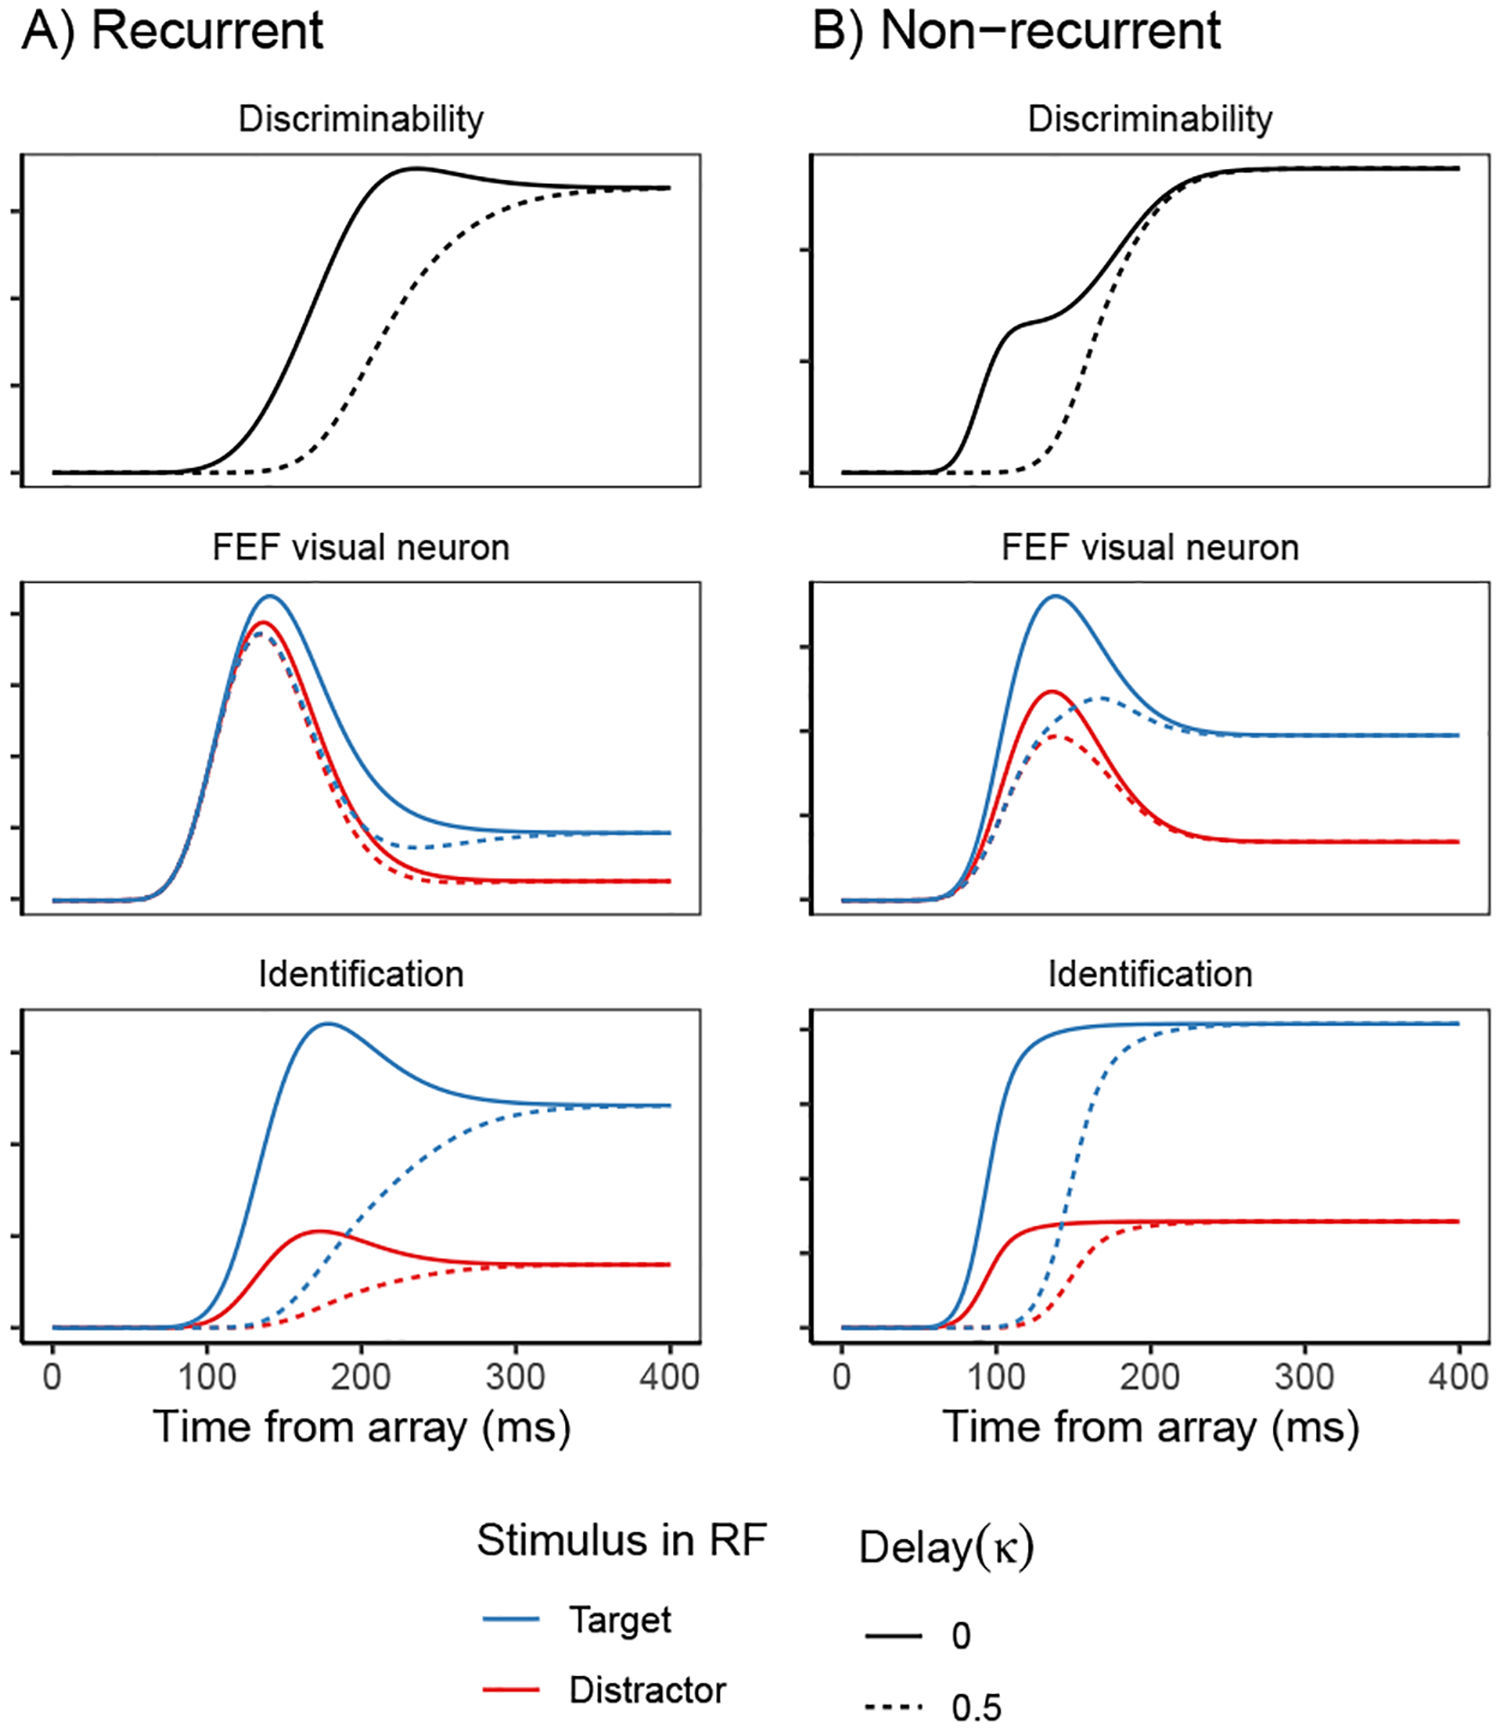
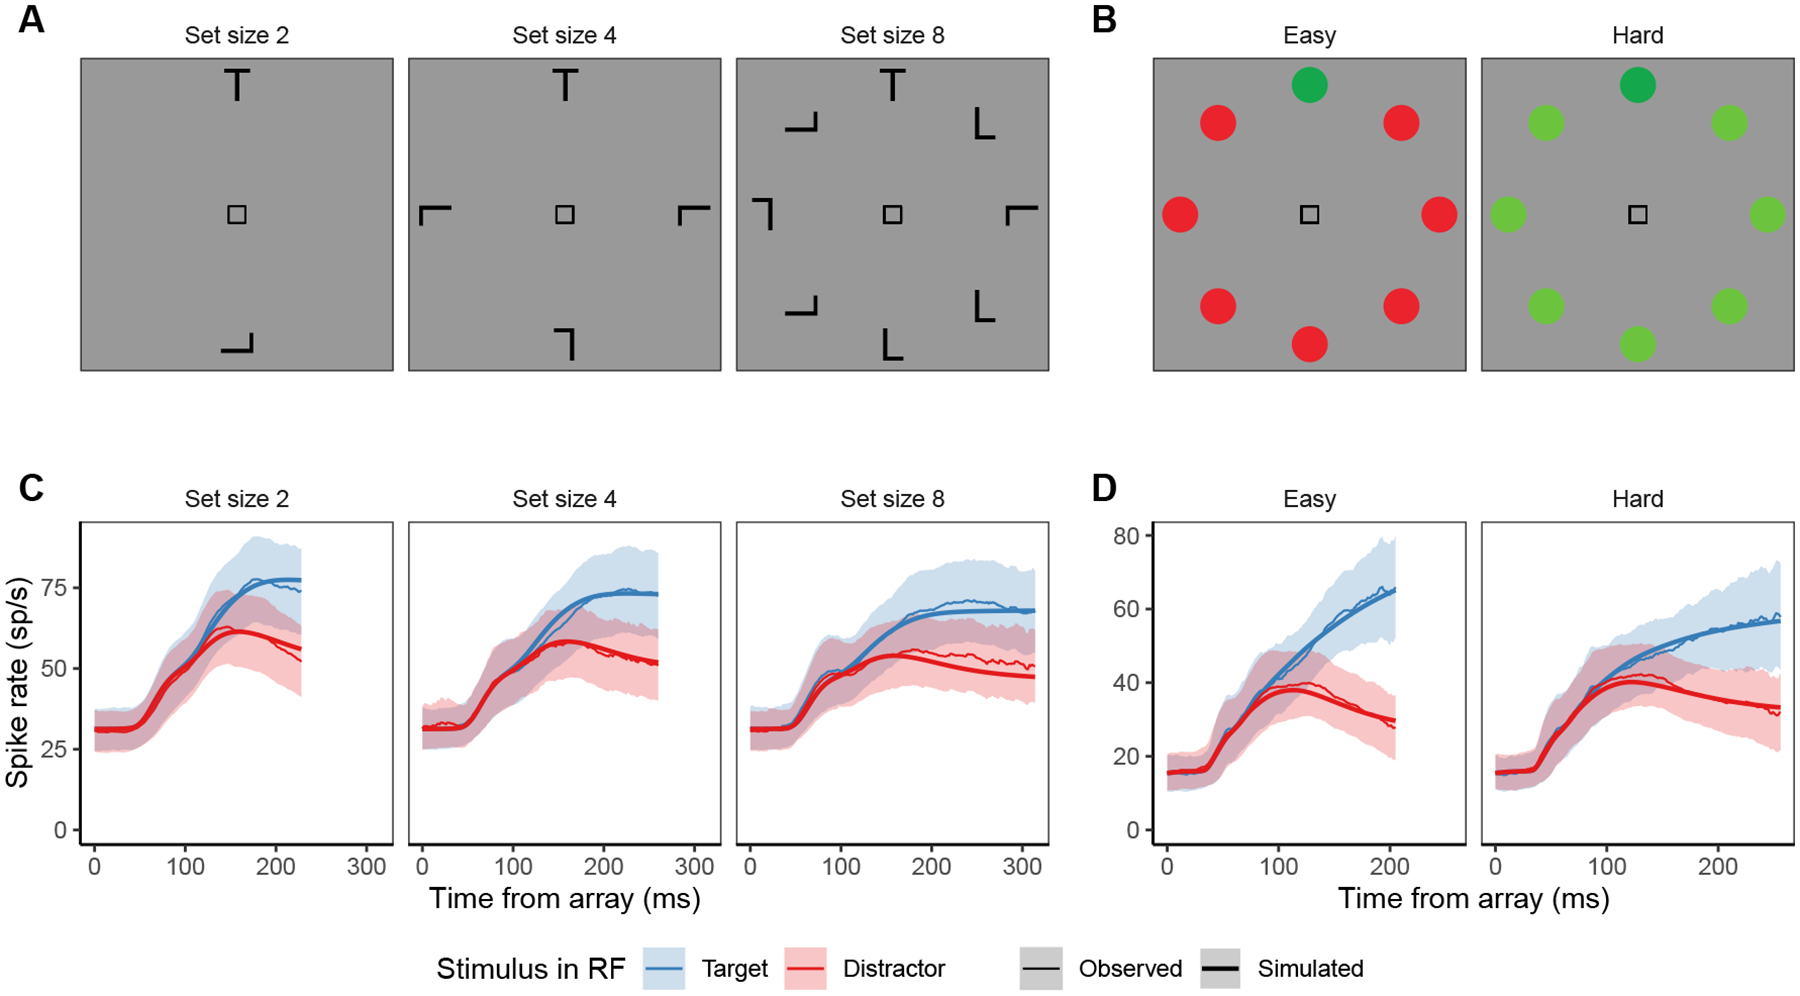
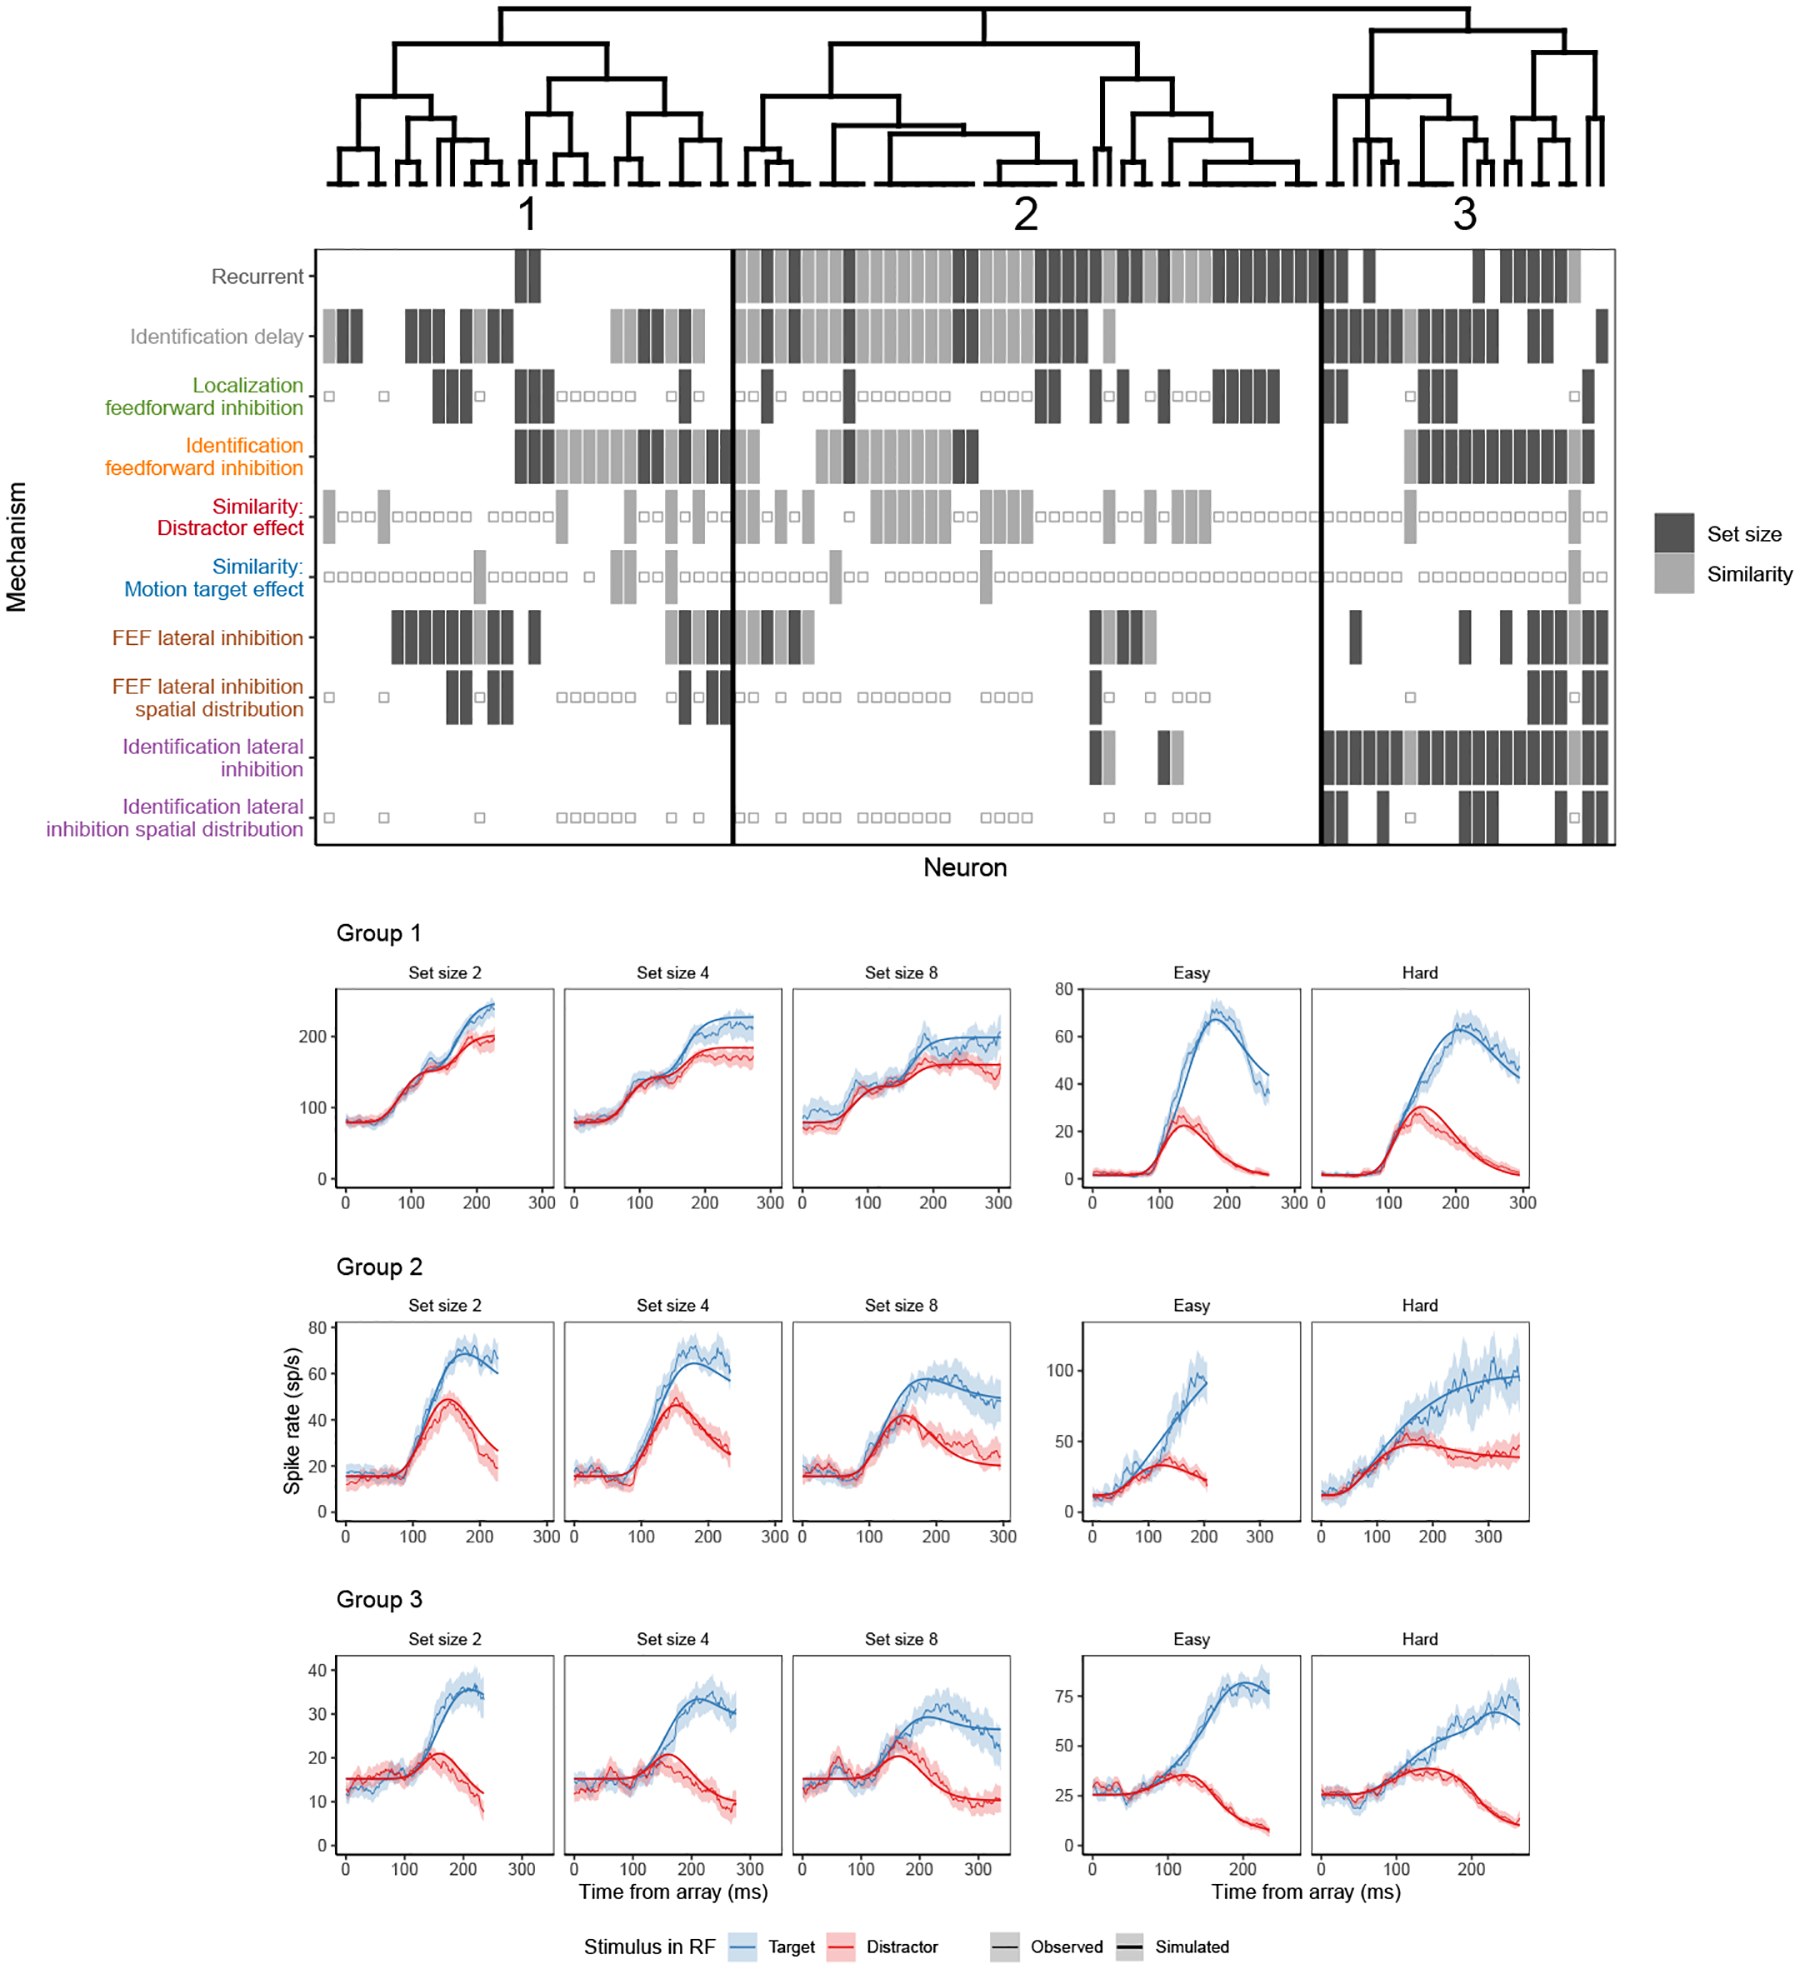
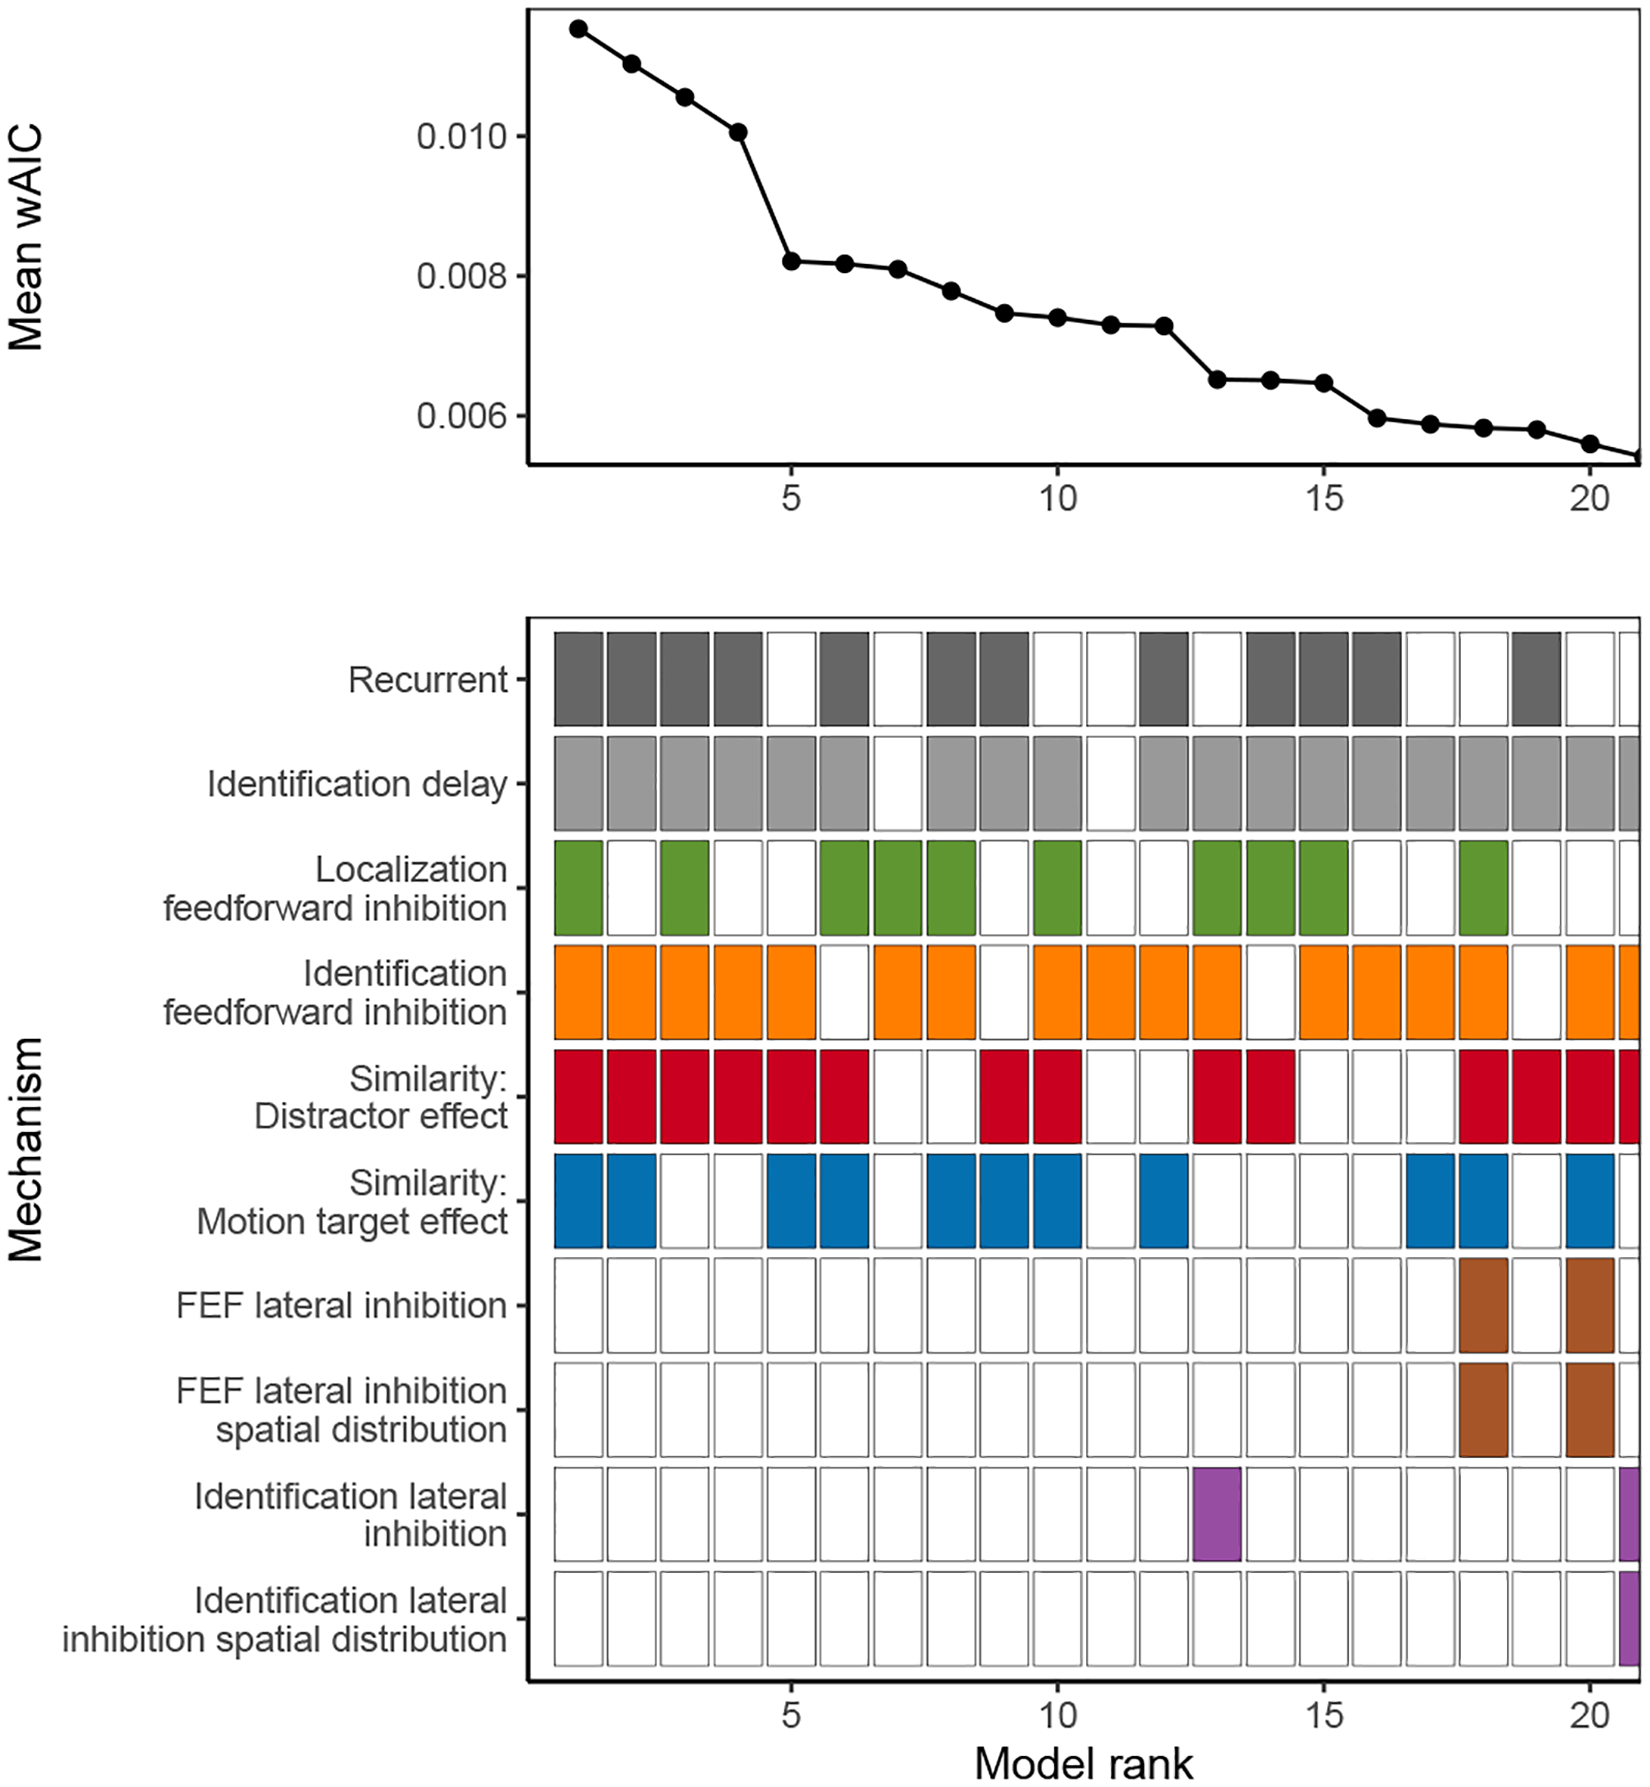
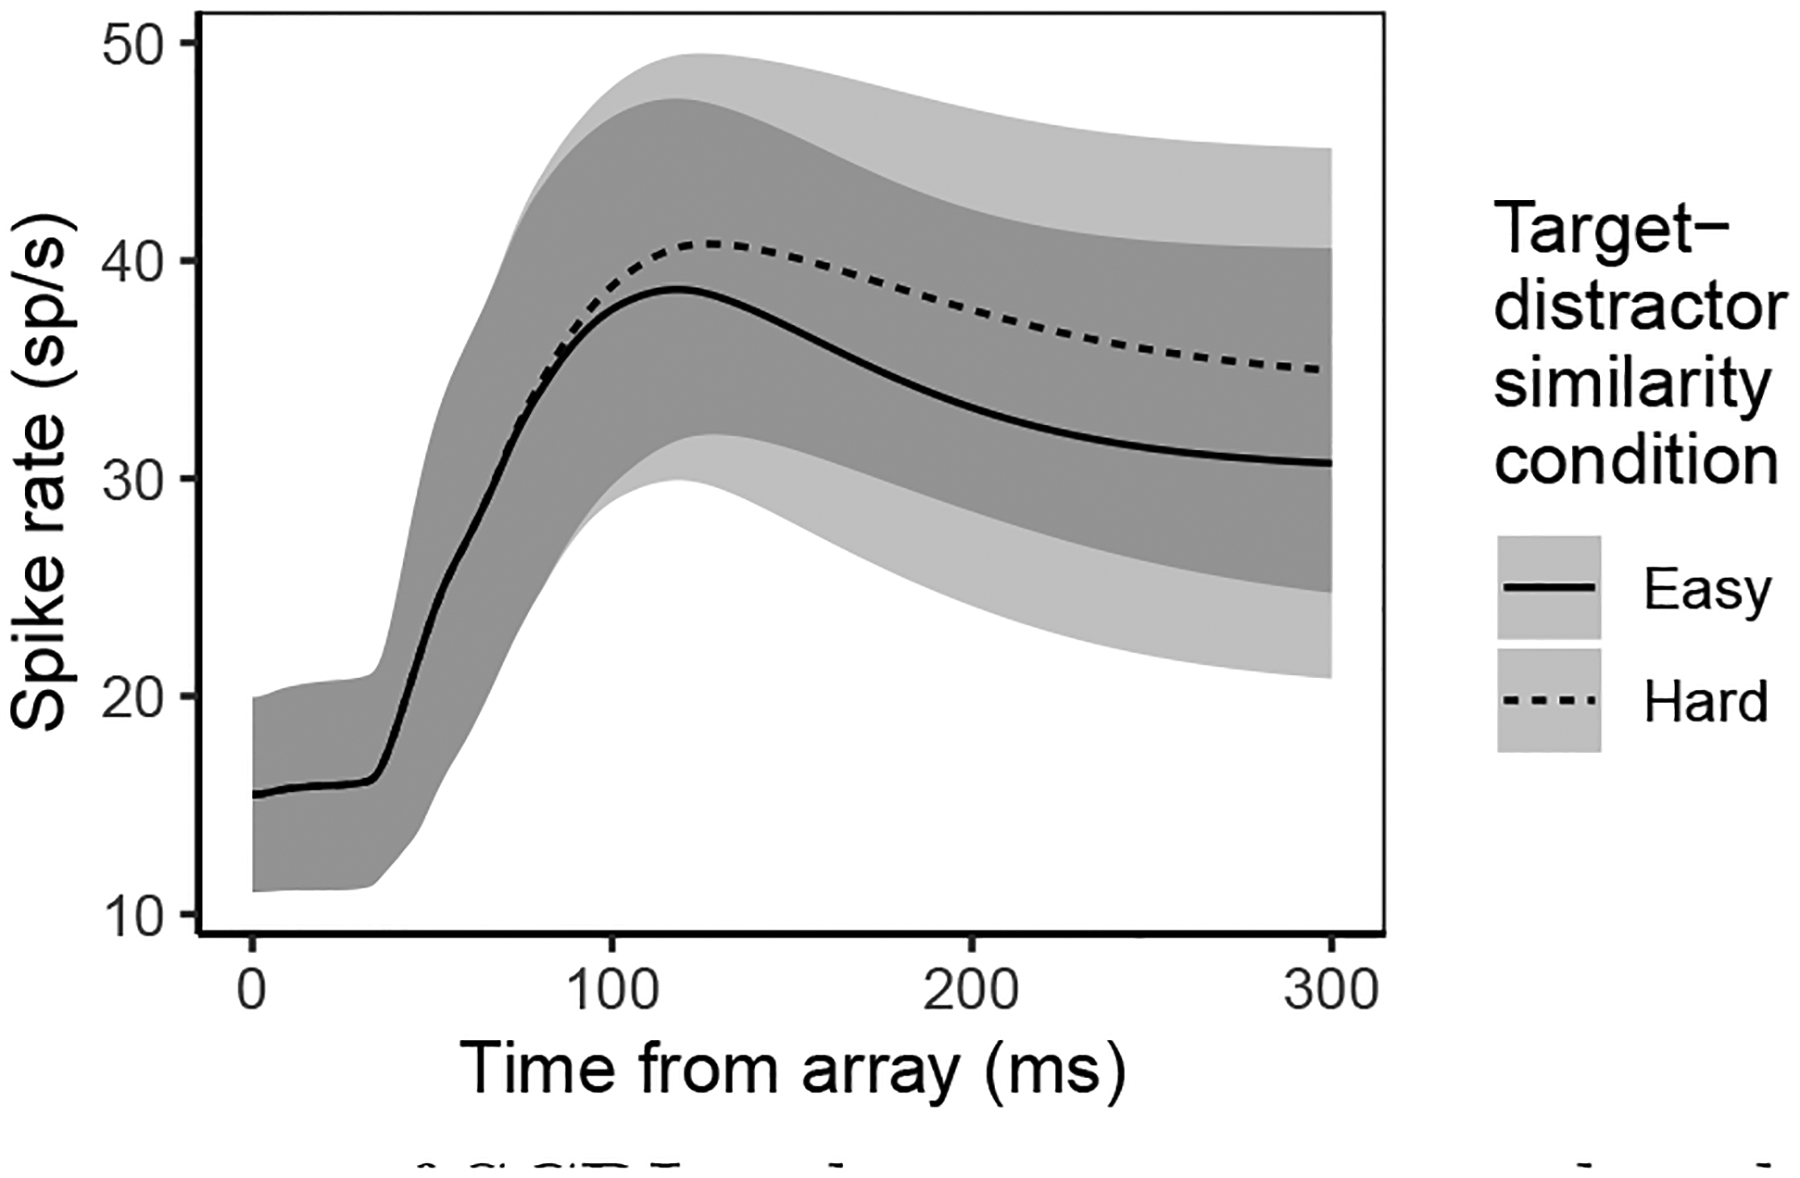
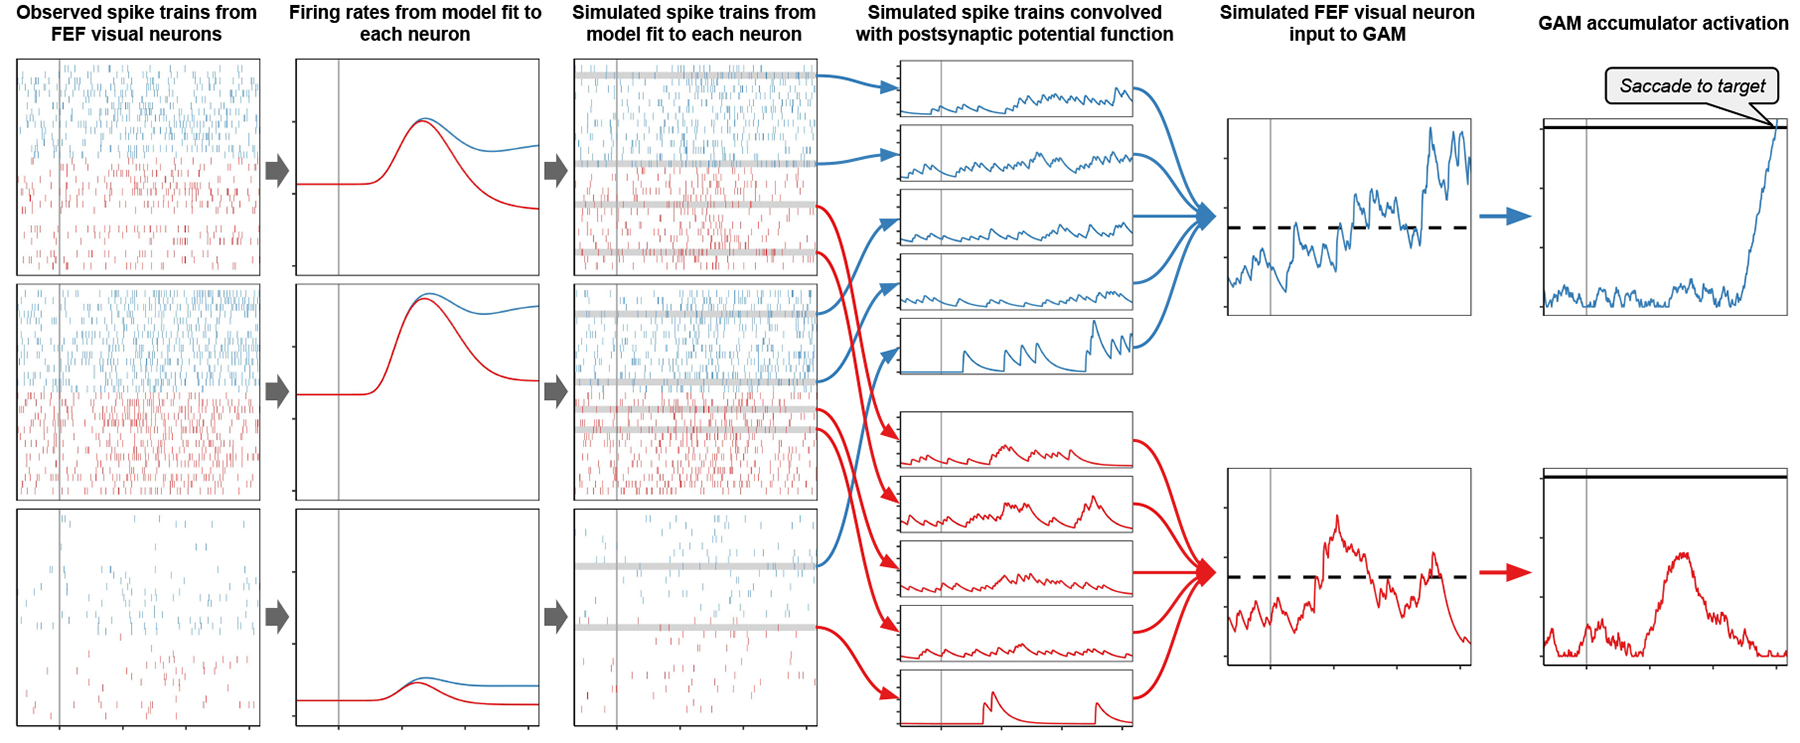
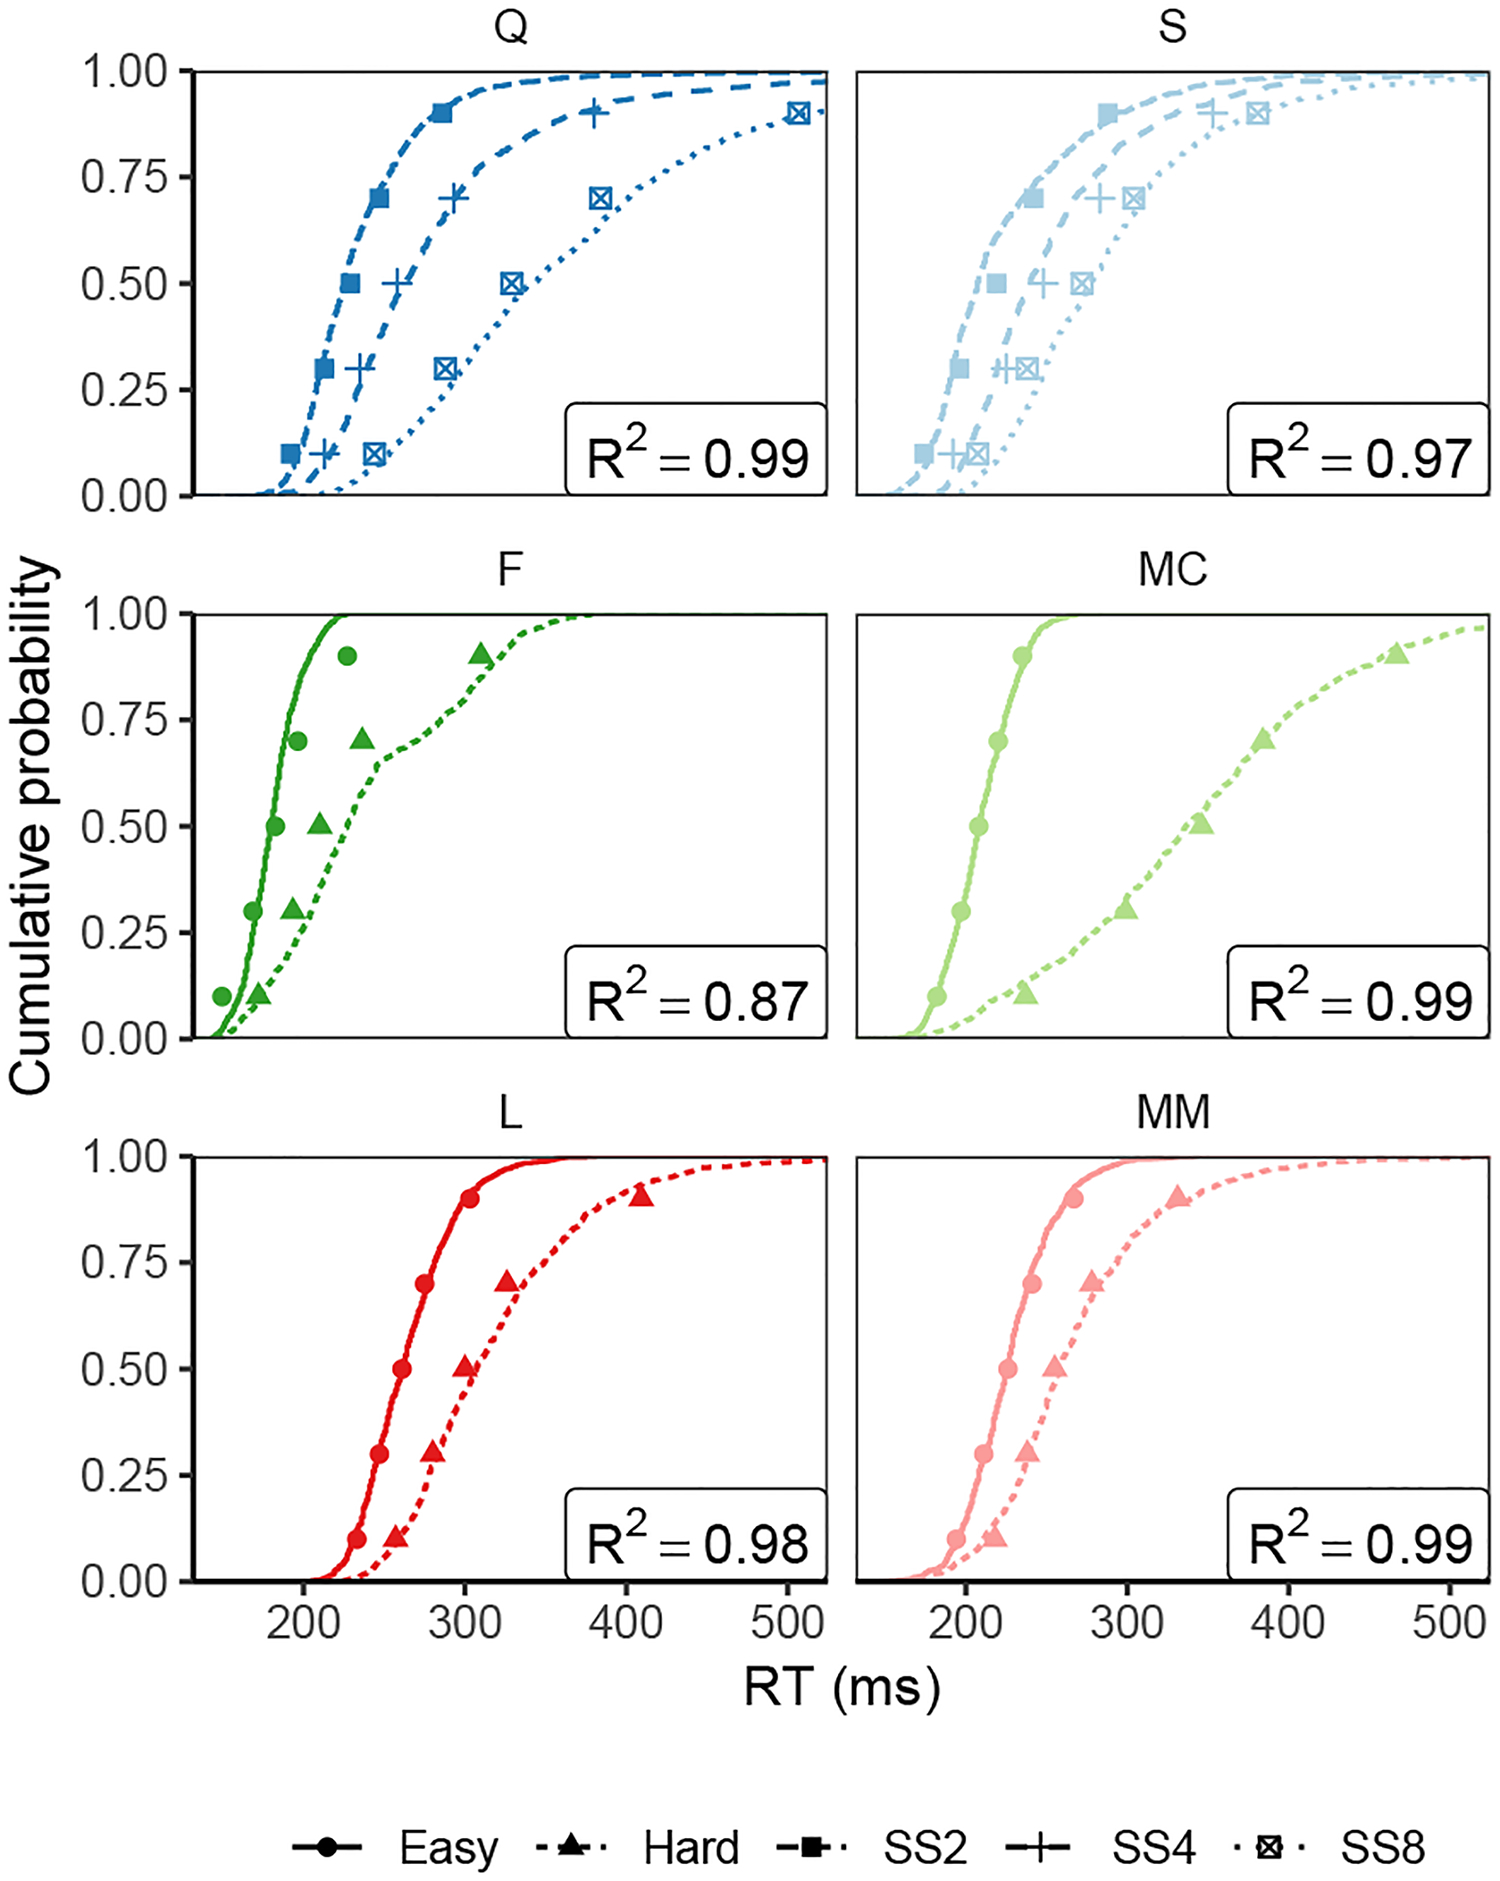
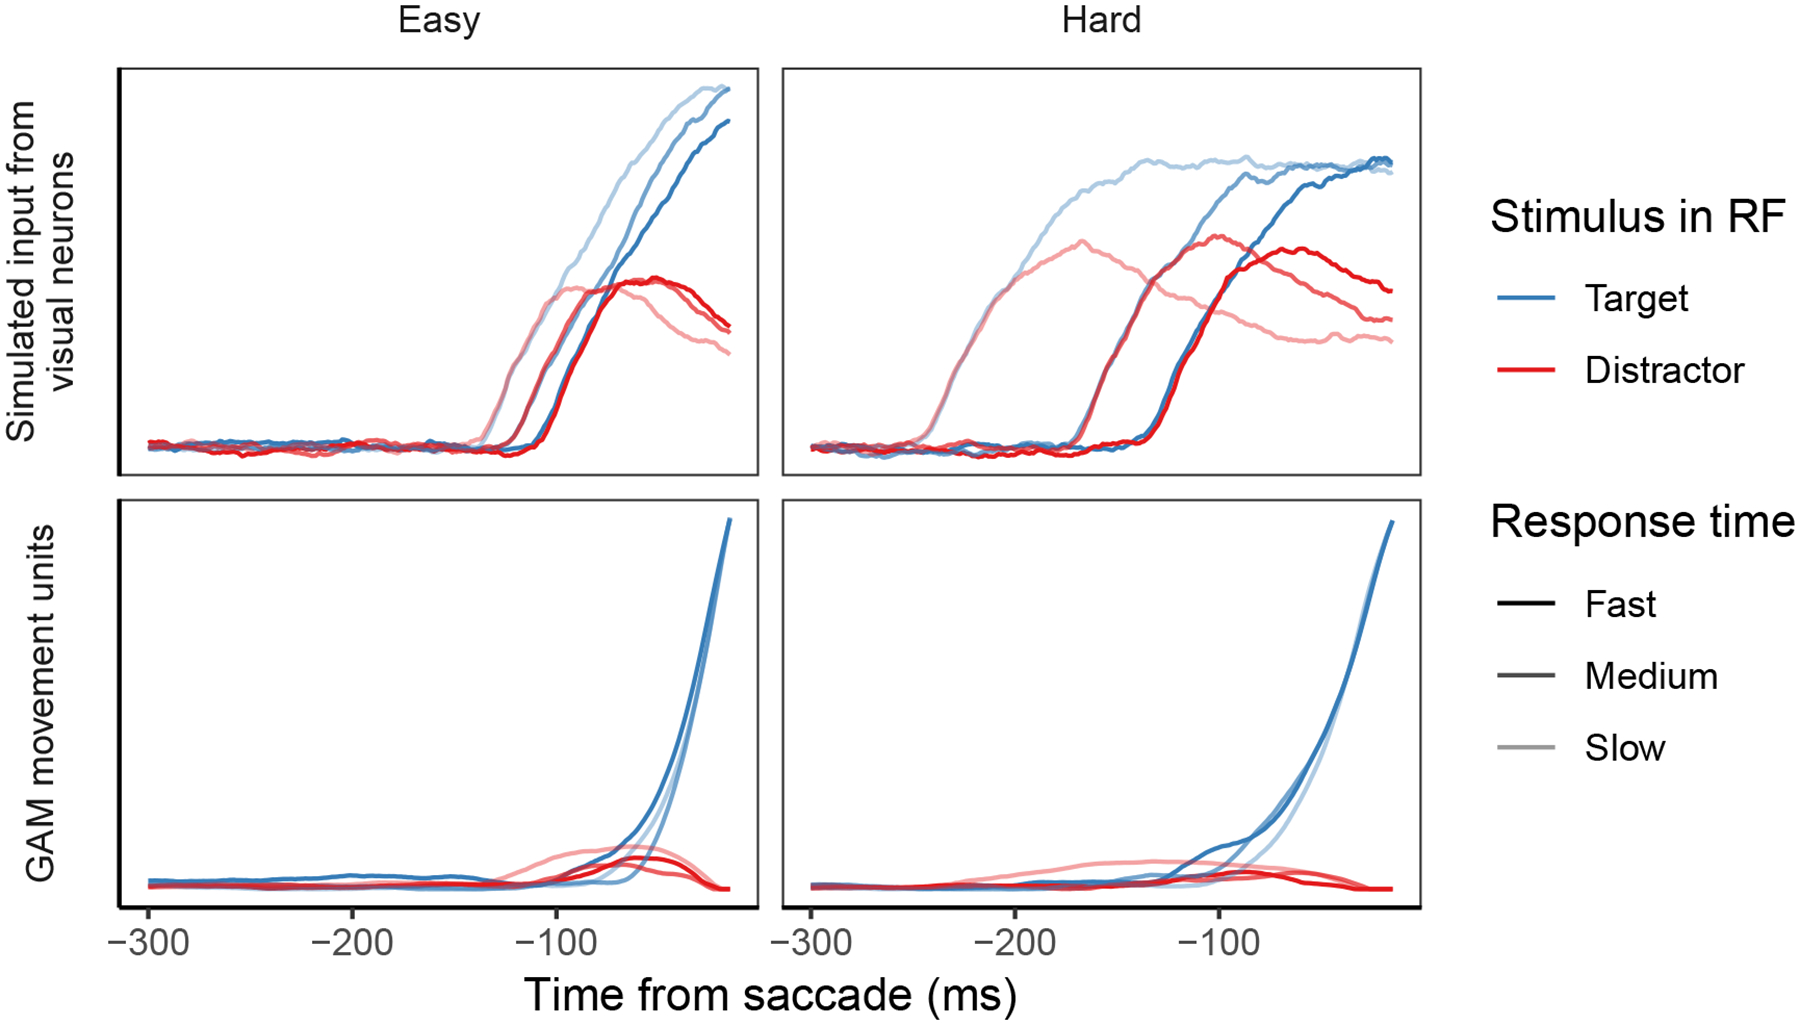
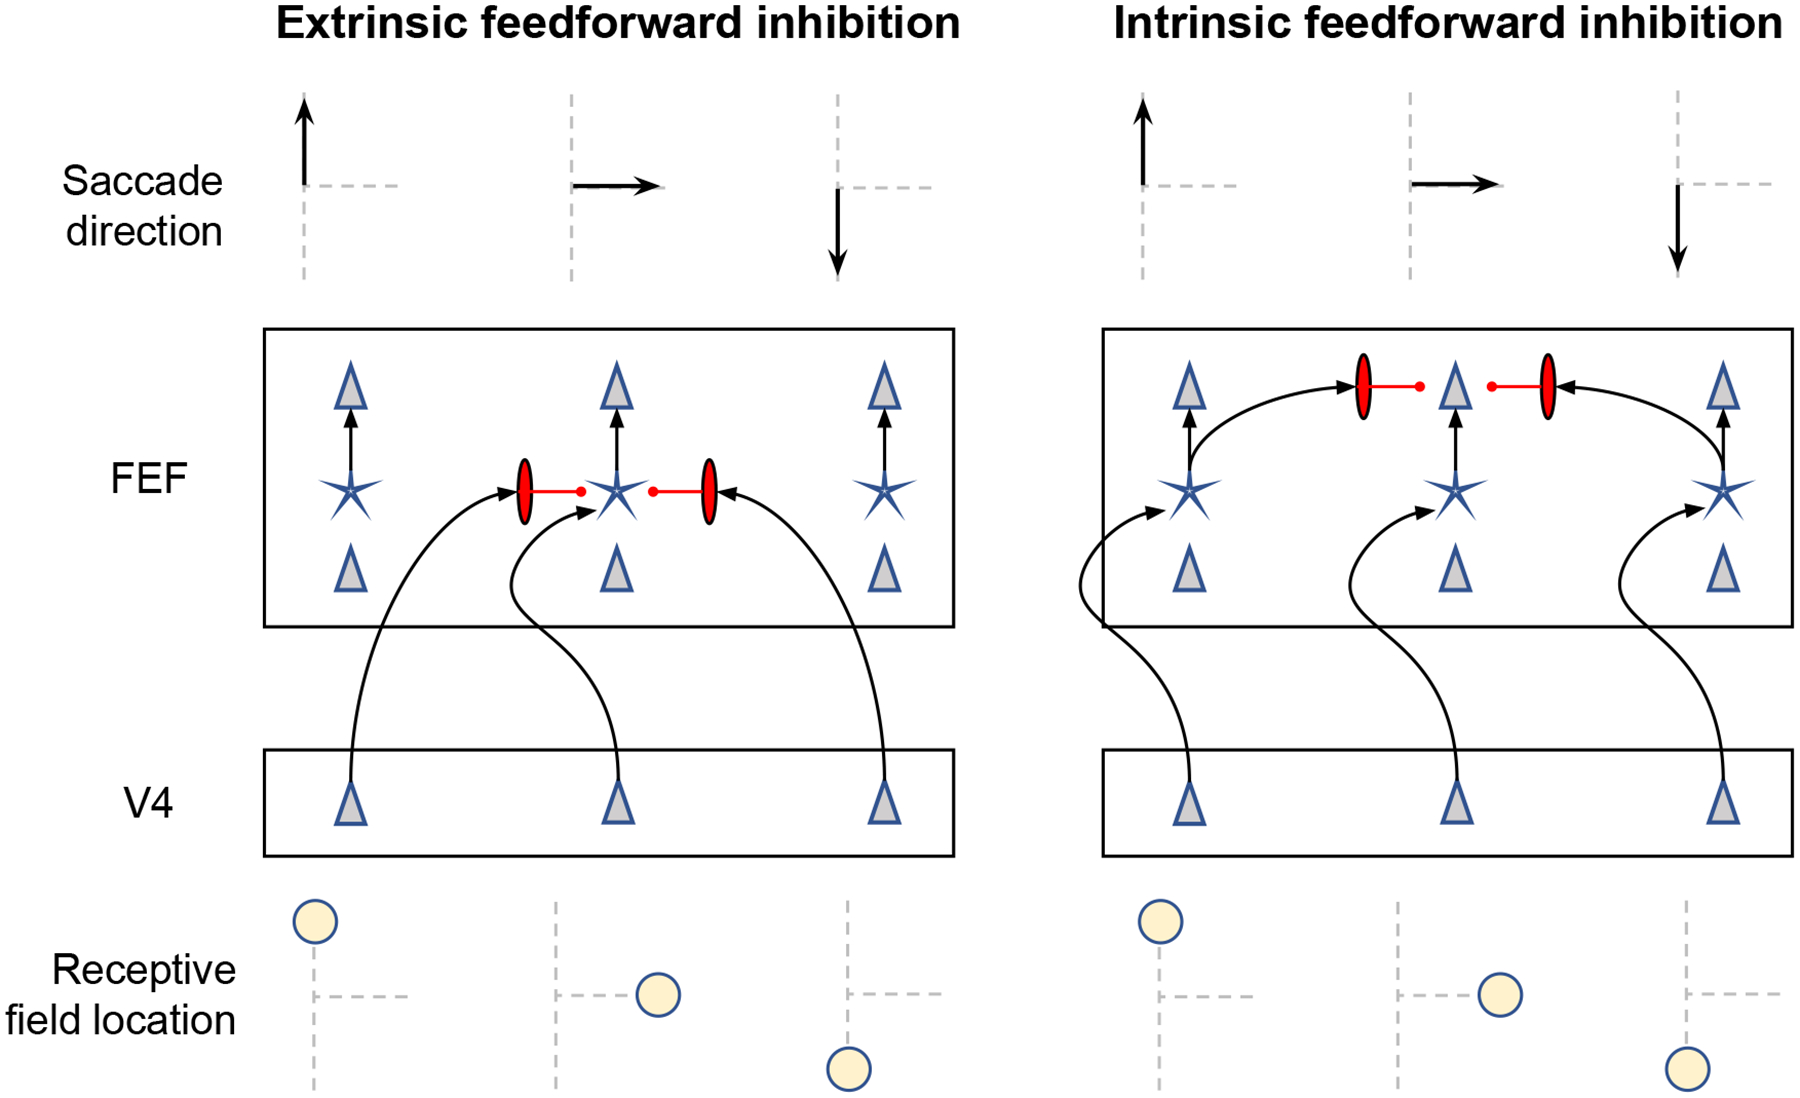
Decisions about where to move the eyes depend on neurons in frontal eye field (FEF). Movement neurons in FEF accumulate salience evidence derived from FEF visual neurons to select the location of a saccade target among distractors. How visual neurons achieve this salience representation is unknown. We present a neuro-computational model of target selection called salience by competitive and recurrent interactions (SCRI), based on the competitive interaction model of attentional selection and decision-making (Smith & Sewell, 2013). SCRI selects targets by synthesizing localization and identification information to yield a dynamically evolving representation of salience across the visual field. SCRI accounts for neural spiking of individual FEF visual neurons, explaining idiosyncratic differences in neural dynamics with specific parameters. Many visual neurons resolve the competition between search items through feedforward inhibition between signals representing different search items, some also require lateral inhibition, and many act as recurrent gates to modulate the incoming flow of information about stimulus identity. SCRI was tested further by using simulated spiking representations of visual salience as input to the gated accumulator model of FEF movement neurons (Purcell et al., 2010, 2012). Predicted saccade response times fit those observed for search arrays of different set sizes and different target-distractor similarities, and accumulator trajectories replicated movement neuron discharge rates. These findings offer new insights into visual decision-making through converging neuro-computational constraints and provide a novel computational account of the diversity of FEF visual neurons. (PsycInfo Database Record (c) 2022 APA, all rights reserved).


Figures

Figure B1.
Figure B1.
How localization feedforward inhibition (αx) manifests in the dynamics of FEF visual neurons and their corresponding identification units as a function of set size.
Figure B2.
Figure B2.
How identification feedforward inhibition (αz) manifests in the dynamics of FEF visual neurons and their corresponding identification units as a function of set size and target-distractor similarity.
Figure B3.
Figure B3.
How lateral inhibition between FEF visual neurons (βv) manifests in the dynamics of FEF visual neurons and their corresponding identification units as a function of set size and target-distractor similarity.
Figure B4.
Figure B4.
How lateral inhibition between identification units (βz) manifests in the dynamics of FEF visual neurons and their corresponding identification units as a function of set size and target-distractor similarity.
Figure B5.
Figure B5.
How delayed availability of identification information (κ) manifests in the dynamics of FEF visual neurons and their corresponding identification units.
Figure C1.
Figure C1.
Results from parameter recovery simulations for different SCRI parameters. Parameter values used to generate simulated data are on the horizontal axis while fitted parameter values (to the simulated data) are on the vertical axis. Text in each panel provides the Pearson correlation between generating and fitted parameter values in each panel for each value of the number of simulated trials. Axes are on logarithmic scales. Dashed lines show the line of equality.
Figure G1.
Figure G1.
Summed AIC across all neurons in the dataset for each combination of SCRI mechanisms. Filled boxes in the bottom panel indicate the mechanism is included, empty boxes that it is not. Colors for each box correspond to the colors used to illustrate the corresponding mechanism in Figure 3. Combinations are ordered by their summed AIC across neurons. There are a total of 576 possible combinations, but the plot is restricted to those with the 20 lowest summed AIC.
Figure G2.
Figure G2.
Summed BIC across all neurons in the dataset for each combination of SCRI mechanisms. Filled boxes in the bottom panel indicate the mechanism is included, empty boxes that it is not. Colors for each box correspond to the colors used to illustrate the corresponding mechanism in Figure 3. Combinations are ordered by their summed BIC across neurons. There are a total of 576 possible combinations, but the plot is restricted to those with the 20 lowest summed BIC.
Figure I1.
Figure I1.
Bilinear function used to measure properties of GAM accumulator dynamics on individual simulated trials. The top panel illustrates the “badness of fit” in terms of the negative summed log-likelihood conditional on each possible choice of onset time. The measured onset time is the one with the smallest “badness of fit”.
Figure 1.
Figure 1.
Schematic depiction of the convergence of visual information in Frontal Eye Field (FEF). Signals from the Lateral Intraparietal (LIP) area and Middle Temporal (MT) area provide fast information about stimulus locations. Signals from areas V4, TE, and TEO provide slower information for color and form identification. Signals from area MT provide information for motion identification. FEF can influence processing in each area through recurrent connections (dashed arrows).
Figure 2.
Figure 2.
A) An example of a visual search array, with the receptive fields of two visually-selective neurons in Frontal Eye Fields (FEF) indicated by the dashed circles. B) Examples of the canonical response profiles for those neurons, depending on whether the object in their receptive field is a target or distractor. In phase 1, the neuron remains at its pre-array baseline spike rate. In phase 2, the neuron increases its firing rate in response to the presence of any kind of object in its receptive field (RF). In phase 3, the neuron’s spiking activity evolves such that it has a higher firing rate when a target is in its RF relative to a distractor.
Figure 3.
Figure 3.
Joint SCRI-GAM model of Frontal Eye Field (FEF) neurons. The task is visual search, with a target “T” among a field of distractors shaped like rotated “L”s. An initial transient localization signal (xi) reflects the appearance of an object within a specific receptive field (RF) in a search display, and is equivalent for targets and distractors. The localization signal excites FEF visual neurons (vi) with the same RF and sends feedforward inhibition (αx) to FEF visual neurons centered on other RF’s. FEF visual neuron activation represents the momentary degree of salience attached to the part of the visual field that falls within their RF. FEF visual neurons receive a small amount of tonic excitation (b) and their spiking activity decays in the absence of additional excitation (λv). FEF visual neurons laterally inhibit one another (βv). FEF visual neurons can act as recurrent multiplicative gates (when =1) to govern the rate at which a sustained identification signal (zi) grows toward an asymptotic value which tends to be higher for targets than distractors. These identification units are also subject to decay (λz) and laterally inhibit one another (βz). Identification units excite FEF visual neurons with the same RF and send feedforward inhibition (αz) to neurons with different RF’s. FEF visual neuron spiking activity that exceeds a threshold gate (g) excites FEF movement units mi with “movement fields” analogous to visual neurons’ RF’s. These movement units are subject to decay (λm) and laterally inhibit one another (βm). When a movement unit reaches a critical level of spiking activity (θ), a saccade is initiated to the unit’s movement field.
Figure 4.
Figure 4.
Fits of the full SCRI (including recurrence) to FEF visual neuron spiking activity, averaged over neurons. A) An example of different visual search arrays of different set sizes. B) An example of different visual search arrays with similar (hard) or dissimilar (easy) distractors relative to the target. Subsequent panels show model fits to observed FEF visual neural activity in each condition depending on whether a target or distractor is in the neuron’s receptive field (RF). SCRI was fit to unsmoothed instantaneous firing rates, but for visualization, predicted and observed spike rates were convolved with a kernel representing postsynaptic response (Thompson et al., 1996). Shaded regions depict 95% confidence intervals about the mean. C) Average spike rates over all neurons recorded under set size manipulations. D) Average spike rates over all neurons recorded under similarity manipulations.
Figure 5.
Figure 5.
SCRI mechanisms selected by AIC for each neuron. Each column represents the minimal set of mechanisms needed to account for each neuron’s spiking pattern. The presence of a bar indicates that the mechanism was included in the set. If a bar is not present, the parameter corresponding to that mechanism is fixed at zero in the AIC-preferred set. A small open square indicates a mechanism that was not applicable to that neuron, either because it represents an experimental manipulation not performed with that neuron (similarity parameters for neurons recorded under set size manipulations) or because that mechanism was not identifiable given the conditions recorded from that neuron (localization-based feedforward inhibition and spatial distributions for neurons recorded under similarity manipulations). Mechanism labels are colored corresponding to the colors depicting that mechanism in Figure 3. A dendrogram constructed by hierarchical agglomerative clustering based on the AIC-selected mechanisms for each neuron broadly divides neurons into three groups. Below are fits of the full SCRI model to representative neurons (one recorded under set size manipulations, one recorded under similarity manipulations) from each of the three groups. As in Figure 4, for visualization purposes, predicted and observed spike rates were convolved with a kernel representing postsynaptic response (Thompson et al., 1996). Shaded regions depict 95% confidence intervals about the mean.
Figure 6.
Figure 6.
Average AIC weight (wAIC) across all neurons for each combination of SCRI mechanisms. The bottom panel indicates the presence (filled) or absence (open) of each mechanism. Colors for each box correspond to those used in Figure 3. Combinations are ordered by their average AIC weight across neurons. Of all 576 possible combinations, the plot is restricted to those with the 20 highest average AIC weights.
Figure 7.
Figure 7.
Average over neurons of SCRI spiking rates on simulated trials in which no target was present in the search array. For each neuron recorded under a similarity manipulation, we used the fitted SCRI parameters to predict the neuron’s spiking dynamics on trials without a target in both the easy (low target-distractor similarity) and hard (high target-distractor similarity) conditions. Note that these simulations represent an out-of-sample prediction of SCRI, since there were no target-absent trials in the data to which SCRI was fit.
Figure 8.
Figure 8.
Pipeline from observed spiking activity through SCRI and GAM to predicted saccade behavior. The first column shows spikes observed from three FEF visual neurons when the target (blue) or distractor (red) appeared in the RF. Observed spiking activity is used to fit parameters of SCRI which describes the latent spike rates of each neuron (second column). The SCRI spike rates are used to simulate Poisson spike trains for each neuron with each RF for each condition (third column). To simulate the visual evidence available for accumulation by a particular monkey in a particular visual search trial, we sampled multiple simulated spike trains from the SCRI fits to neurons from that monkey corresponding to the RF’s and condition on that trial. Each simulated spike train was convolved with the postsynaptic response filter used in the original descriptions of these neurons (fourth column). The input to each GAM accumulator was the average of the convolved spike trains from neurons with RF’s corresponding to the accumulator’s movement field, weighted by the inverse of the expected maximum spike rate for the neuron that generated the spike train (fifth column). Response choice and time were determined when one of the GAM accumulators reached a threshold level of activity (sixth column).
Figure 9.
Figure 9.
Observed (points) and predicted (lines) cumulative distribution functions for correct saccade response times (RT). Points depict the 10%, 30%, 50%, 70% and 90% quantiles of the observed correct RT distributions for each monkey in each condition (“SS” = “Set size”). Lines represent the cumulative distribution of correct RT’s simulated by GAM using simulated FEF visual neuron activity from our model as evidence. GAM parameter settings given in Table H1.
Figure 10.
Figure 10.
Examples of simulated SCRI visual neuron input and associated GAM accumulator trajectories on fast (0.2 RT quantile), medium (0.5 RT quantile), and slow (0.8 RT quantile) trials. Simulated trials are for monkey F. Trajectories are averaged over 10 trials centered on the corresponding RT quantile. Note that the “slow” trajectories in the Hard condition illustrate a case where a distractor had initially accrued activity in its associated GAM accumulator, leading to a slow response because of the time needed for the target accumulator to accrue enough activity to overwhelm the distractor accumulator.
Figure 11.
Figure 11.
Schematic depictions of two ways in which identification-based feedforward inhibition from area V4 might be physically realized. Saccades in one of three directions (arrows in top row) result from activation in one of three columns of neurons in FEF (second row) that are innervated by neurons in V4 (third row) with receptive fields representing the three possible saccade endpoints. A simplified rendering of the circuitry of FEF is illustrated with the upper and lower layers populated by pyramidal neurons (triangles) sandwiching the middle layer populated by stellate neurons (stars). Inputs from V4 terminate in the middle layer. The three columns in FEF producing saccades in each direction receive topographically organized input from columns in V4. Neural inhibition is mediated by the vertically elongated red neurons. The left panel illustrates feedforward inhibition mediated through the pattern of extrinsic inputs from V4 to FEF, which converge in the middle layers of FEF such that V4 neurons with non-overlapping receptive fields send inhibitory signals to layer 4 of FEF. The right panel illustrates feedforward inhibition mediated through the intrinsic circuitry in FEF wherein the inhibition occurs between the middle and upper layers of FEF.
Figure 12.
Figure 12.
Illustration of flanking suppression by SCRI in a display containing a target and seven distractors. Spiking activity for distractors near the target is lower than for distractors farther from the target. Simulated activity is averaged over SCRI fits to cells recorded under set size manipulations. Set size manipulations enabled us to estimate the spatial distributions of FEF and identification-unit lateral inhibition. These forms of inhibition lead to flanking suppression.

Similar articles

Cited by

References

    1. Adeli H, Vitu F, & Zelinsky GJ (2017). A model of the superior colliculus predicts fixation locations during scene viewing and visual search. The Journal of Neuroscience, 37(6), 1453–1467. - PMC - PubMed
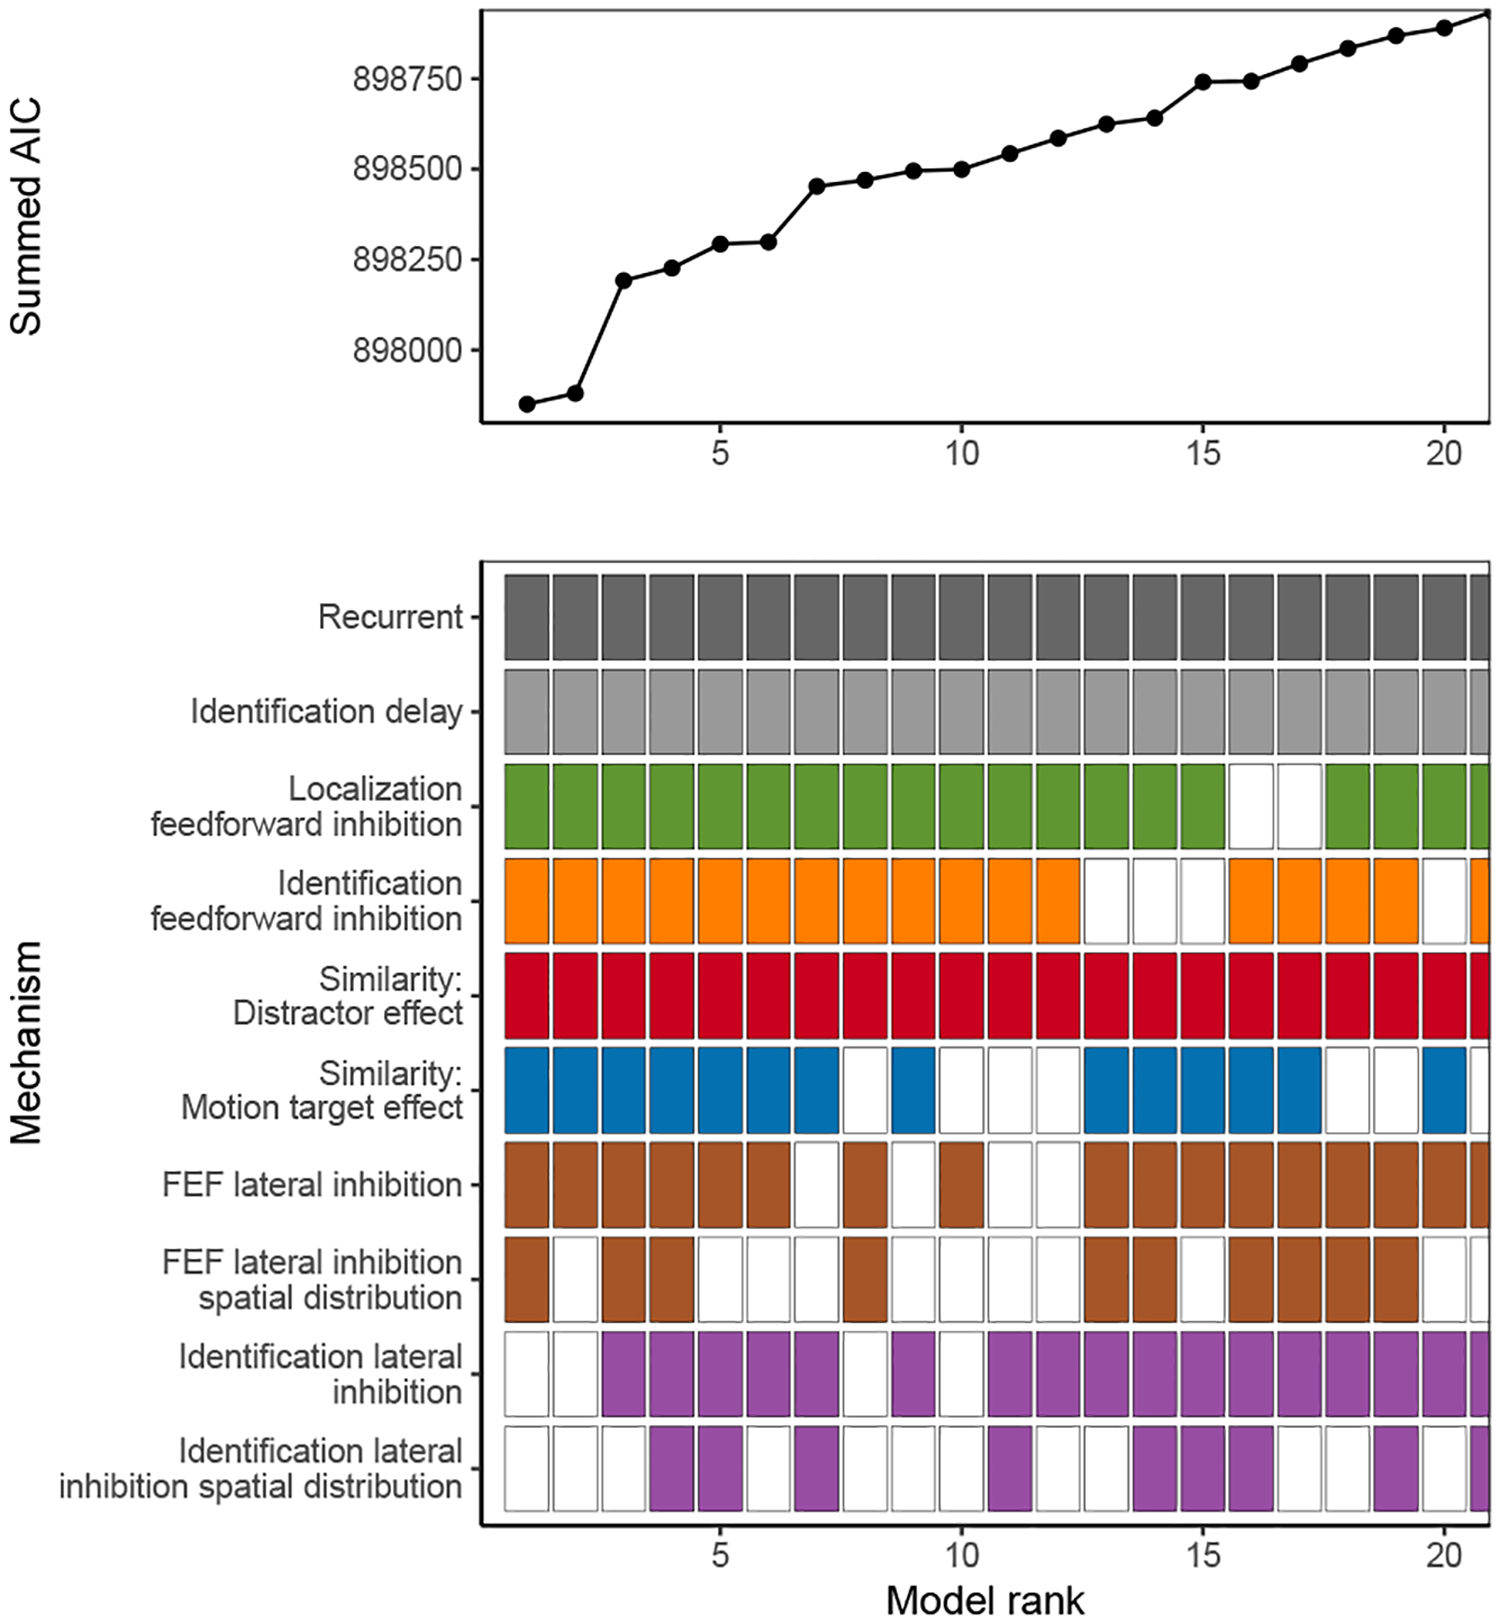
    1. Akaike H (1974). A new look at the statistical model identification. IEEE Transactions on Automatic Control, 19(6), 716–723. doi: 10.1109/TAC.1974.1100705 - DOI
    1. Anderson JC, Kennedy H, & Martin KAC (2011). Pathways of attention: Synaptic relationships of frontal eye field to V4, lateral intraparietal cortex, and area 46 in macaque monkey. The Journal of Neuroscience, 31(30), 10872–10881. - PMC - PubMed
    1. Armstrong KM, & Moore T (2007). Rapid enhancement of visual cortical response discriminability by microstimulation of the frontal eye field. Proceedings of the National Academy of Sciences, 104(22), 9499–9504. - PMC - PubMed
    1. Atkinson RC, Holmgren JE, & Juola JF (1969). Processing time as influenced by the number of elements in a visual display. Perception & Psychophysics, 6(6), 321–326. doi: 10.3758/BF03212784 - DOI

Publication types