. 2022 May 1;127(5):1417-1425.
doi: 10.1152/jn.00047.2022. Epub 2022 Apr 7.

Brain temperature affects quantitative features of hippocampal sharp wave ripples

Affiliations

Brain temperature affects quantitative features of hippocampal sharp wave ripples

Peter C Petersen et al. J Neurophysiol. .

Abstract

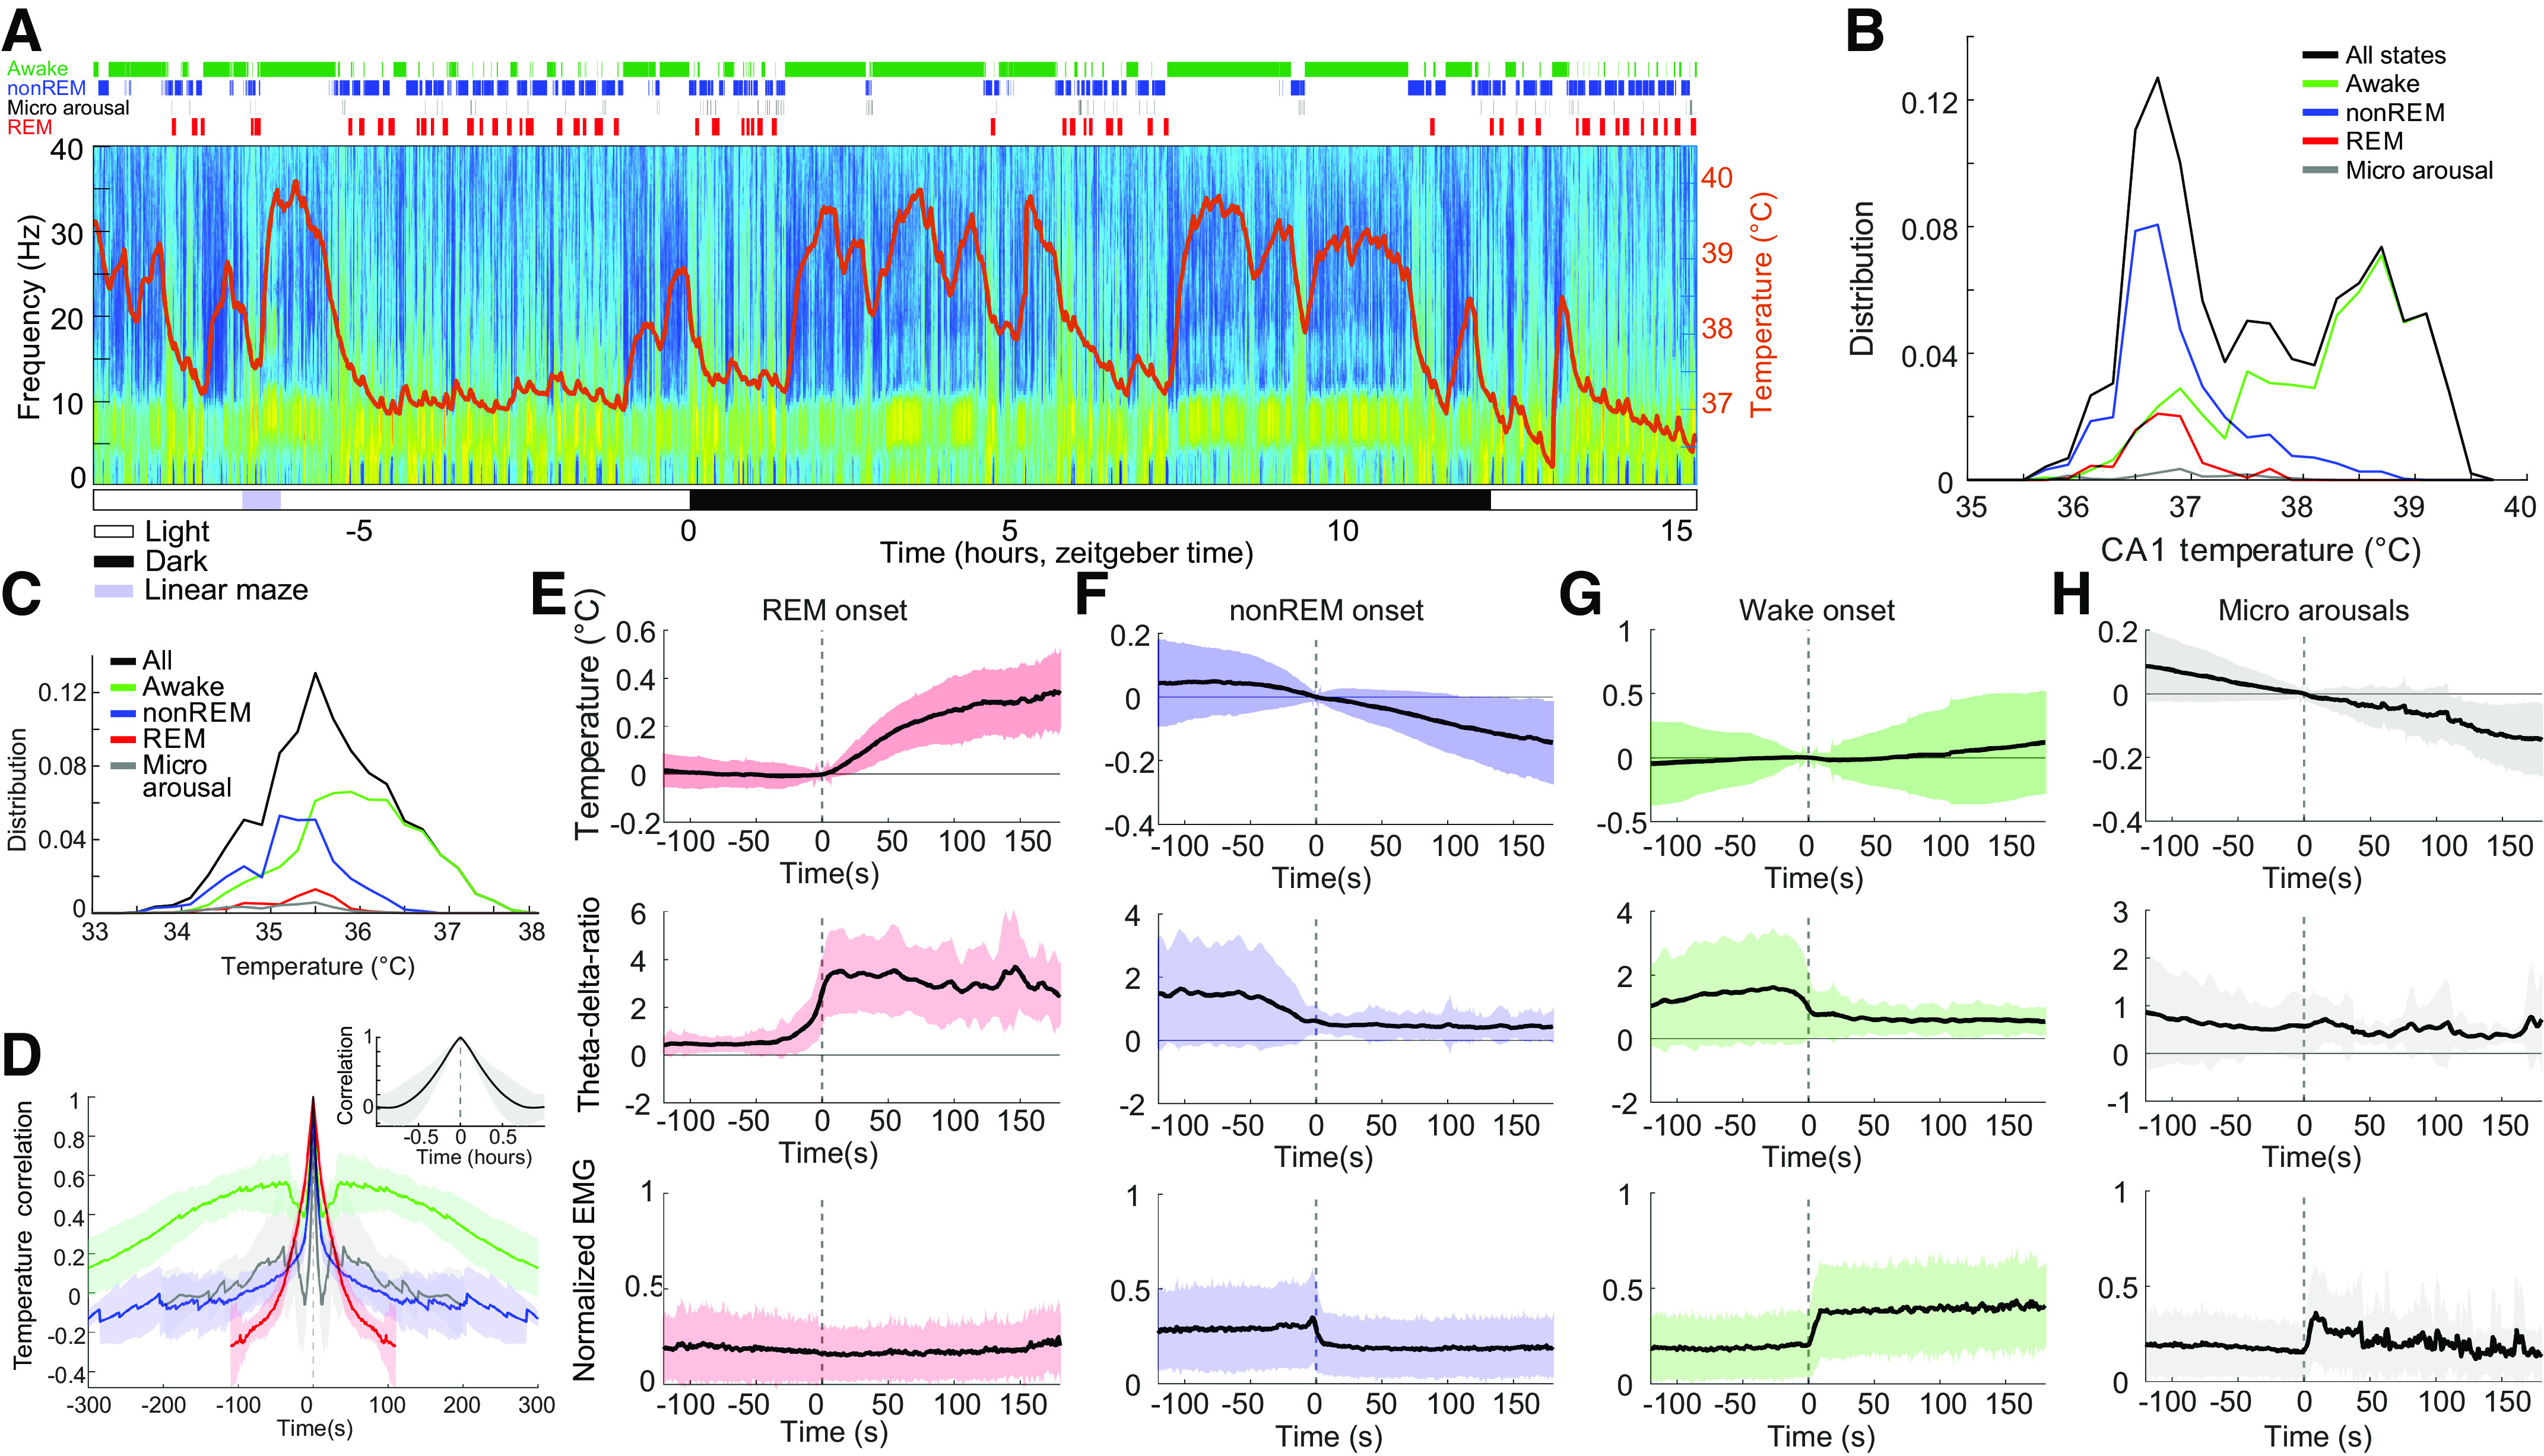
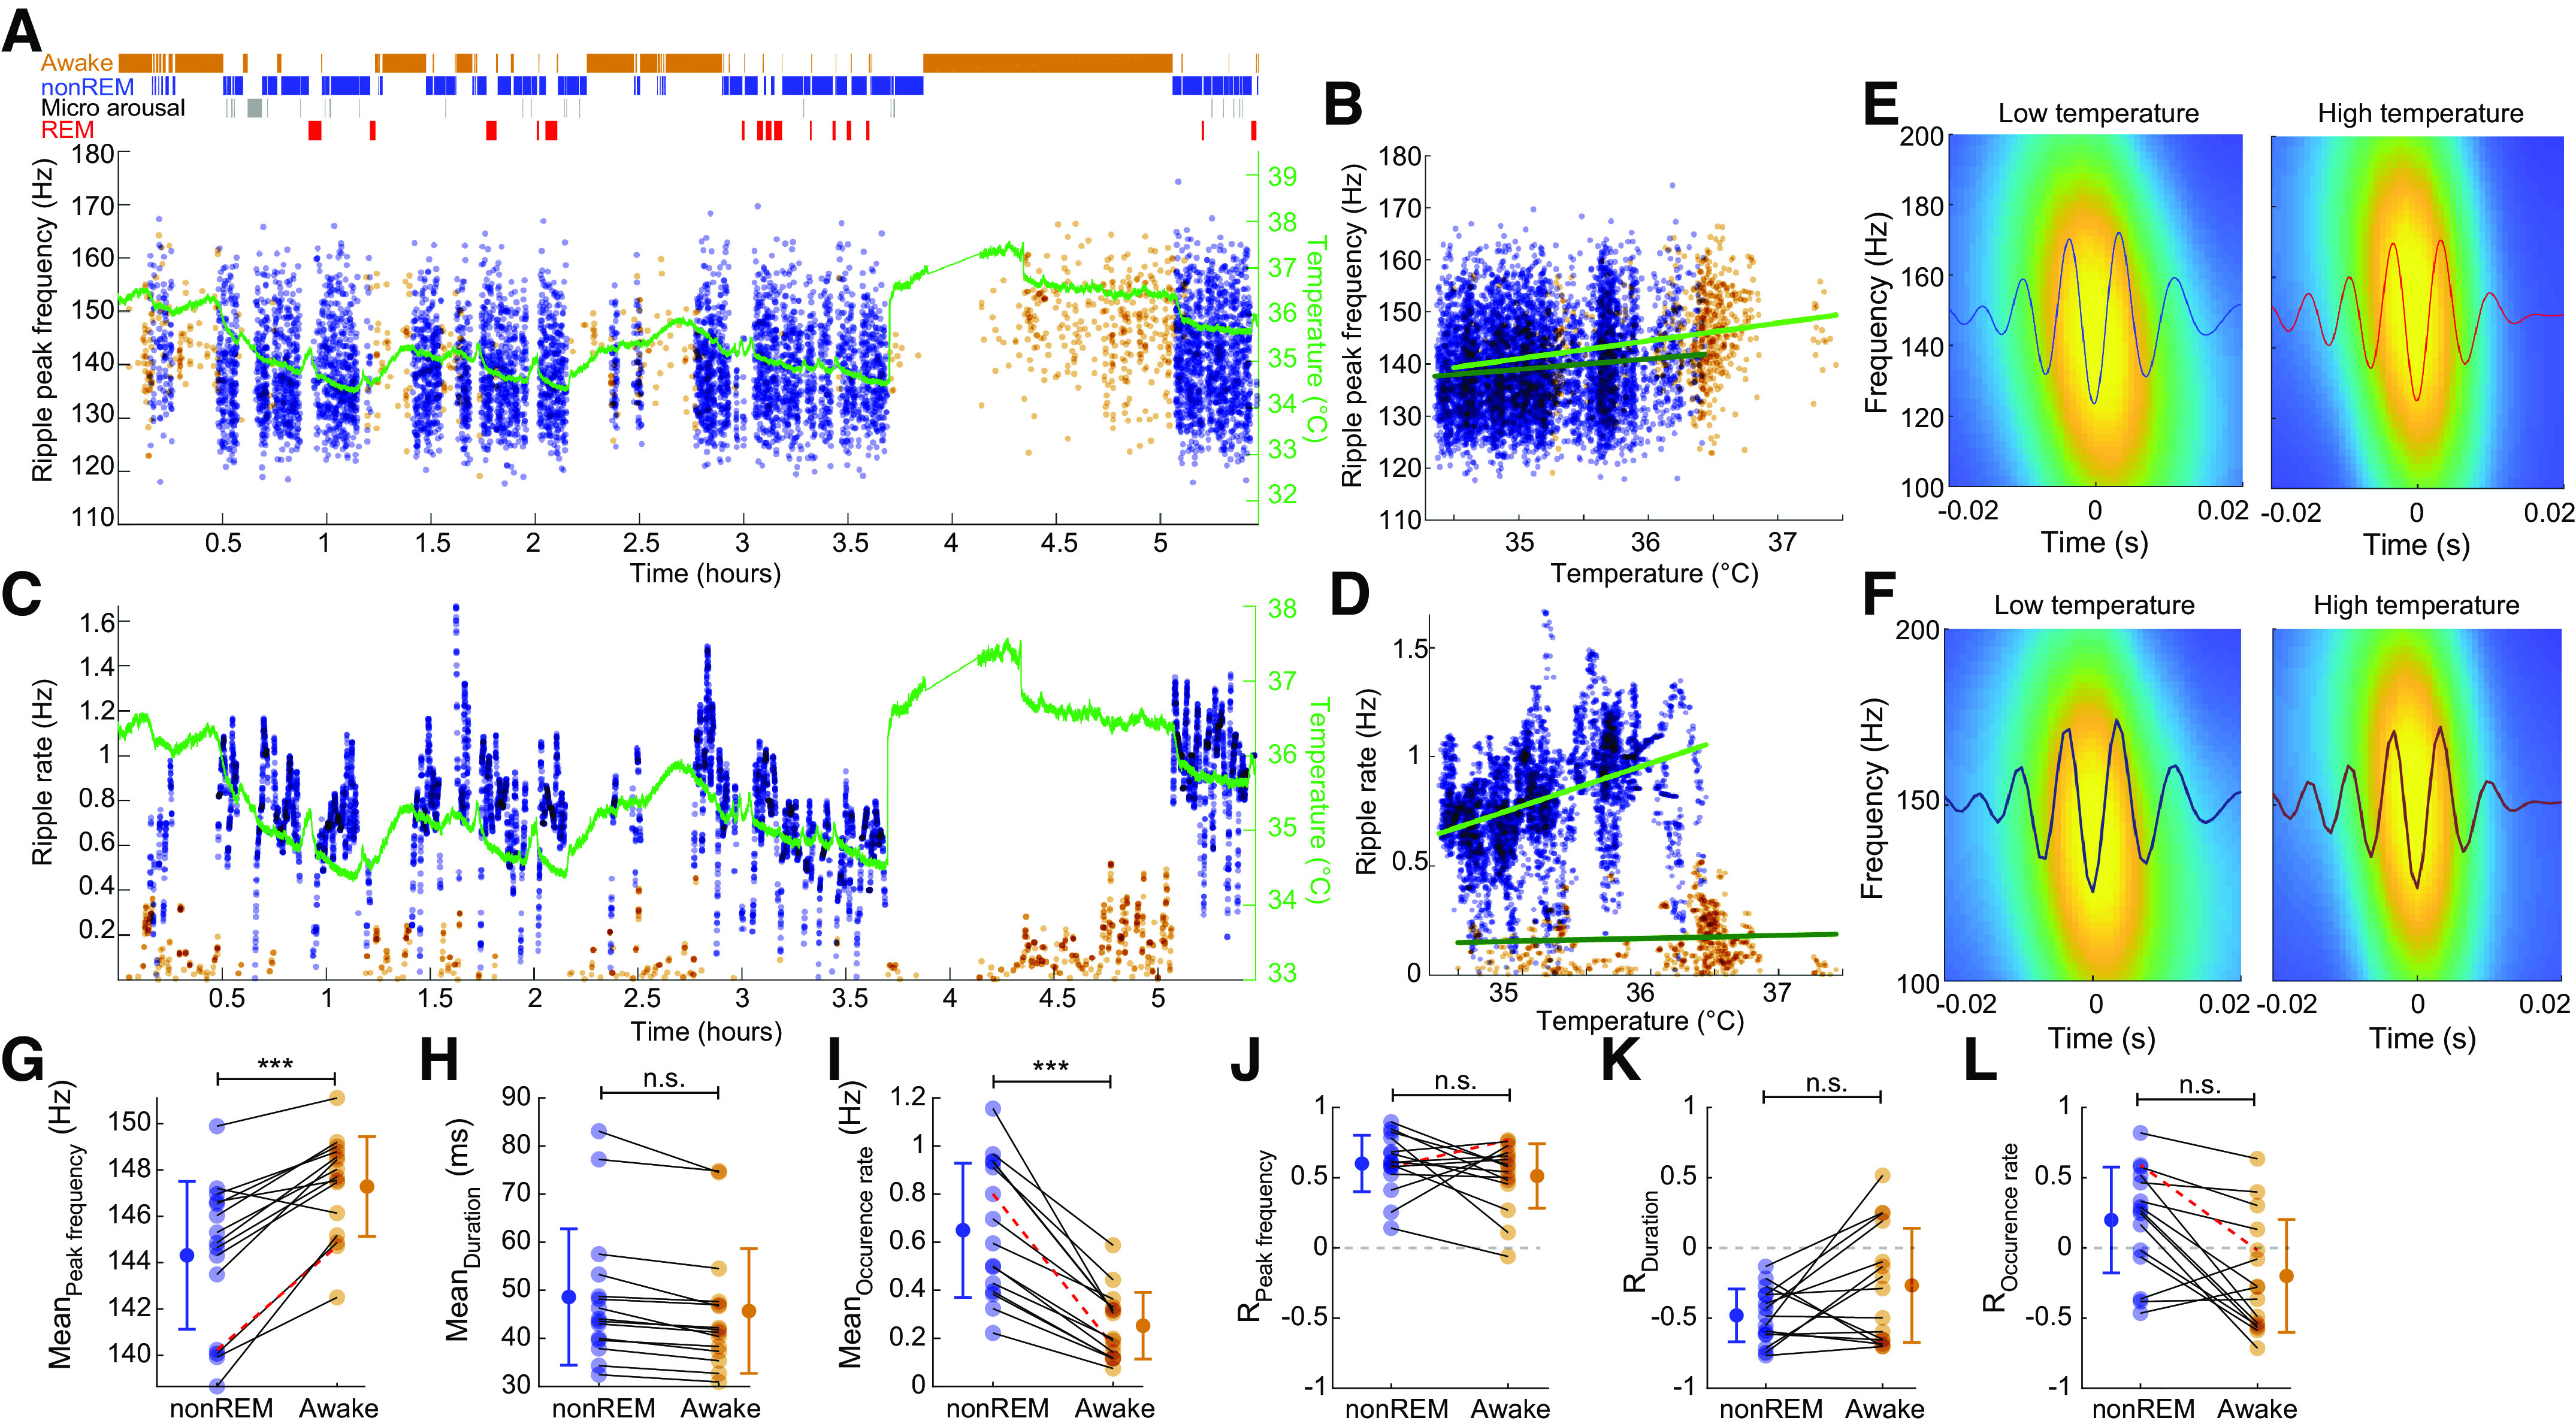
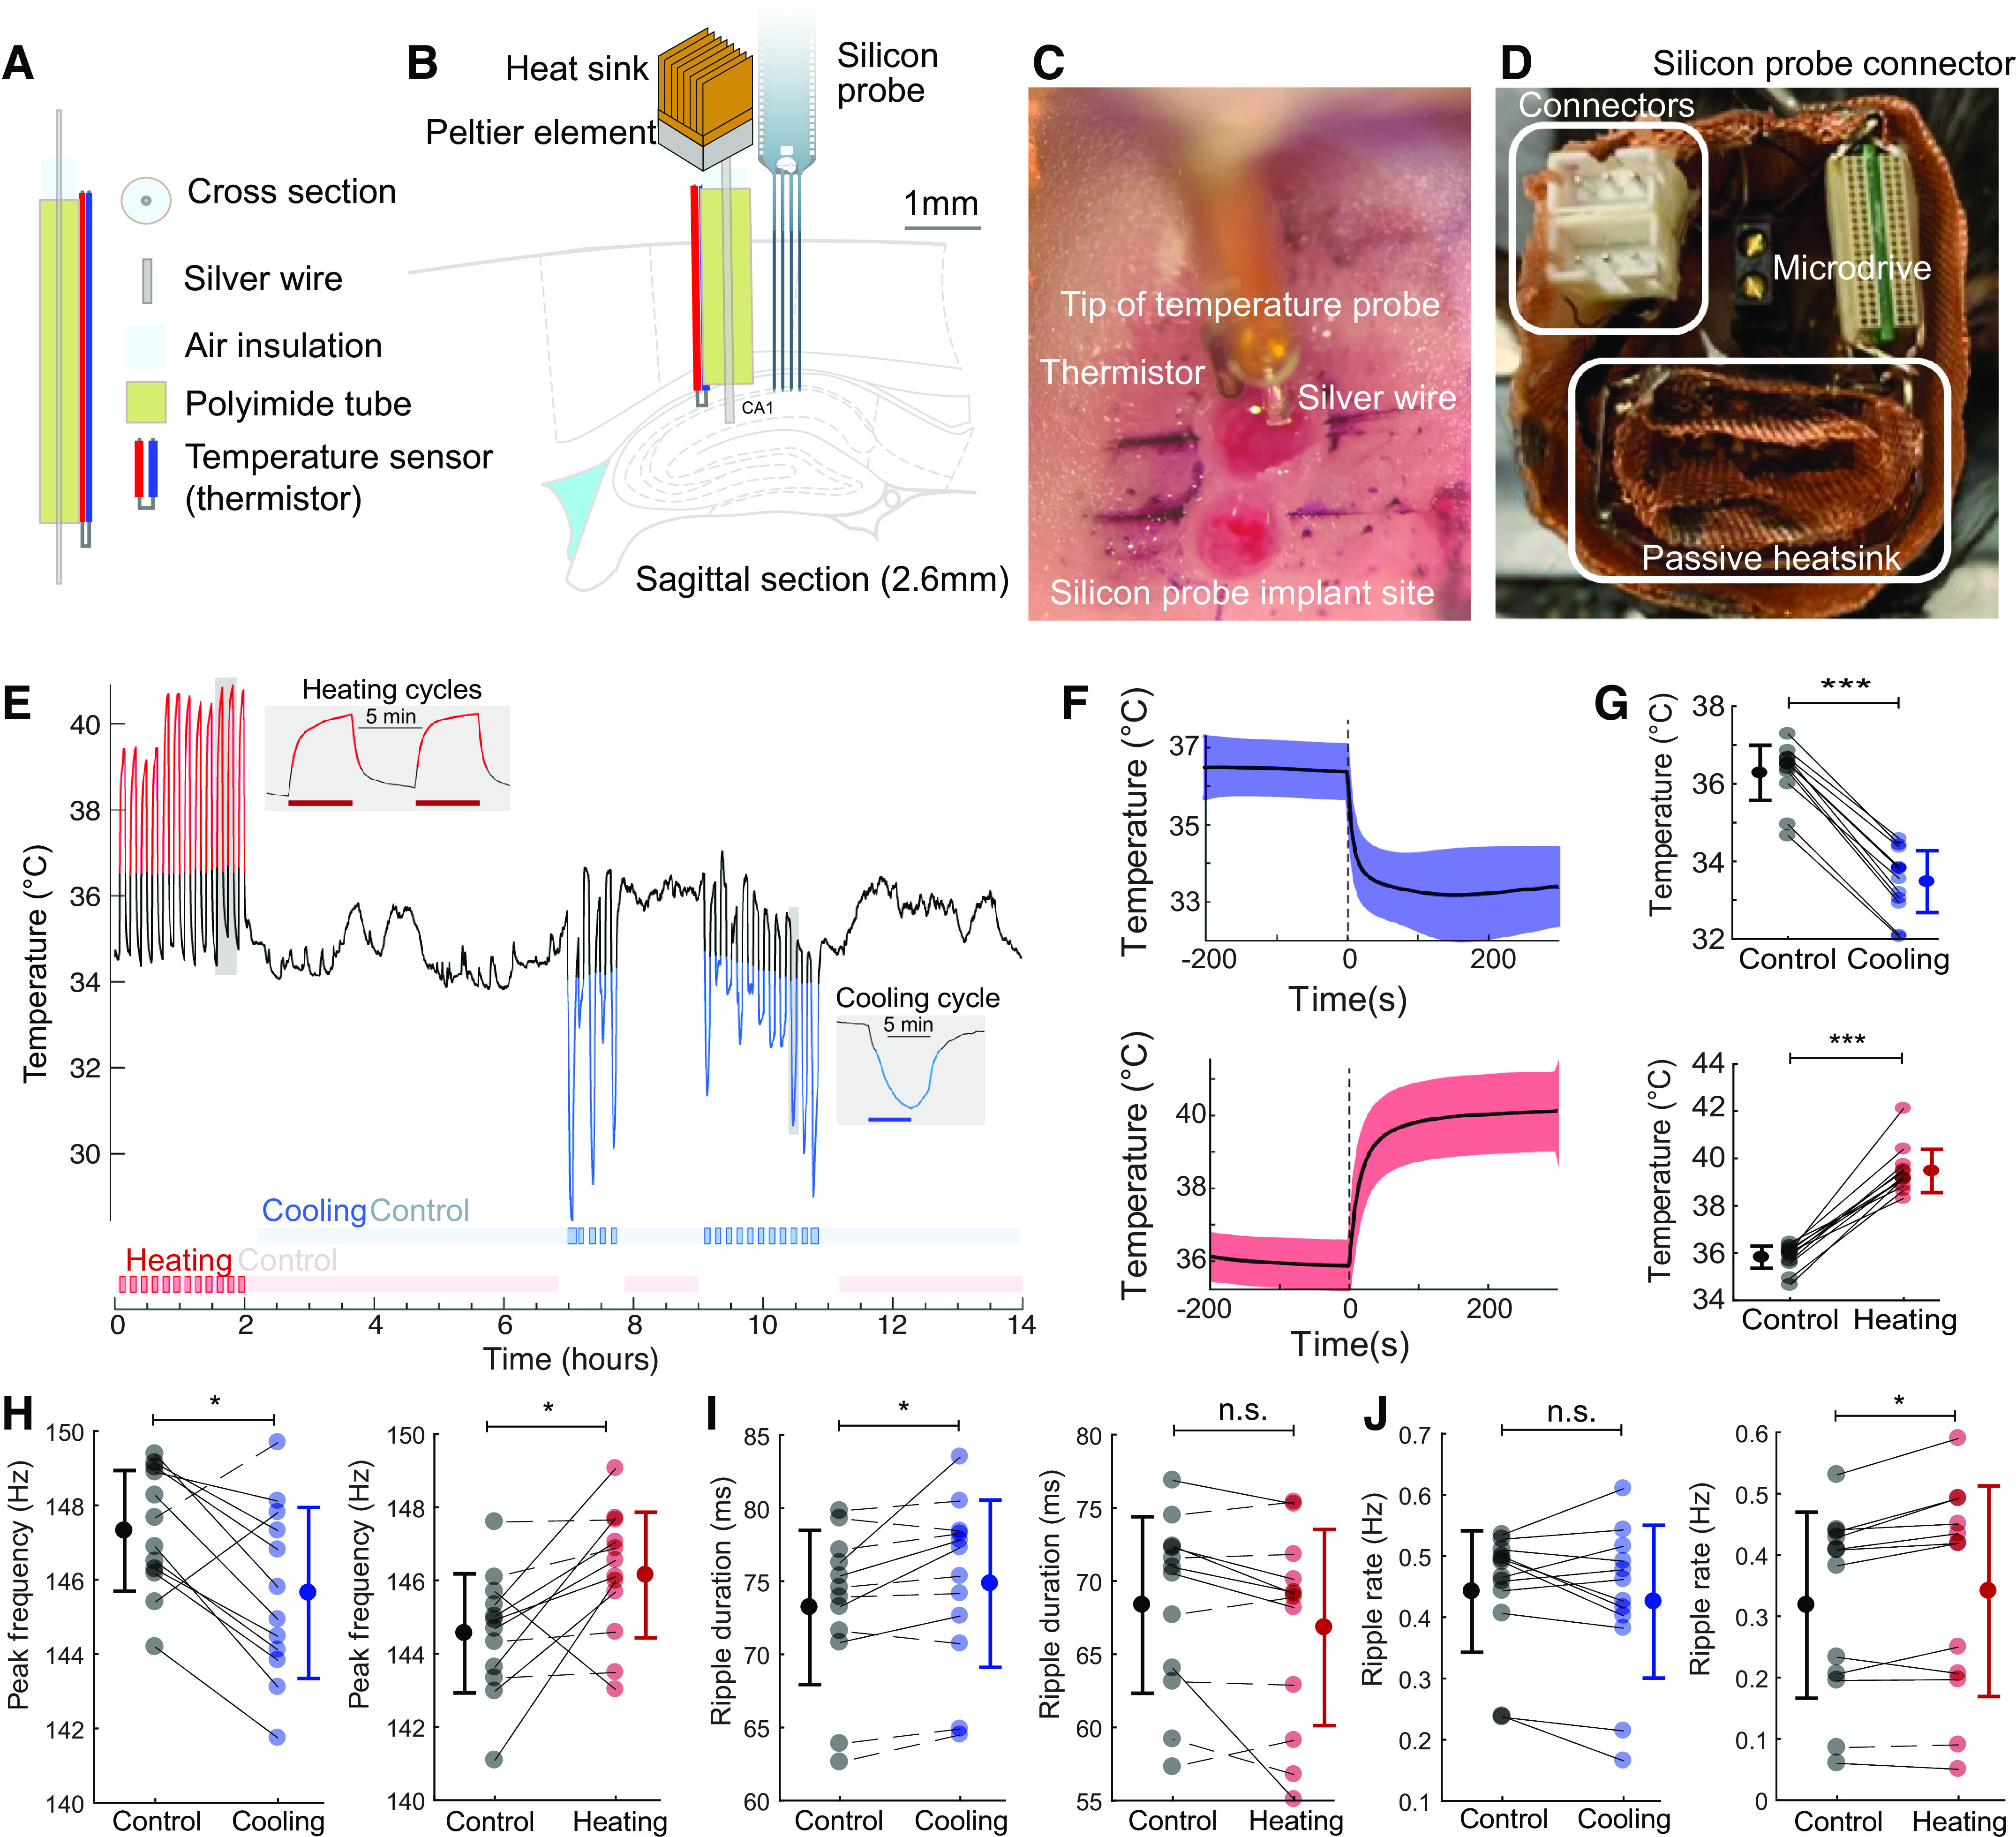
Biochemical mechanisms are temperature dependent. Brain temperature shows wide variations across brain states, and such changes may explain quantitative changes in network oscillations. Here, we report on the relationship between various hippocampal sharp wave ripple features to brain temperature. Ripple frequency, occurrence rate, and duration correlated with temperature dynamics. By focal manipulation of the brain temperature in the hippocampal CA1 region, we show that ripple frequency can be increased and decreased by local heating and cooling, respectively. Changes of other parameters, such as the rate of sharp wave-ripple complex (SPW-R) and ripple duration were not consistently affected. Our findings suggest that brain temperature in the CA1 region plays a leading role in affecting ripple frequency, whereas other parameters of SPW-Rs may be determined by mechanisms upstream from the CA1 region. These findings illustrate that physiological variations of brain temperature exert important effects on hippocampal circuit operations.NEW & NOTEWORTHY During physiological conditions, brain temperature fluctuates approximately 3°C between sleep and active waking. Here, we show that features of hippocampal ripples, including the rate of occurrence, peak frequency, and duration are correlated with brain temperature variations. Focal bidirectional manipulation of temperature in the hippocampal CA1 region in awake rodents show that ripple frequency can be altered in the direction expected from the correlational observations, implying that temperature plays a significant role.

Keywords: hippocampus; sharp wave ripples; temperature; thermal perturbation.


Conflict of interest statement

No conflicts of interest, financial or otherwise, are declared by the authors.

Figures

None
Graphical abstract
Figure 1.
Figure 1.
Hippocampal temperature varies across brain states. Twenty-four hours recording of hippocampal activity and brain temperature in a chronically implanted rat. A: time-power analysis of hippocampal local field potentials (LFPs) and brain temperature (orange line overlayed on spectrogram). Local field potential from the CA1 region of the hippocampus was used to calculate the time-resolved fast Fourier transform-based power spectrum. Brain state classification (41) is shown above the spectrum (awake, nonREM, micro arousals, and REM; green, blue, black, and red lines, respectively). Note steep temperature rise during maze running (purple rectangle, ∼2.5 h). B: brain temperature varied ∼3°C–4°C within 24 h (black), with differing distributions across brain states (awake, nonREM, micro arousals, and REM; green, blue, black, and red lines, respectively). C: distribution of brain temperatures across 18 recording sessions in 8 animals. D: 5-min wide average auto-correlograms for each brain state (same color scale as in C). REM sleep did not allow for more than −100-s:+100-s window due to their short duration. Inset: 1 h wide temperature auto-correlogram capturing the timescale of the temperature fluctuations across states. E: REM onset-triggered brain temperature changes (top), θ-δ ratio and normalized EMG (bottom). F–H: same panels as in E for nonREM onset (F), wake onset (G), and micro arousals (H). REM, rapid eye movement.
Figure 2.
Figure 2.
Hippocampal SPW-R metrics correlate with brain temperature. A: peak frequency of ripples (nonREM = blue dots; waking = brown dots) and brain temperature (green line) across time. B: correlation between temperature fluctuation and peak frequency of ripples during nonREM and waking (RnonREM = 0.60, P < 0.001, slope = 2.01 Hz/°C; Rwake = 0.77, P < 0.001, slope = 3.41 Hz/°C; from 1 session). C: rate of SPW-Rs and brain temperature across time (ripple rate is calculated in 30-s intervals within brain states). Temperature line is superimposed to facilitate comparison (as in A). Note parallel change of SPW-R rate with temperature. Also note small but reliable temperature increase during REM episodes. D: correlation between temperature fluctuation and the rate of SPW-R occurrence during nonREM and waking (RnonREM = 0.41, P < 0.001, slope = 0.20 Hz/°C; Rawake = 0.06, n.s., slope = 0.01 Hz/°C). E: average ripple waveforms and wavelet maps for low (200 ripples) and high (200 ripples) temperature epochs from the session shown A–D, n = 6673 ripples in session. F: average ripple waveforms and wavelet maps for low (200 ripples) and high (200 ripples) temperature epochs for all sessions. G–I: peak ripple frequency, mean duration, and mean rate of SPW-R occurrence during nonREM and waking. Pairs of recordings from the same session are connected. J–L: correlation values between brain temperature and peak ripple frequency, duration, and occurrence rate of SPW-R during nonREM and waking. Red highlighting lines in G, I, J, and L are values from the session shown in A–E. REM, rapid eye movement; SPW-R, sharp wave-ripple complex. ***P < 0.001; n.s., not significant.
Figure 3.
Figure 3.
The brain temperature is the best predictor of ripple frequency. A: leave-one-out prediction of ripple frequency dynamics. Root mean squared error (RMSE) difference for each held-out predictor. The held-out predictor is labeled along the x-axis. B: same analysis as in A but using only one predictor at the time, showing the lowest error when predicting the ripple frequency via brain temperature (ANOVA paired test P < 0.005 for all pairs). Predictors: Brain temperature, power-spectrum-slope, brain states (awake, nonREM, or REM), ripple rate, θ-δ ratio. REM, rapid eye movement.
Figure 4.
Figure 4.
Local temperature manipulation affects ripple frequency. A and B: cooling probe and silicon probe or tungsten wires were implanted in the CA1 region of the hippocampus of rats. Peltier element with heatsink is coupled to the silver wire and the hippocampus is cooled by thermal conduction. C: intraoperative photograph showing the implanted cooling device (top) and the location of the probe implantation (bottom). Black marker lines are approximately 1 mm apart. D: additional copper mesh heatsink is attached to the peltier element and placed inside the on-head Faraday cage. Custom connectors (for peltier probe and thermistor) are highlighted on the left. Omnetics connector of the silicon probe and microdrive in black are also shown. E: CA1 temperature during local temperature manipulation. Cooling intervals are shown by a blue line, and heating intervals by red line. Manipulation intervals were defined using the graphical interface StateExplorer (Supplemental Fig. S1). Red/blue horizontal bars in insets are the true 5 min heating/cooling intervals applied with the peltier device. F: time course of local temperature change during cooling and heating. G: temperature changes during individual cooling and heating sessions (cooling: P = 0.0005, Wilcoxon signed rank test, n = 12 sessions in 3 rats and heating: P = 0.0005, Wilcoxon signed rank test, n = 12 sessions in 4 rats). H: peak frequency of ripples during cooling (left; Δfreq = −1.7 Hz, P = 0.034) and heating sessions (right; Δfreq = 1.5 Hz, P = 0.012). Solid lines represent sessions with significant within-session modulation (P < 0.01, Kolmogorov–Smirnov test), and dashed lines represent sessions with nonsignificant modulation (P > 0.05, Kolmogorov–Smirnov test). I: ripple duration (cooling: Δduration = 1.6 ms, P = 0.016; heating: Δduration = −1.6 ms, P = 0.077). J: rate of ripple occurrence (cooling: Δrate = −0.012 Hz, P = 0.30; heating: Δ rate = 0.02 Hz, P = 0.027; same sessions shown in GJ; Wilcoxon signed rank test applied in all stats). *P < 0.05, ***P < 0.001; n.s., not significant.

References

    1. Maguire EA, Hassabis D. Role of the hippocampus in imagination and future thinking. Proc Natl Acad Sci USA 108: E39–E39, 2011. doi:10.1073/pnas.1018876108. - DOI - PMC - PubMed
    1. Schacter DL, Addis DR, Buckner RL. Remembering the past to imagine the future: the prospective brain. Nat Rev Neurosci 8: 657–661, 2007. doi:10.1038/nrn2213. - DOI - PubMed
    1. Vanderwolf CH. Hippocampal electrical activity and voluntary movement in the rat. Electroencephalogr Clin Neurophysiol 26: 407–418, 1969. doi:10.1016/0013-4694(69)90092-3. - DOI - PubMed
    1. Buzsáki G, Horváth Z, Urioste R, Hetke J, Wise K. High-frequency network oscillation in the hippocampus. Science 256: 1025–1027, 1992. doi:10.1126/science.1589772. - DOI - PubMed
    1. Girardeau G, Benchenane K, Wiener SI, Buzsáki G, Zugaro MB. Selective suppression of hippocampal ripples impairs spatial memory. Nat Neurosci 12: 1222–1223, 2009. doi:10.1038/nn.2384. - DOI - PubMed

Publication types

LinkOut - more resources