. 2022 Apr 8;376(6589):eabf1970.
doi: 10.1126/science.abf1970. Epub 2022 Apr 8.

Single-cell RNA-seq reveals cell type-specific molecular and genetic associations to lupus

Affiliations

Single-cell RNA-seq reveals cell type-specific molecular and genetic associations to lupus

Richard K Perez et al. Science. .

Erratum in

Abstract

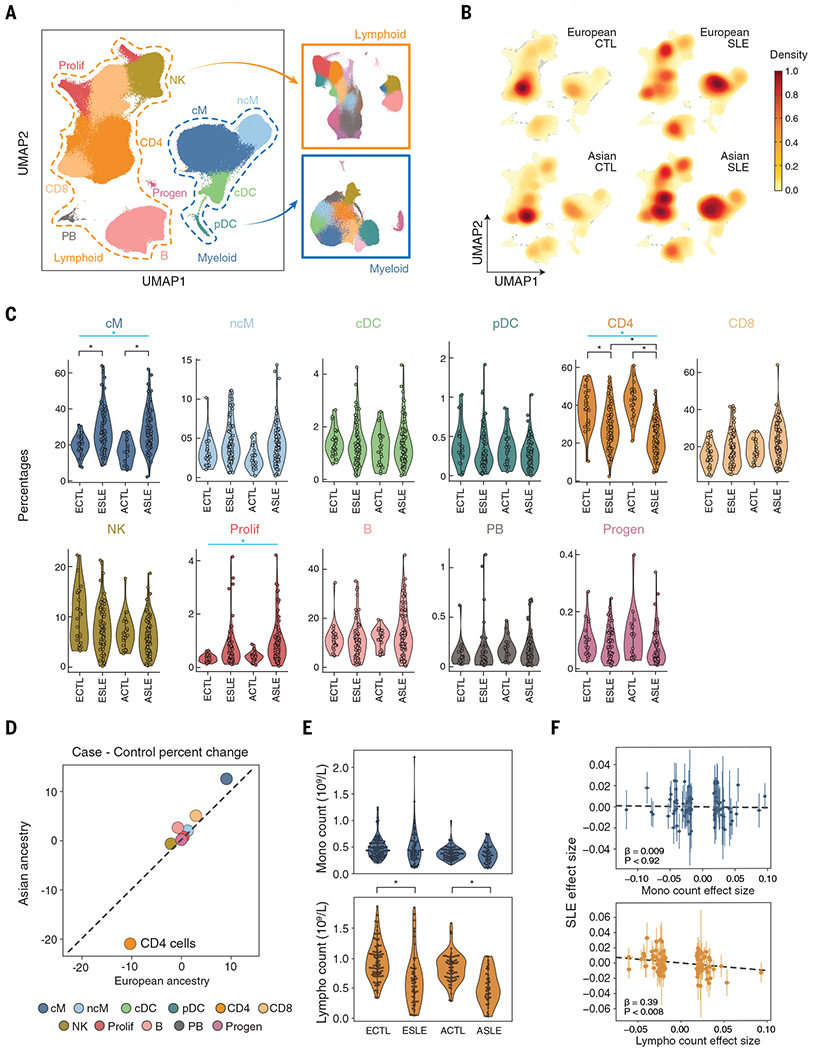
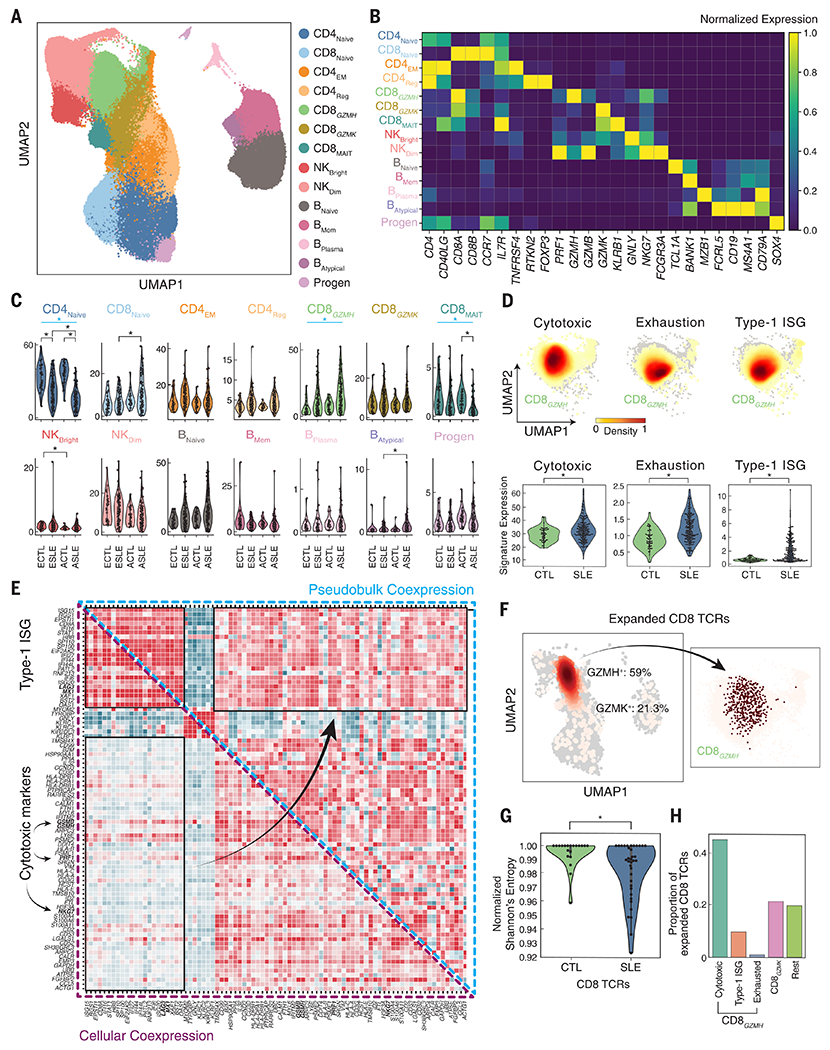
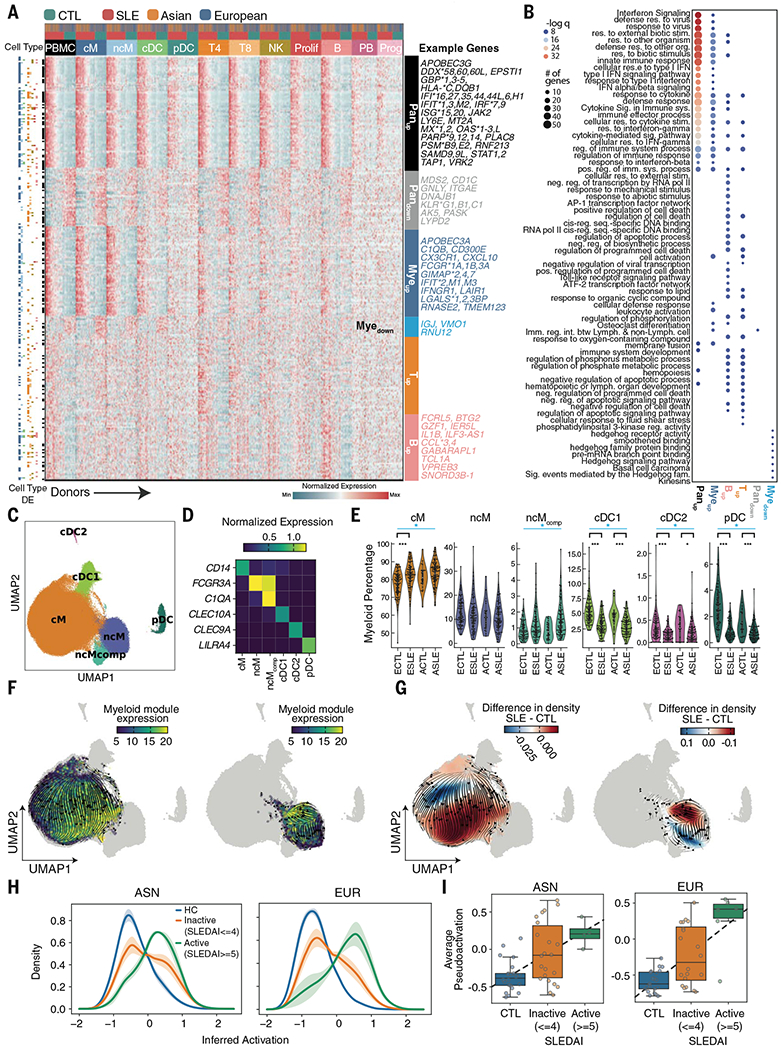
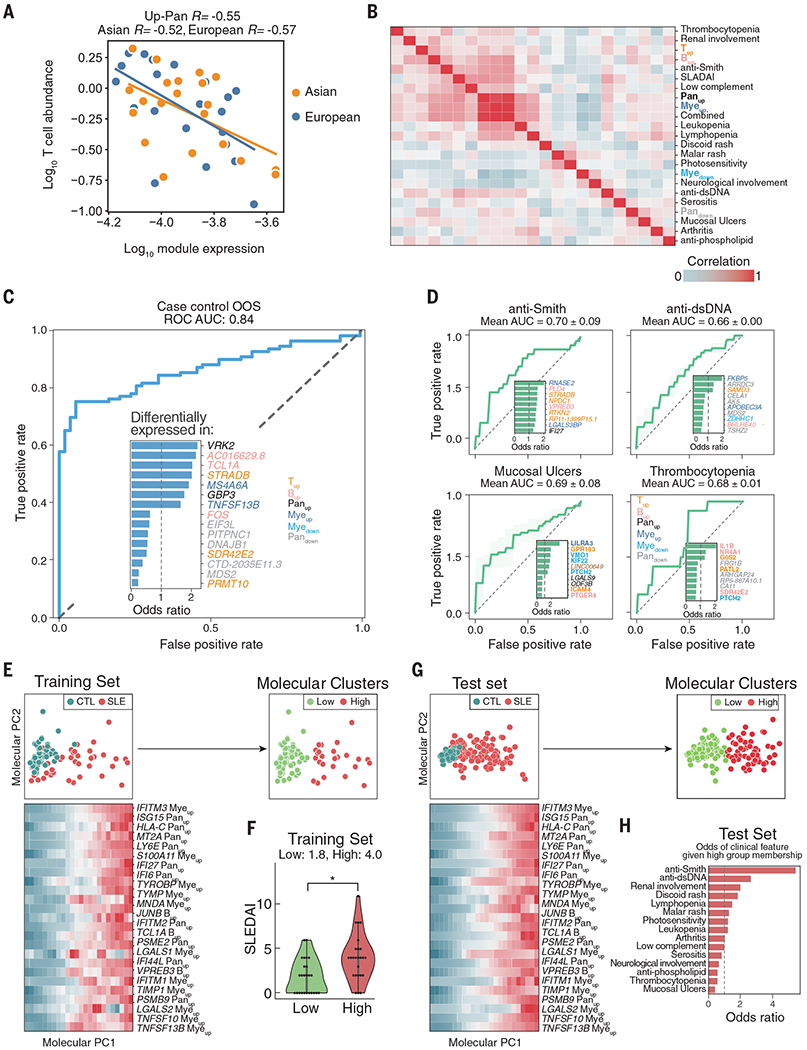
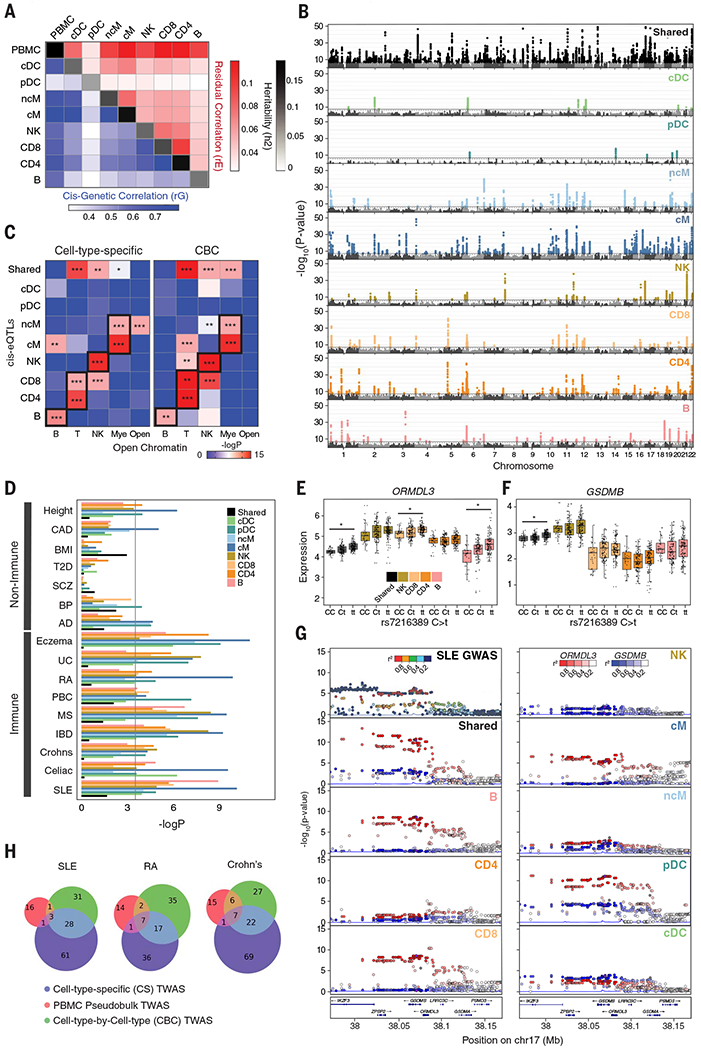
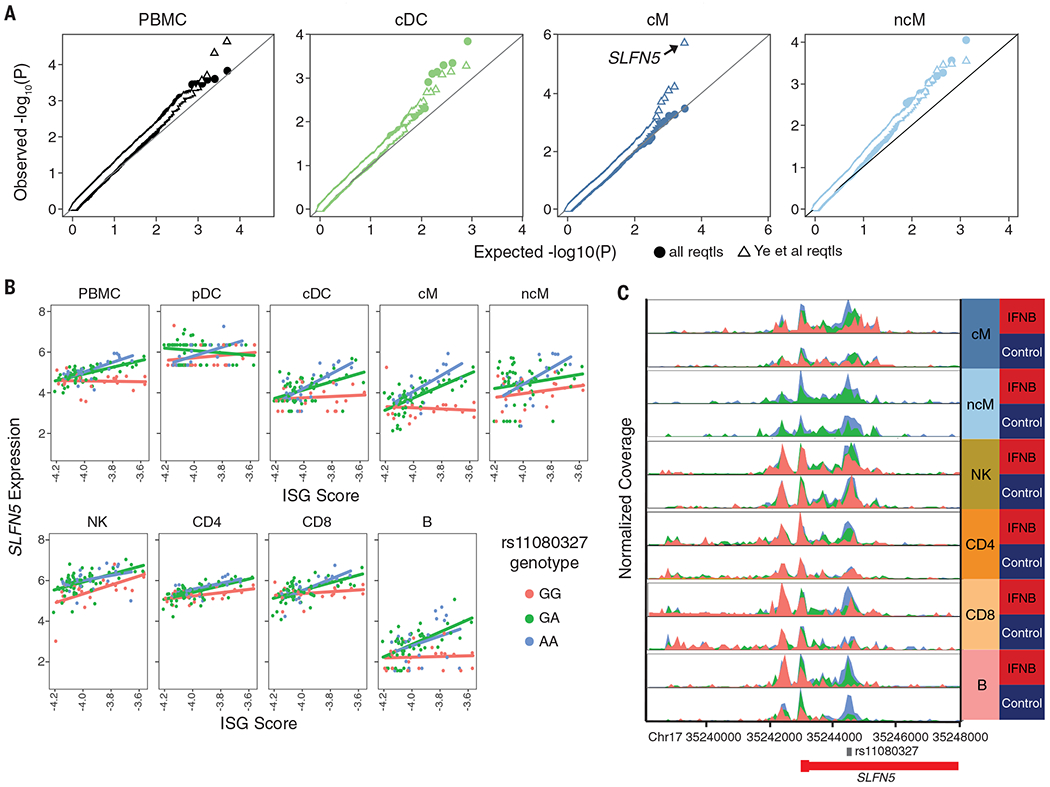
Systemic lupus erythematosus (SLE) is a heterogeneous autoimmune disease. Knowledge of circulating immune cell types and states associated with SLE remains incomplete. We profiled more than 1.2 million peripheral blood mononuclear cells (162 cases, 99 controls) with multiplexed single-cell RNA sequencing (mux-seq). Cases exhibited elevated expression of type 1 interferon-stimulated genes (ISGs) in monocytes, reduction of naïve CD4+ T cells that correlated with monocyte ISG expression, and expansion of repertoire-restricted cytotoxic GZMH+ CD8+ T cells. Cell type-specific expression features predicted case-control status and stratified patients into two molecular subtypes. We integrated dense genotyping data to map cell type-specific cis-expression quantitative trait loci and to link SLE-associated variants to cell type-specific expression. These results demonstrate mux-seq as a systematic approach to characterize cellular composition, identify transcriptional signatures, and annotate genetic variants associated with SLE.


Figures

Fig. 1.
Fig. 1.. Changes in composition of circulating immune cells in SLE.
(A) UMAP and assignment of 1.2 million cells to 11 cell types: classical and nonclassical monocytes (cM and ncM); conventional and plasmacytoid dendritic cells (cDC and pDC); CD4+ and CD8+ T cells (CD4 and CD8); natural killer cells (NK); B cells (B); plasmablasts (PB); proliferating lymphocytes (Prolif); CD34+ progenitors (Progen). Subclustering of lymphoid (orange box) and myeloid (blue box) cell populations. (B) Cell density plots of cases and controls separated by ancestry. (C) Percentage (y axis) versus case-control status (x axis) for each cell type separated by ancestry. Cell types with significant percentage changes between cases and controls are highlighted. *Padjusted < 0.05 [weighted least squares (WLS)]; blue bar indicates significant meta-analysis by Fisher’s method. (D) Correlation in percentage change versus controls between European (x axis) and Asian (y axis) cases. Colors are the same as in (C). (E) Monocyte (top) and lymphocyte (bottom) abundances (y axes) versus case-control status (x axis) from the UCSF EHR. Significant differences between cases and controls are highlighted. *Padjusted < 0.05 (OLS). (F) Scatterplot of effect sizes on SLE status (y axis) versus effect sizes on monocyte (top) or lymphocyte (bottom) abundance (x axes) for genetic variants associated with both traits reported (4, 17). ECTL, European control; ESLE, European case; ACTL, Asian control; ASLE, Asian case.
Fig. 2.
Fig. 2.. Reduction of naïve CD4+ and expansion of cytotoxic CD8+ T cells in SLE.
(A) UMAP of lymphoid cells reclustered into 14 subpopulations: naïve, effector memory, and regulatory CD4+ T cells (CD4Naïve, CD4EM, CD4Reg); naïve, GZMH+ cytotoxic, GZMK+ cytotoxic, and mucosal-associated invariant CD8+ T cells (CD8Naïve, CD8GZMH, CD8GZMK, CD8MAIT); CD56bright and CD56dim natural killer cells (NKBright, NKDim); naïve, memory, plasma, and atypical B cells (BNaïve, BMem, BPlasma, BAtypical); and CD34+ progenitors (Progen). (B) Expression of marker genes (columns) used to annotate each subpopulation (rows) colored by normalized expression level. (C) Percentage (y axis) versus case-control status (x axis) for each lymphoid subpopulation separated by ancestry. Subpopulations with significant percentage changes between cases and controls are highlighted. *Padjusted < 0.05 (WLS); blue bar indicates significant meta-analysis by Fisher’s method. (D) Density plot showing average expression of cytotoxic, exhaustion, and type 1 interferon–stimulated gene (ISG) signatures in CD8GZMH cells (top) and across individuals (bottom) separated by case-control status and ancestry. *P < 0.05 (WLS). (E) Coexpression of top 300 differentially expressed genes between cases and controls in CD8GZMH cells computed across single cells (lower triangular matrix) or across donor-specific pseudobulk expression profiles (upper triangular matrix). (F) All (light pink) and expanded (red) TCR sequences detected shown on UMAP of all cells (left) and GZMH+ cells (right). (G) Normalized Shannon’s entropies of CD8+ TCR repertoire diversity (y axis) in cases and controls (x axis). *P < 0.05 (WLS). (H) Percentage of expanded CD8+ TCRs identified as GZMH+ cells expressing cytotoxic, ISG, and exhaustion signatures, GZMK+ cells (GZMK), and all other cells (Rest). ECTL, European control; ESLE, European case; ACTL, Asian control; ASLE, Asian case.
Fig. 3.
Fig. 3.. Type 1 interferon–stimulated gene expression of myeloid cells in SLE.
(A) Heatmap of pseudobulk gene expression profiles of 302 differentially expressed genes detected in at least one of 11 cell types. For each gene, colored row bars indicate cell types in which it was differentially expressed. Colored columns indicate cell type, case-control status, and ancestry. Labeled modules were identified using hierarchical clustering. (B) Top GSEA (gene set enrichment analysis) pathway enrichment results for each module. Each dot color represents the −log(q) value; dot size represents the number of genes overlapping with the gene ontology. (C) Identification of six myeloid cell types including classical, nonclassical, and complement-expressing nonclassical monocytes (cM, ncM, ncMcomp), conventional type 1, conventional type 2, and plasmacytoid dendritic cells (cDC1, cDC2, pDC). (D) Marker genes used for annotating each cell type. (E) Percentages of myeloid cells (y axis) versus case-control status and ancestry (x axis) for each myeloid sub-population. Myeloid subpopulations with significant percentage changes between cases and controls are highlighted. *P < 0.01, ***P < 0.0001 (WLS); blue bar indicates significant meta-analysis by Fisher’s method. (F and G) RNA velocity stream plots for cM (right UMAP) and ncM and ncMcomp (left UMAP) subpopulations colored by the average expression of Myeup genes enriched for type 1 ISGs (F) and the relative density of cells from SLE cases versus healthy controls (G). (H) Distribution of the degree of inferred activation for individuals across disease activities (HC, healthy controls; inactive, SLEDAI between 0 and 4; active, SLEDAI of 5 or more). (I) Average inferred activation across cells per sample (y axis) versus disease activity (x axis) for Asian (left) and European (right) samples separately. ECTL, European control; ESLE, European case; ACTL, Asian control; ASLE, Asian case.
Fig. 4.
Fig. 4.. Prediction of disease status and molecular stratification of SLE.
(A) Correlation between log10(expression of Panup) (x axis) and log10(abundance of CD4Naïve cells) in processing batch 4 cases only. (B) Correlation matrix between average expression of each of six gene modules and clinical features. (C and D) Receiver operating curve for out-of-sample (OOS) prediction of case-control status (C) and individual clinical variables (D) using a logistic regression model trained on 302 expression features. Inset depicts the most important molecular features inferred by the model, colored by the module to which each feature belongs. (E) Principal components analysis of training set based on 302 expression features. Green, control; red, case. Heatmap shows the top 25 most correlated expression features to molecular principal component PC1. Expression was binned and averaged across 24 equal steps across molecular PC1. K-means clustering of samples based on principal components yielded two molecular subphenotypes (Low, High). (F) Distribution of SLEDAI scores (y axis) for each molecular subphenotype (x axis) in the training cases. *P < 0.05 (Wilcoxon rank-sum test). (G) Projection of OOS test set onto molecular PC1 and PC2 and colored by case-control status (left) and molecular cluster membership (right). Heatmap shows the top 25 most correlated expression features to molecular PC1 in the test set. (H) Odds ratio of having a clinical feature given membership in the High molecular cluster versus the Low molecular cluster.
Fig. 5.
Fig. 5.. Cell type–specific genetic determinants of gene expression.
(A) Cis-genetic correlation (rG; lower triangular plot), shared residual correlation (rE; upper triangular plot), and heritability (h2; diagonal) of eight cell types and PBMCs. Cis is defined 100 kb within the transcription start site. (B) Manhattan plots of shared eQTLs (sh-eQTLs; black) and cell type–specific cis-eQTLs (cs-eQTLs; colored) determined by mapping cis-eQTLs associated with shared and cell type–specific expression components from decomposition analysis. Associations are reported as −log10(P value) (y axis) ordered by chromosomes (x axis). (C) Enrichment of cs-eQTLs (left) and cell type–by–cell type eQTLs (CBC-eQTLs; right) for disjoint sets of cell type–specific regions of open chromatin. *P < 0.01, **P < 0.001, ***P < 0.0001 (Mann-Whitney test). (D) Enrichment of shared or cs-eQTLs among GWAS associations for seven non–immune-mediated (CAD, coronary artery disease; BMI, body mass index; T2D, type 2 diabetes; SCZ, schizophrenia; BP, bipolar disease; AD, Alzheimer’s disease) and nine immune-mediated diseases or traits (UC, ulcerative colitis; RA, rheumatoid arthritis; PBC, primary biliary cirrhosis; MS, multiple sclerosis; IBD, inflammatory bowel disease; SLE, systemic lupus erythematosus). The Bonferroni corrected significance threshold is shown as a black line. (E and F) Boxplots of decomposed shared and cell type–specific expression of ORMDL3 (E) and GSDMB (F) in all individuals grouped by genotype for rs7216389. *COLOC posterior probability > 0.7. (G) LocusZoom plots of SLE GWAS, sh-eQTLs, and cs-eQTLs associated with ORMDL3 (red) and GSDMB (blue) expression. (H) Number of associations identified by a modified transcriptome-wide association analysis (TWAS) using decomposed shared and cell type–specific expression matrices (blue), CBC expression matrices (green), or pseudobulk PBMCs (red).
Fig. 6.
Fig. 6.. Interferon modifies cell type–specific genetic effects on gene expression.
(A) Quantile-quantile plot of expected −log10(P value) (x axis) versus observed −log10(P value) (y axis) of cis-IFN-QTLs (solid circles). Previously identified (48) response-QTLs (reQTLs) from monocyte-derived dendritic cells are highlighted (open triangles). (B) Normalized expression of SLFN5 expression (y axis) versus ISG score (x axis) separated by rs11080327 genotype (color). Line indicates best linear regression fit for each genotype. (C) Gene locus plot of SLFN5 scATAC-seq peaks for six peripheral immune cell types in unstimulated and rIFNB1-stimulated conditions, separated by genotype. Location of rs11080327 is indicated.

Comment in

References

    1. Carter EE, Barr SG, Clarke AE, The global burden of SLE: Prevalence, health disparities and socioeconomic impact. Nat. Rev. Rheumatol 12, 605–620 (2016). doi: 10.1038/nrrheum.2016.137 - DOI - PubMed
    1. Kaul A et al. , Systemic lupus erythematosus. Nat. Rev. Dis. Primers 2, 16039 (2016). doi: 10.1038/nrdp.2016.39; - DOI - PubMed
    1. Banchereau R et al. , Personalized Immunomonitoring Uncovers Molecular Networks that Stratify Lupus Patients. Cell 165, 551–565 (2016). doi: 10.1016/j.cell.2016.03.008; - DOI - PMC - PubMed
    1. Bentham J et al. , Genetic association analyses implicate aberrant regulation of innate and adaptive immunity genes in the pathogenesis of systemic lupus erythematosus. Nat. Genet 47, 1457–1464 (2015). doi: 10.1038/ng.3434 - DOI - PMC - PubMed
    1. Banchereau J, Pascual V, Type I interferon in systemic lupus erythematosus and other autoimmune diseases. Immunity 25, 383–392 (2006). doi: 10.1016/j.immuni.2006.08.010 - DOI - PubMed

Substances