. 2022 Apr 8;376(6589):eabl5282.
doi: 10.1126/science.abl5282. Epub 2022 Apr 8.

Tuning T cell receptor sensitivity through catch bond engineering

Affiliations

Tuning T cell receptor sensitivity through catch bond engineering

Xiang Zhao et al. Science. .

Abstract

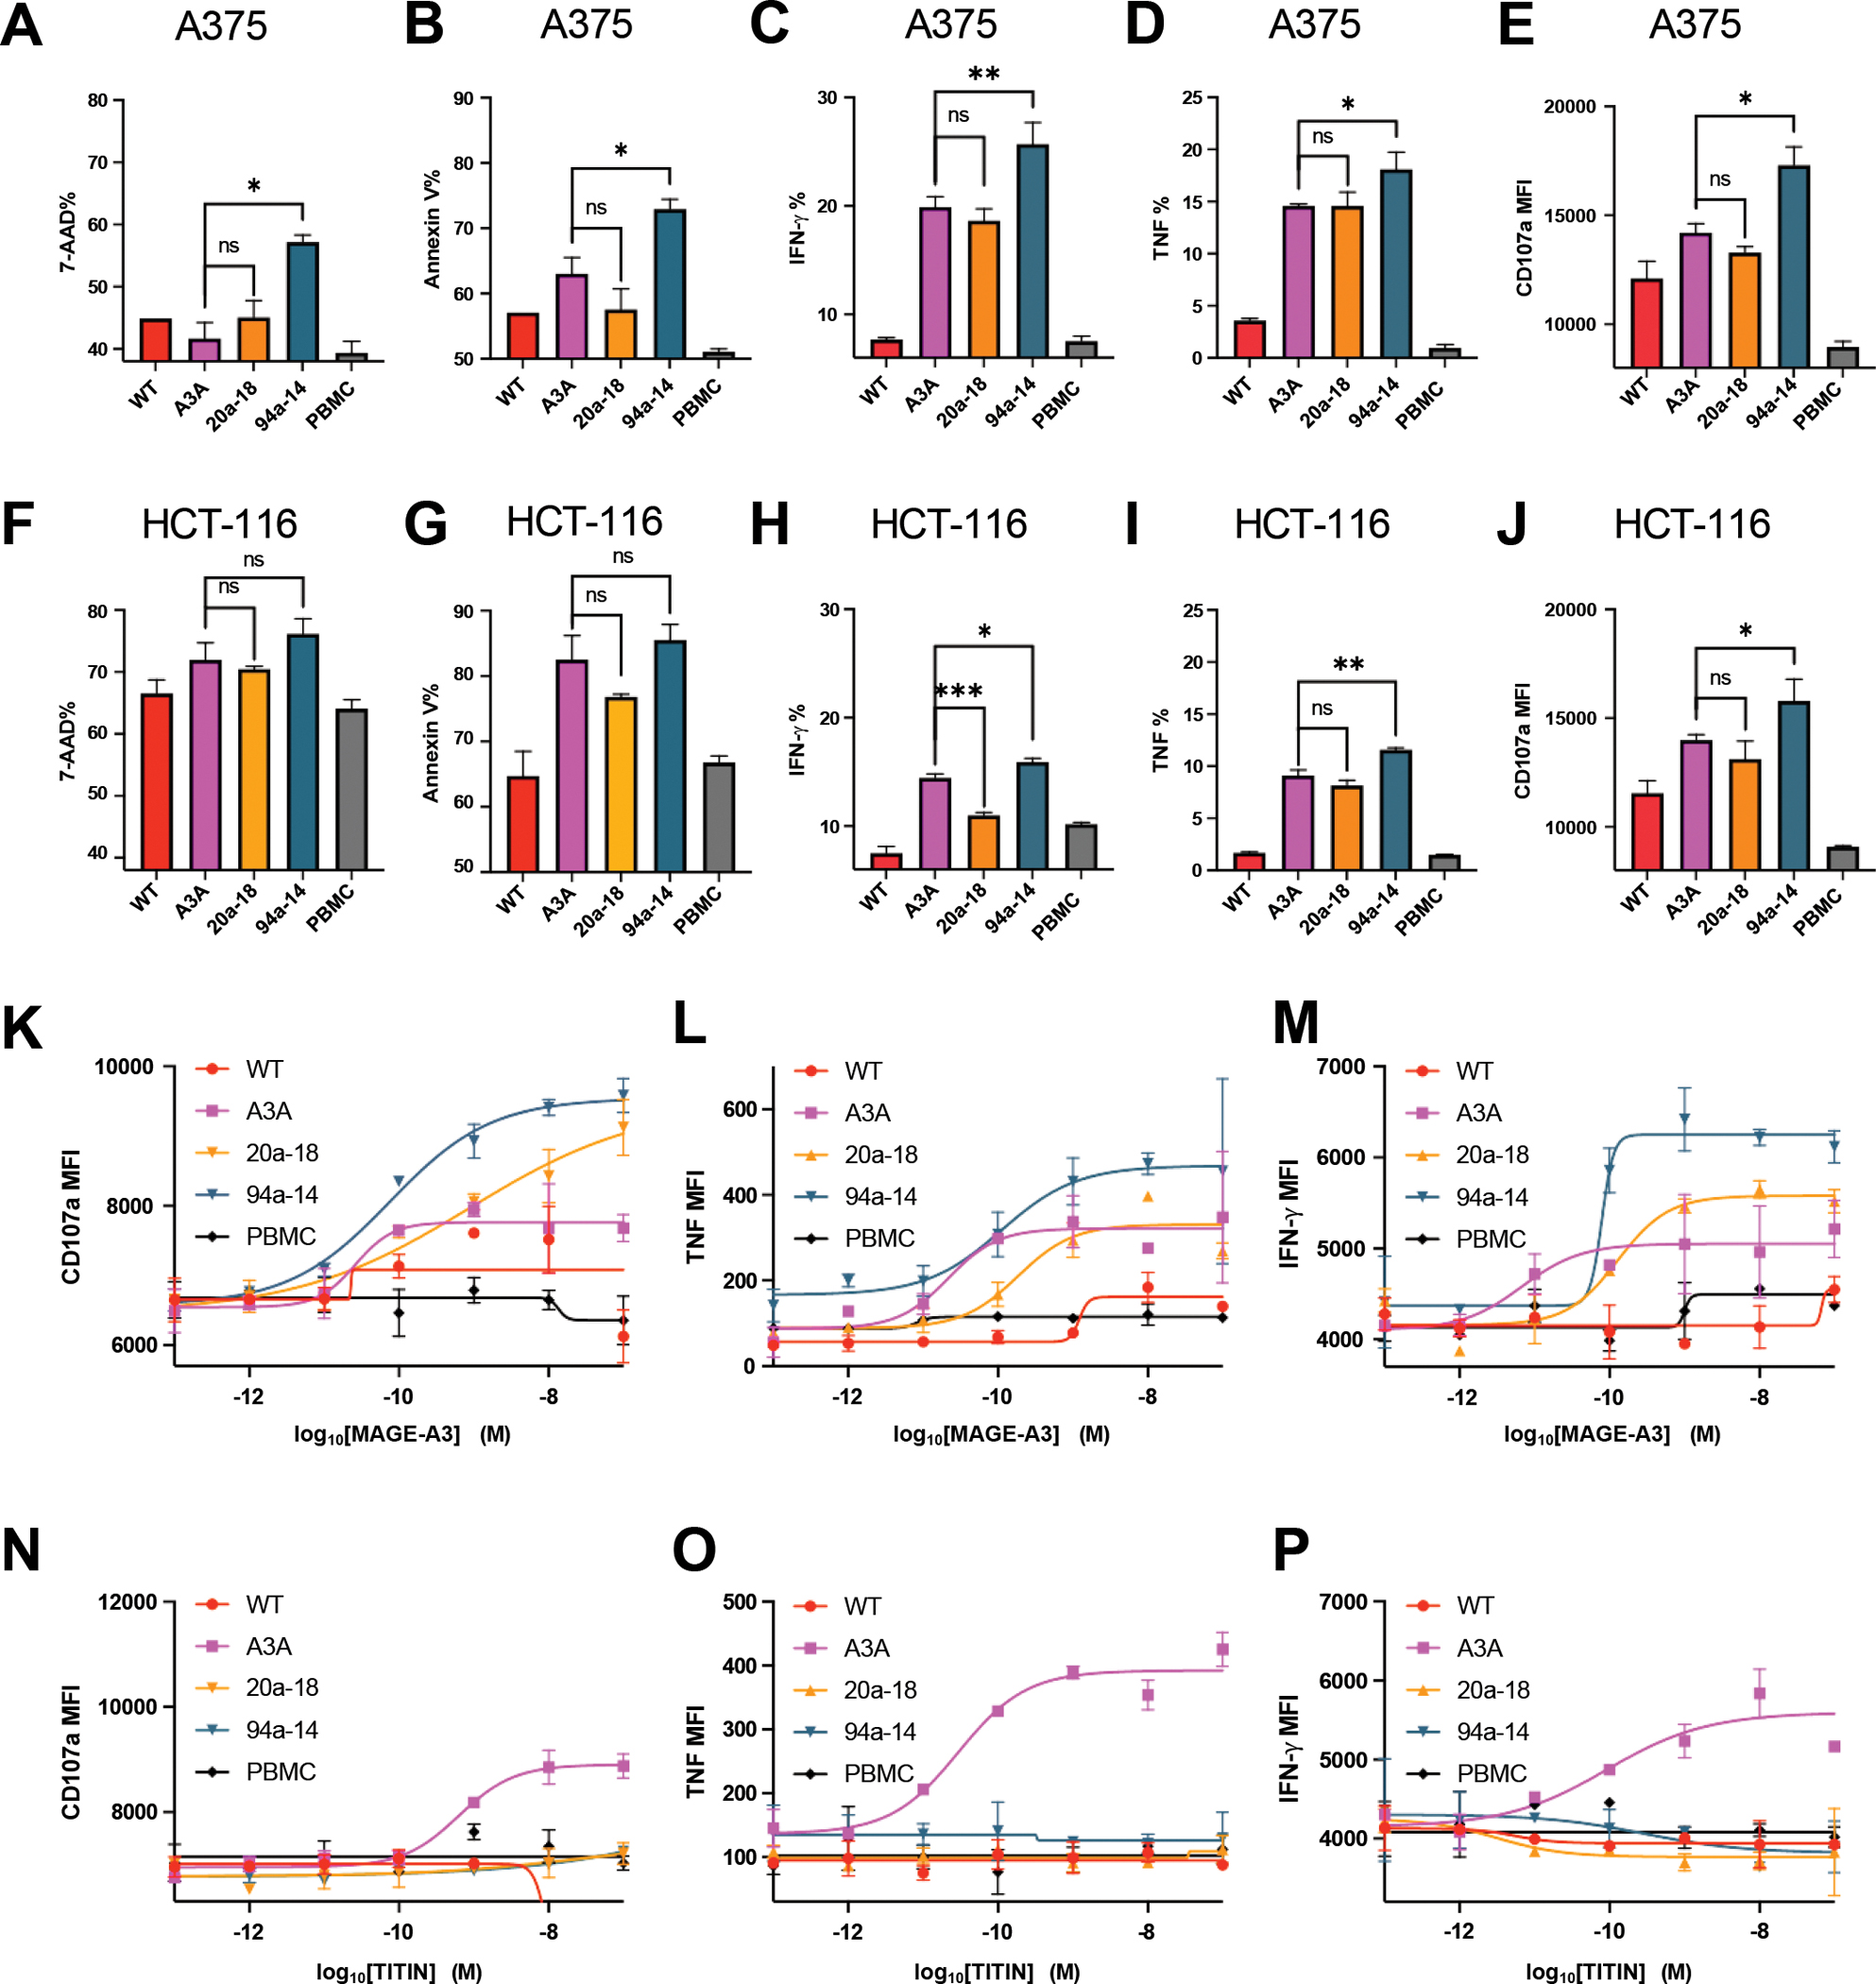
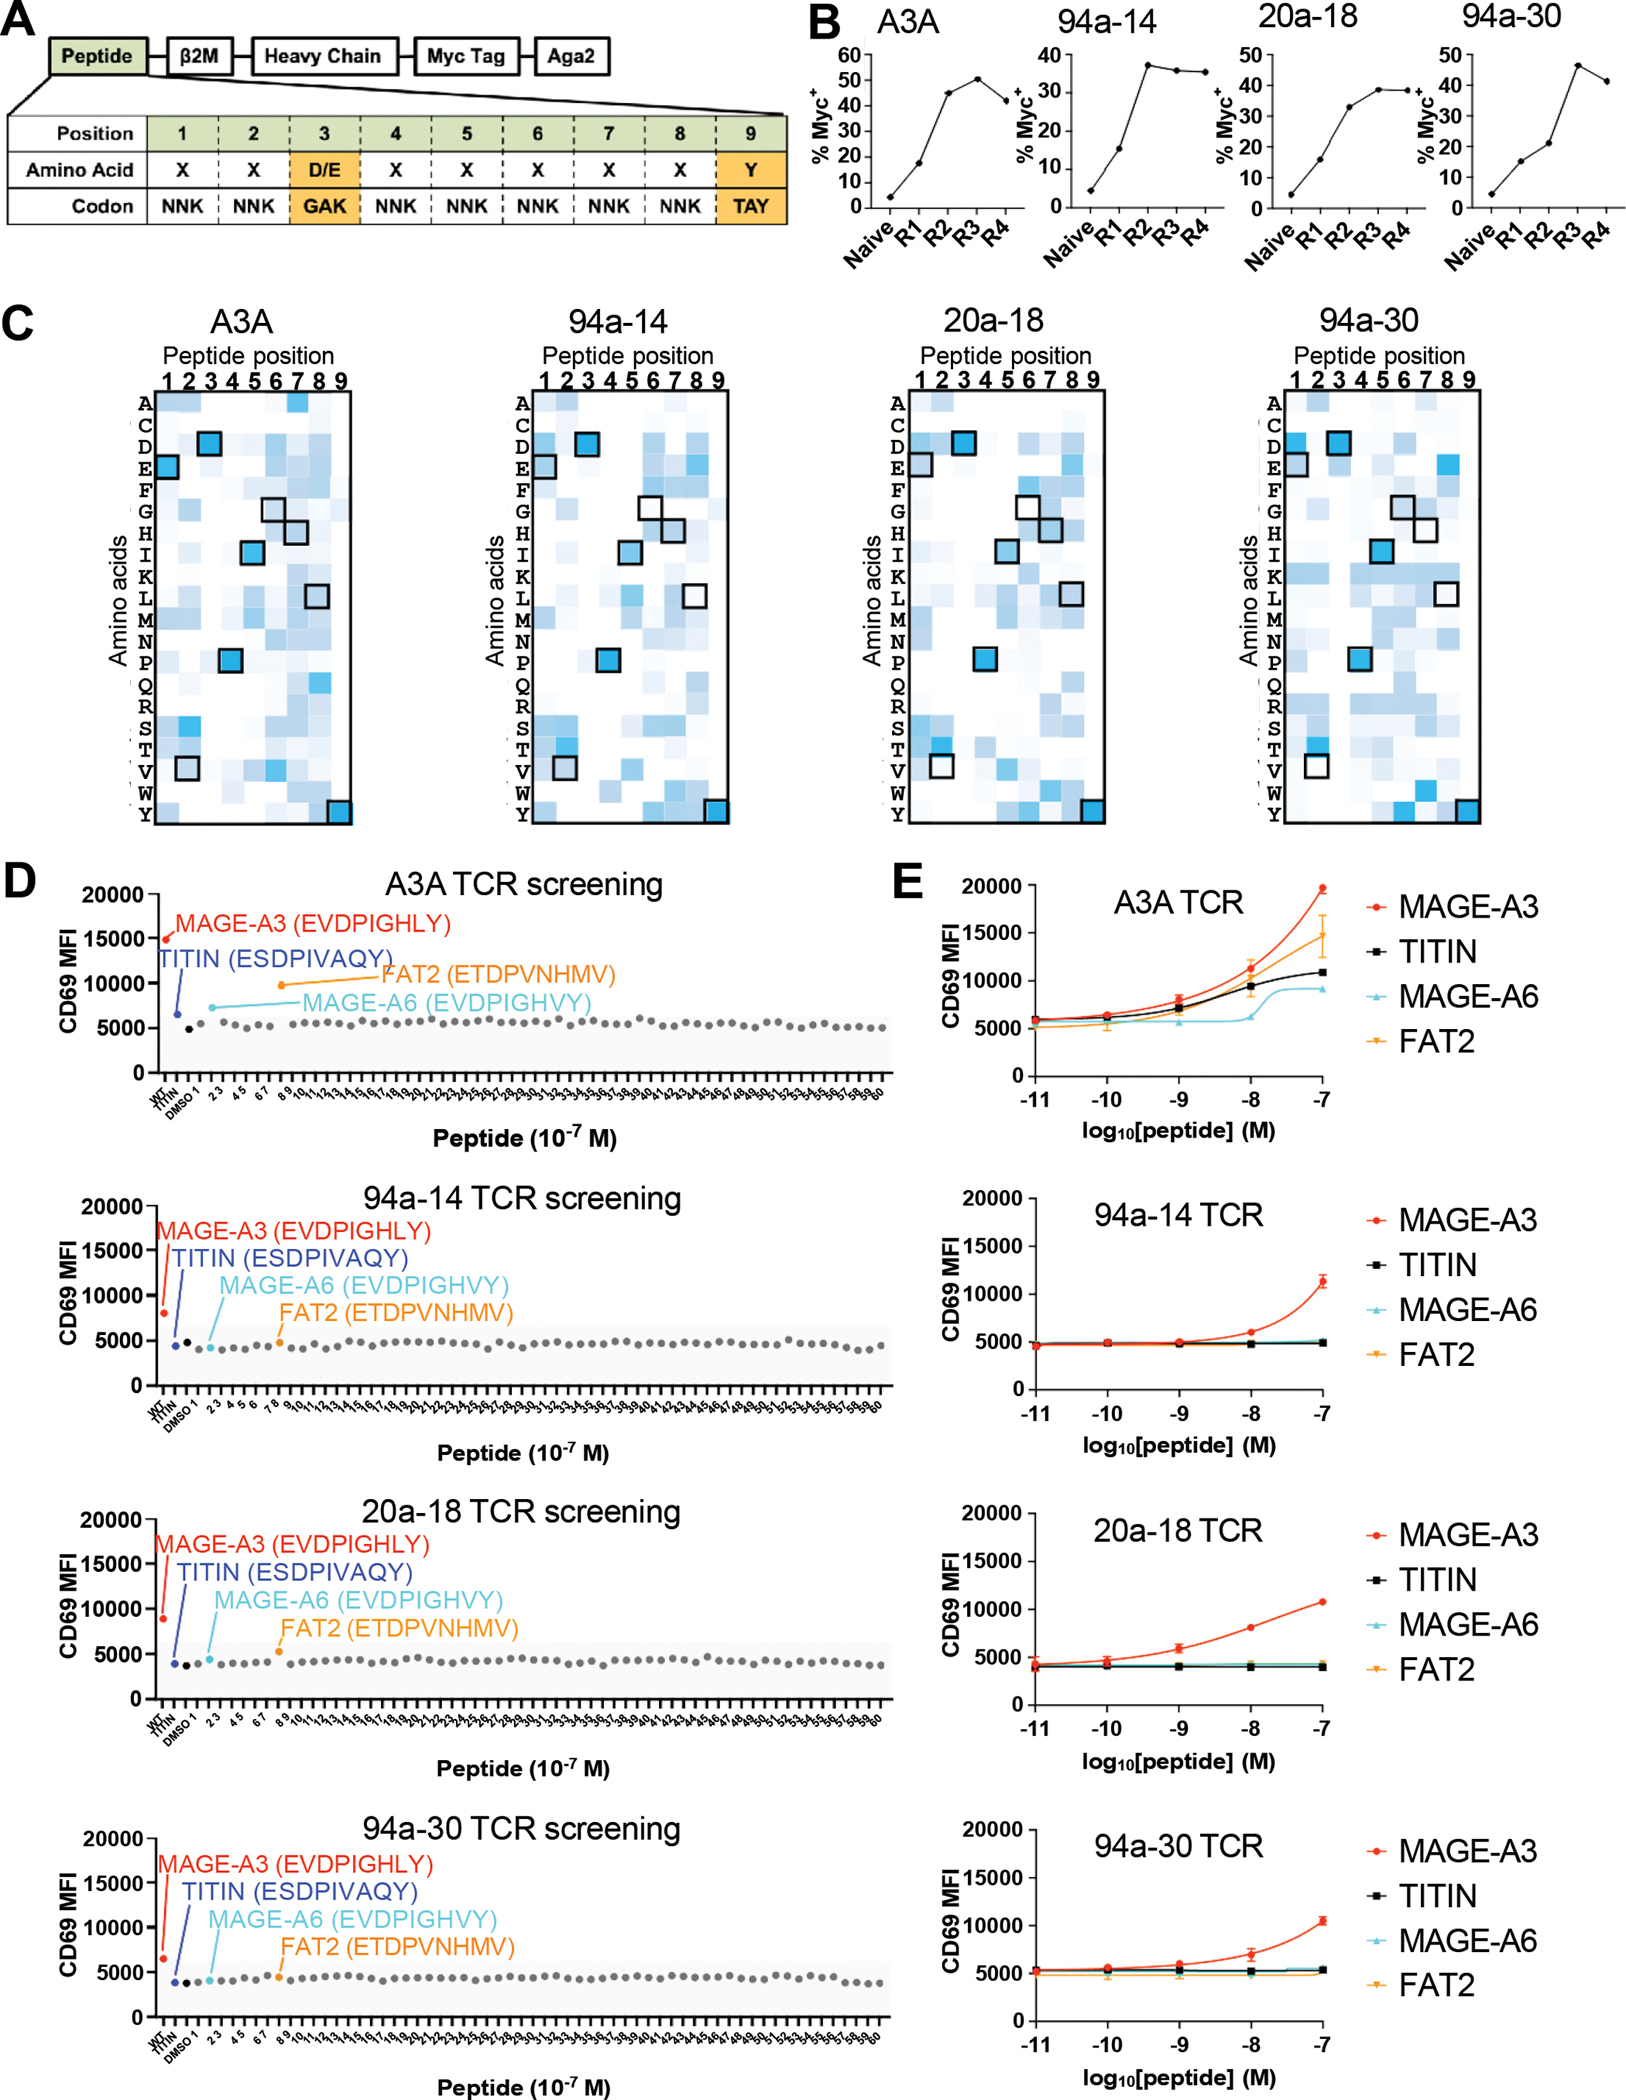
Adoptive cell therapy using engineered T cell receptors (TCRs) is a promising approach for targeting cancer antigens, but tumor-reactive TCRs are often weakly responsive to their target ligands, peptide-major histocompatibility complexes (pMHCs). Affinity-matured TCRs can enhance the efficacy of TCR-T cell therapy but can also cross-react with off-target antigens, resulting in organ immunopathology. We developed an alternative strategy to isolate TCR mutants that exhibited high activation signals coupled with low-affinity pMHC binding through the acquisition of catch bonds. Engineered analogs of a tumor antigen MAGE-A3-specific TCR maintained physiological affinities while exhibiting enhanced target killing potency and undetectable cross-reactivity, compared with a high-affinity clinically tested TCR that exhibited lethal cross-reactivity with a cardiac antigen. Catch bond engineering is a biophysically based strategy to tune high-sensitivity TCRs for T cell therapy with reduced potential for adverse cross-reactivity.


Conflict of interest statement

Competing interests: X.Z. and K.C.G. are coinventors of patent under Serial No. US 63/158, 131. M.H.G., L.V.S. and K.C.G. are co-founders of 3T Biosciences.

Figures

Figure 1.
Figure 1.. The design of catch bond fishing libraries and selection strategy.
(A) TCR55-transduced SKW3 T cells were stimulated by KG-1 cells pulsed with titrated HIV or Pep20 peptides for 14 hours. Anti-CD69 staining was performed on the SKW3 T cells and analyzed by flow cytometry. (B) TCR55-transduced SKW3 T cells were stimulated by KG-1 cells pulsed with titrated HIV or Pep20 peptides for 15 min. Anti-phospho-ERK staining was performed on the SKW3 T cells and analyzed by flow cytometry. (C) The design of TCR55 libraries. Each library has 3 or 4 residues selected to be randomized. The side chains of the residues selected for mutation on TCR55 are shown as sticks in the figures. (D) Workflow of catch bond engineering of TCR. (A-B) Data are representative of 3 independent experiments. Data are shown as mean ± SD of technical triplicates.
Figure 2.
Figure 2.. A hotspot on the TCR can tune TCR signaling strength.
(A) B35-HIV tetramer staining and anti-CD69 staining of cells transduced with library clones in each round of selection. The gate is based on the staining of WT TCR55. (B) A stimulatory clone, TCR55α-A98H, was selected from the library and was stimulated by KG-1 cells pulsed with titrated HIV peptides for 14 hours. Anti-CD69 staining was performed on the transduced SKW3 T cells and analyzed by flow cytometry. (C) SPR experiments of TCR55α-A98H protein binding to B35-HIV. Biotinylated B35-HIV monomer was immobilized on the streptavidin chip and the TCR55α-A98H protein was flowed through the chip. (D) Biomembrane force probe experiments to measure bond lifetime force curves for TCR55α-A98H or TCR55 WT binding to B35-HIV. (E) TCR55α-A98 was mutated to D, E, F, Q, Y, H and used to transduce SKW3 T cells with WT TCR55β. The transfectants were stimulated by KG-1 cells pulsed with titrated HIV peptides for 14 hours. Anti-CD69 staining was performed on the transduced SKW3 T cells and analyzed by flow cytometry. (F) Mean value of maximal anti-CD69 MFI versus 3D binding affinity KD of TCR55α-A98 mutants transfectants. The linear correlation analysis was performed for stimulatory mutants and TCR55 WT. (G) Biomembrane force probe experiments to measure bond lifetime force curves for TCR55α-A98H, TCR55α-A98E or TCR55α-A98Q T cell transfectants binding to B35-HIV. (H) Mean value of maximal anti-CD69 MFI versus peak bond lifetime of TCR55α-A98 mutants transfectants. (B, E) Data are representative of 3 independent experiments. Data are shown as mean ± SD of technical triplicates. (D, G) Data are shown as mean ± SEM of 500+ individual bond lifetimes per force curve.
Figure 3.
Figure 3.. Signaling landscape of catch bond engineered TCRs.
(A) ERK activation dynamics induced by B35-HIV engagement with the indicated TCR55 variant or TCR589, measured by ERK-KTR-mScarlet cytoplasmic/nuclear intensity ratio over imaging time. (B) p38 activation dynamics measured by p38-KTR-mScarlet cytoplasmic/nuclear intensity ratio over imaging time. (C) NFAT2 activation dynamics measured by GFP1-11-NFAT2 nuclear/cytoplasmic intensity ratio over imaging time. (D) AUC (area under the curve) distribution of single-cell ERK activation dynamics. (E) AUC distribution of single-cell p38 activation dynamics. (F) AUC distribution of single-cell NFAT2 activation dynamics. (G) Radar summary plot with normalized mean AUC values to illustrate the signaling landscape of TCR55 variant or TCR589 in response to B35-HIV engagement. (H) Mean ERK/p38/NFAT2 AUC distribution versus peak bond lifetime measurement. (I) Schematic illustration of bead-T cell interaction in BATTLES. (J) Calcium flux signaling strength of different TCR55 mutants transfectants. Individual cell signals are shown as circular markers; lines represent the mean values. (K) The correlation between calcium flux signaling strength and peak bond lifetime of different TCR55 mutants transfectants. Errors represent standard error of the mean. (A-F, I) Data are representative of 2 independent experiments.
Figure 4.
Figure 4.. Catch bond engineering of MAGE-A3-specific TCR.
(A) The WT TCR or A3A TCR chains were transduced in SKW3 T cells. The transfectants were stimulated by HLA-A1+ 293T cells pulsed with titrated MAGE-A3 peptide or TITIN peptide. Anti-CD69 staining was performed on the T cells and analyzed by flow cytometry. (B) The design of MAGE-A3 TCR Vα library. The library has 4 residues picked to be randomized. The side chains of the selected resides on the TCR were shown as sticks in the figures. (C) 3 rounds of selection of the MAGE-A3 TCR Vα library on tetramer staining-low and anti-CD69 staining-high gate. The gate is based on the staining of MAGE-A3 WT TCR. (D) The 8 high-potency MAGE-A3 TCR mutants were transduced into SKW3 T cells. The transfectants were stimulated by HLA-A1+ 293T cells pulsed with titrated MAGE-A3 peptide. Anti-CD69 staining was performed on the T cells and analyzed by flow cytometry. (E) The 5 intermediate-potency MAGE-A3 TCR mutants were transduced into SKW3 T cells. The transfectants were stimulated by HLA-A1+ 293T cells pulsed with titrated MAGE-A3 peptide. Anti-CD69 staining was performed on the T cells and analyzed by flow cytometry. (F) The correlation between mean value of maximal anti-CD69 MFI and 3D affinity of selected MAGE-A3 TCR mutants binding to HLA-A1-MAGE-A3. (G) The 8 high-potency MAGE-A3 TCR mutants were transduced in SKW3 T cells. The transfectants were stimulated by HLA-A1+ 293T cells pulsed with titrated TITIN peptide. Anti-CD69 staining was performed on the T cells and analyzed by flow cytometry. (H) Biomembrane force probe experiments to measure bond lifetime force curves for WT, A3A, 94a-14 or 20a-18 TCR binding to HLA-A1-MAGE-A3. Data are shown as mean ± SEM of 500+ individual bond lifetimes per force curve. (I) Mean value of maximal anti-CD69 MFI versus peak bond lifetime of MAGE-A3 TCR mutants transfectants. (J) Multiple measurements of bond lifetime at 10 pN for WT, A3A, 94a-14 and 20a-18 TCR. ns: not significant; ✱: P<0.05; ✱✱: P<0.01; ✱✱✱: P<0.001; ✱✱✱✱: P<0.0001 (A, D-E, G) Data are representative of 3 independent experiments. Data are shown as mean ± SD of technical triplicates.
Figure 5.
Figure 5.. Cytotoxicity and specificity of engineered MAGE-A3-specific TCR.
(A-B) Killing of A375 melanoma cell line by different MAGE-A3-specific TCR transduced human primary T cells. (C-E) IFN-γ, TNF, and cytotoxic granule release (CD107a staining) by different MAGE-A3-specific TCR transduced human primary T cells, induced by the A375 melanoma cell line. (F-G) Killing of HCT-116 colon cancer cell line by different MAGE-A3-specific TCR transduced human primary T cells. (H-J) IFN-γ, TNF, and cytotoxic granule release (CD107a staining) by different MAGE-A3-specific TCR transduced human primary T cells, induced by the HCT-116 colon cancer cell line. (K-M) Cytotoxic granule release (CD107a staining), TNF, and IFN-γ by different MAGE-A3-specific TCR transduced human primary T cells, induced by HLA-A1+ 293T cells pulsed with a titration of MAGE-3 peptide. (N-P) Cytotoxic granule release (CD107a staining), TNF, and IFN-γ by different MAGE-A3-specific TCR transduced human primary T cells, induced by HLA-A1+ 293T cells pulsed with a titration of TITIN peptide. (A-P) Data are representative of 3 independent experiments. Data are shown as mean ± SD of technical duplicates. ns: not significant; ✱: P<0.05; ✱✱: P<0.01; ✱✱✱: P<0.001; ✱✱✱✱: P<0.0001
Figure 6.
Figure 6.. Cross-reactivity screening of MAGE-A3 TCR variants with pMHC libraries.
(A) Design of the single-chain HLA-A*01 yeast-display peptide library. The DNA peptide library design shows an NNK codon library for all positions except anchor positions P3 (GAK) and P9 (TAY) to maximize peptides displayed by HLA-A*01. The single-chain trimer construct is N-terminal to the Myc tag fused to Aga2 for expression on yeast. (B) Increasing myc tag expression on yeast over rounds of selection represents enrichment of peptide HLA-A*01 and positive selection of the library. (C) Heat map of round 4 selected peptides showing peptide position by amino acid accounting for the number of reads detected per peptide. Boxed amino acids represent the MAGE-A3 peptide EVDPIGHLY. Dark blue represents a more enriched amino acid in that position. (D) MAGE-A3 (red dot), TITIN (blue dot), DMSO (black dot) and 60 predicted peptides (MAGE-A6: cyan dot; FAT2: orange dot) were used to pulse 293T-HLA-A1 cells to stimulate SKW3 T cells expressing different TCRs for 14 hours. Anti-CD69-APC staining was performed and analyzed on flow cytometry. (E) 293-HLA-A1 cells were pulsed with titrated MAGE-A3, TITIN, MAGE-A6 or FAT2 peptides to stimulate SKW3 T cells expressing MAGE-A3 TCR variants for 14 hours. Anti-CD69-APC staining was performed and analyzed on flow cytometry. (D) Data are representative of 2 independent experiments. (E) Data are representative of 2 independent experiments. Data are shown as mean ± SD of technical duplicates.

References

    1. Stone JD, Chervin AS, Kranz DM, T-cell receptor binding affinities and kinetics: impact on T-cell activity and specificity. Immunology. 126, 165–176 (2009). - PMC - PubMed
    1. Degano M et al., A functional hot spot for antigen recognition in a superagonist TCR/MHC complex. Immunity. 12, 251–261 (2000). - PubMed
    1. Kalergis AM et al., Efficient T cell activation requires an optimal dwell-time of interaction between the TCR and the pMHC complex. Nat. Immunol. 2, 229–234 (2001). - PubMed
    1. Kolawole EM, Lamb TJ, Evavold BD, Relationship of 2D Affinity to T Cell Functional Outcomes. Int J Mol Sci. 21, 7969 (2020). - PMC - PubMed
    1. Kim ST et al., The alphabeta T cell receptor is an anisotropic mechanosensor. J. Biol. Chem. 284, 31028–31037 (2009). - PMC - PubMed

LinkOut - more resources