. 2022 May 9;7(9):e157699.
doi: 10.1172/jci.insight.157699.

Immunogenic epitope panel for accurate detection of non-cross-reactive T cell response to SARS-CoV-2

Affiliations

Immunogenic epitope panel for accurate detection of non-cross-reactive T cell response to SARS-CoV-2

Aleksei Titov et al. JCI Insight. .

Abstract

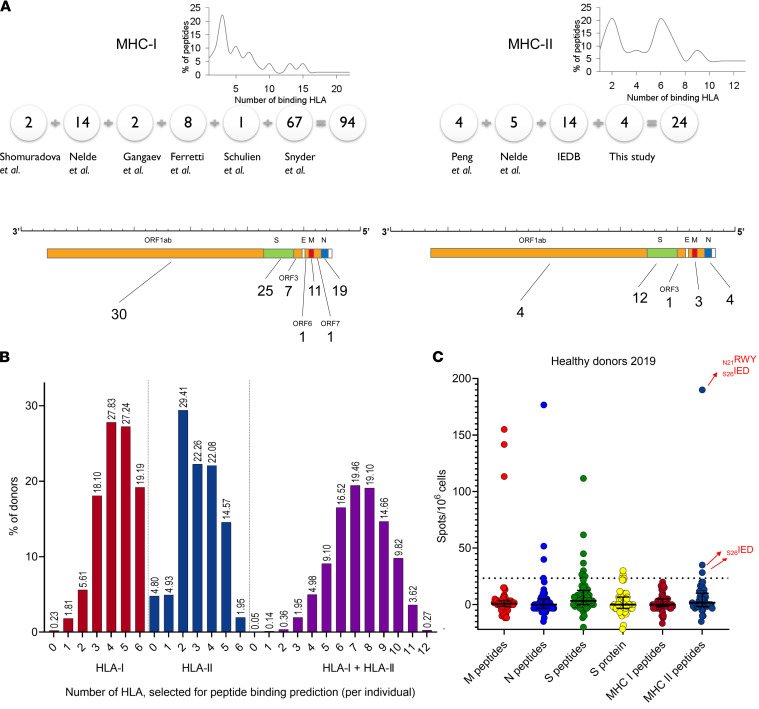
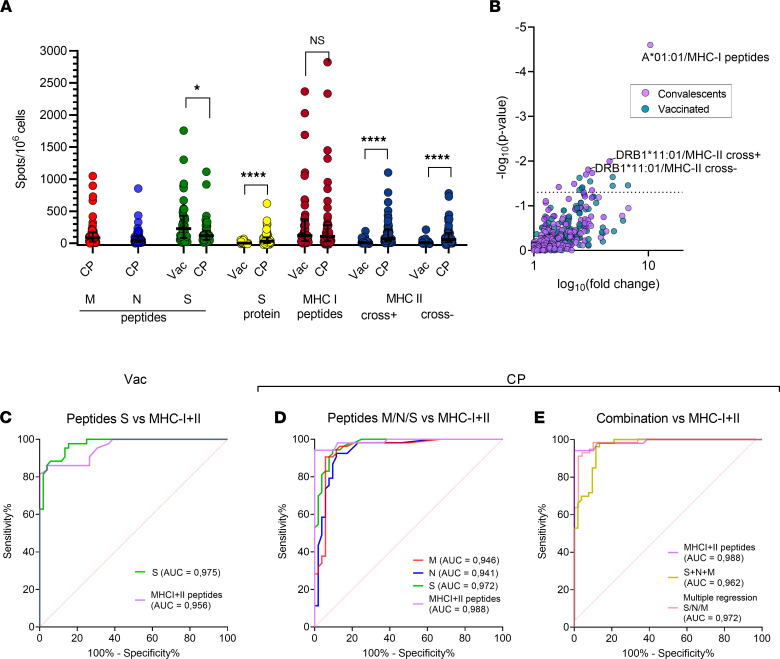
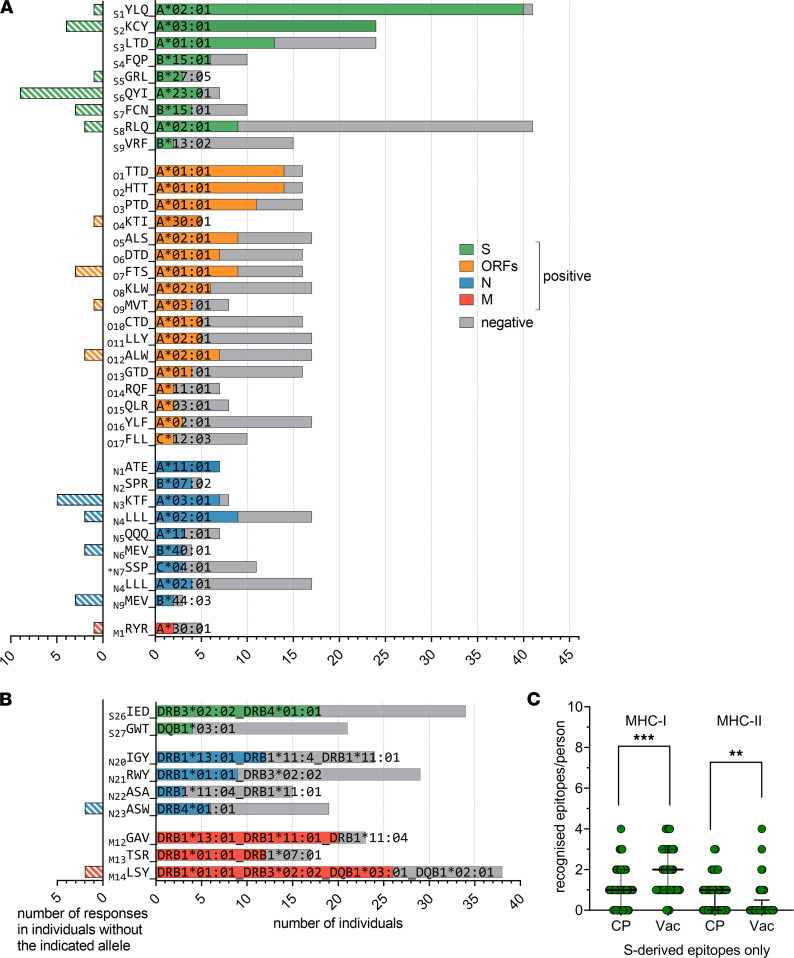
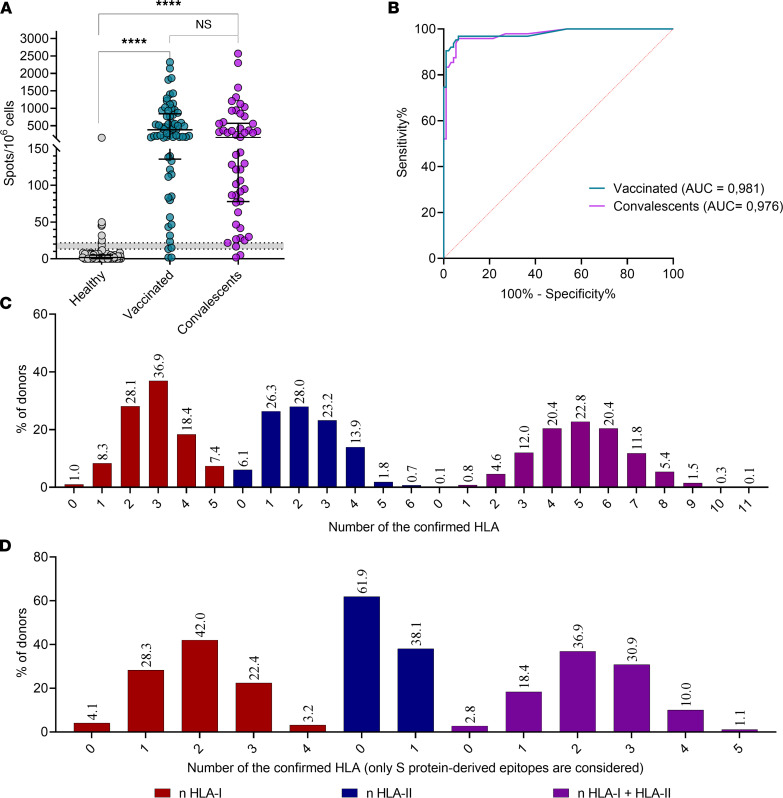
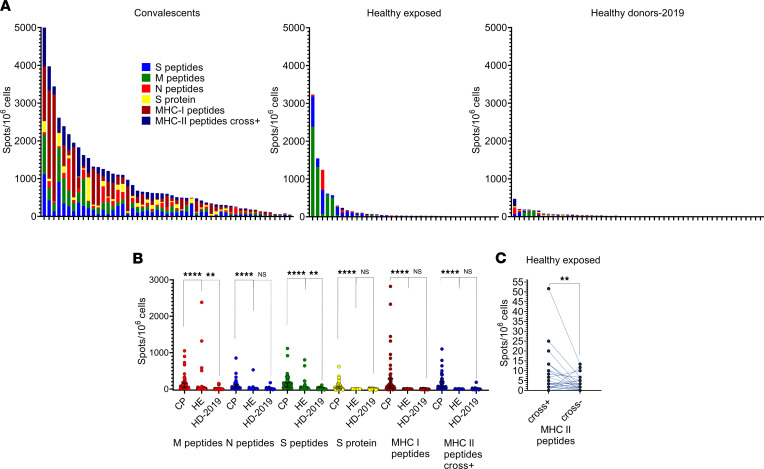
The ongoing COVID-19 pandemic calls for more effective diagnostic tools. T cell response assessment serves as an independent indicator of prior COVID-19 exposure while also contributing to a more comprehensive characterization of SARS-CoV-2 immunity. In this study, we systematically assessed the immunogenicity of 118 epitopes with immune cells collected from multiple cohorts of vaccinated, convalescent, healthy unexposed, and SARS-CoV-2-exposed donors. We identified 75 immunogenic epitopes, 24 of which were immunodominant. We further confirmed HLA restriction for 49 epitopes and described association with more than 1 HLA allele for 14 of these. Exclusion of 2 cross-reactive epitopes that generated a response in prepandemic samples left us with a 73-epitope set that offered excellent diagnostic specificity without losing sensitivity compared with full-length antigens, and this evoked a robust cross-reactive response. We subsequently incorporated this set of epitopes into an in vitro diagnostic Corona-T-test, which achieved a diagnostic accuracy of 95% in a clinical trial. In a cohort of asymptomatic seronegative individuals with a history of prolonged SARS-CoV-2 exposure, we observed a complete absence of T cell response to our epitope panel. In combination with strong reactivity to full-length antigens, this suggests that a cross-reactive response might protect these individuals.

Keywords: Antigen; COVID-19; Clinical Trials; Peptides; T cells.


Conflict of interest statement

Conflict of interest: The authors have declared no conflict of interest exists.

Figures

Figure 1
Figure 1. Characteristics of the peptide set.
(A) Number of epitopes selected from each indicated publication (detailed in Supplemental Table 1) for the MHC-I (left) and -II (right) sets. The distribution of the peptides according to the number of HLA that they bind is shown at top. The x axis displays the number of predicted binding alleles per peptide. The y axis shows the percentage of peptides that bind to a given number of alleles. Numbers below the SARS-CoV-2 genome schematic indicate the number of peptides derived from each gene. (B) The number of HLA class I (left) and -II (middle) alleles alone or in combination (right) that are predicted to bind at least 1 peptide from the set per individual among 2210 donors from the BM registry. (C) Antigen response among the healthy (HD-2019) cohort (n = 52). The normalized mean of 2 duplicate wells and the median and interquartile range. Cross-reactive MHC-II peptides are marked with red arrows. The positive threshold is indicated by the dotted line.
Figure 2
Figure 2. Response to MHC-II peptides differs significantly in Vac and CP donors.
(A) Response to the indicated antigens as measured by ELISpot for Vac (n = 43) and CP (n = 51). A normalized mean of 2 duplicate wells and a median with interquartile range. Mann-Whitney U test (S peptides, P = 0.013; MHC-II peptides, recombinant S protein, P < 0.0001). (B) Volcano plot shows the effect of a particular HLA allele on response to the same peptide sets and antigens. The x axis denotes the decimal logarithm of the ratio of the median response among HLA carriers to that of individuals without the HLA. The y axis denotes the negative decimal logarithm of the P value. The 3 most significant associations are annotated. P = 0.05 is depicted by the dotted line (Fisher’s exact test). (CE) Receiver operating characteristic (ROC) curves for MHC I + II peptides versus S peptides in Vac versus HD-2019 samples (C); MHC I + II peptides versus S, N, or M peptides in CP versus HD-2019 samples (D); and MHC I + II peptides versus the sum of S, N, and M peptides and versus multiple regression model, incorporating S, N, and M peptides in CP versus HD-2019 samples (E). Three HD-2019 donors with cross-reactive responses were excluded from the ROC analysis for MHC I + II peptides.
Figure 3
Figure 3. T cell response to MHC-I and MHC-II epitopes in CP and Vac.
(A and B) Immunogenicity in carriers of various HLA-I (A) or HLA-II (B) alleles. For the right sides of the plots, gray bars indicate the number of tested carriers; colored bars indicate the number of responses. Colors indicate source protein, with 3-letter amino acid codes at left. Superscript numbers indicate peptide length, and the asterisk denotes a peptide with an ambiguous HLA association. The left sides of the plots show the number of responses in donors without the indicated HLA. For HLA-I, the association between the response and a single HLA allele is shown; for HLA-II, the best associations (including associations with several HLAs) are shown. Fisher’s exact test; P < 0.05 were considered significant (exact P values are specified in Supplemental Table 3). (C) Number of S protein–derived MHC-I and MHC-II epitopes recognized per individual for the CP and Vac cohorts; median and interquartile range are shown
Figure 4
Figure 4. Clinical trial confirmed the high accuracy of the Corona-T-test in discriminating healthy donors from vaccinated and convalescents.
(A) Scatter plot shows Corona-T-test result. A normalized mean of 2 duplicate wells for the Vac_trial (n = 69) and CP_trial (n = 50) and HD-2021 (n = 95) cohort with median and interquartile range. Results in the gray zone (n = 6) were excluded from the ROC-analysis. Kruskal-Wallis with Dunn’s post hoc test; ****P < 0.0001. (B) ROC curve for Vac_trial (AUC = 0.98) an CP_trial (AUC = 0.97) versus HD-2021_trial. (C and D) Number of confirmed HLA-I and -II alleles per individual binding at least 1 peptide from any protein (C) or S protein (D) (n = 2210).
Figure 5
Figure 5. Evidence for a cross-reactive rather than SARS-CoV-2–specific response in the healthy exposed (HE) cohort.
(A) Response to the antigens (normalized mean of 2 wells after subtracting negative control) in HE (n = 37), CP (n = 51), and HD-2019 (n = 52) cohorts. Each bar represents an individual donor; colors represent particular antigens. (B) Comparison of the response to antigens between cohorts as measured with ELISpot. A normalized mean of 2 duplicate well, and the median response and interquartile range. Kruskal-Wallis with Dunn’s post hoc test; ****P < 0.0001, **P < 0.01. (C) Difference in responses to MHC-II peptides before and after exclusion of 2 cross-reactive peptides in the HE cohort (Wilcoxon test; P = 0.0045).**P < 0.01.

References

    1. Jain R, et al. Seroprevalence of SARS-CoV-2 among potential convalescent plasma donors and analysis of their deferral pattern: Experience from tertiary care hospital in western India. Transfus Clin Biol. 2022;29(1):60–64. doi: 10.1016/j.tracli.2021.07.004. - DOI - PMC - PubMed
    1. Wajnberg A, et al. Robust neutralizing antibodies to SARS-CoV-2 infection persist for months. Science. 2020;370(6521):1227–1230. doi: 10.1126/science.abd7728. - DOI - PMC - PubMed
    1. Gudbjartsson DF, et al. Humoral immune response to SARS-CoV-2 in Iceland. N Engl J Med. 2020;383(18):1724–1734. doi: 10.1056/NEJMoa2026116. - DOI - PMC - PubMed
    1. Braun J, et al. SARS-CoV-2–reactive T cells in healthy donors and patients with COVID-19. Nature. 2020;587(7833):270–274. doi: 10.1038/s41586-020-2598-9. - DOI - PubMed
    1. Grifoni A, et al. Targets of T cell responses to SARS-CoV-2 coronavirus in humans with COVID-19 disease and unexposed individuals. Cell. 2020;181(7):1489–1501. doi: 10.1016/j.cell.2020.05.015. - DOI - PMC - PubMed

Publication types

Substances