

Disparities in COVID-19 Mortality Rates: Implications for Rural Health Policy and Preparedness
- PMID: 35389953
- PMCID: PMC9307261
- DOI: 10.1097/PHH.0000000000001507
Disparities in COVID-19 Mortality Rates: Implications for Rural Health Policy and Preparedness
Abstract
Context: It is well established that rural communities face geographic and socioeconomic challenges linked to higher rates of health disparities across the United States, though the coronavirus disease 2019 (COVID-19) impact on rural communities is less certain.
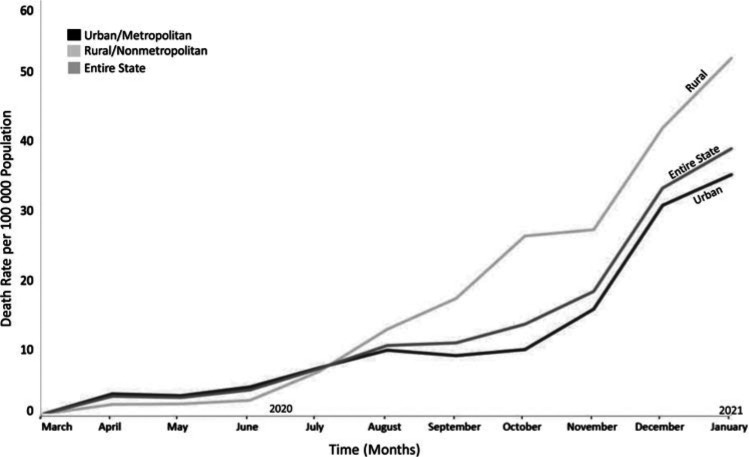
Objective: To understand the COVID-19 pandemic's impact on rural communities in Tennessee, investigate differences in rural-urban mortality rates after controlling for confounding variables, and inform state pandemic response policy.
Design: A cross-sectional analysis of cumulative COVID-19 morality rates.
Setting/participants: Tennessee county-level COVID-19 mortality data from March 1, 2020, to January 31, 2021, were matched with county-level sociodemographic and health data from public datasets: Agency for Healthcare Research and Quality Social Determinants of Health, PLACES: Local Data for Better Health County Data, and the US Census Bureau. County status was defined using the 2013 National Center for Health Statistics Urban-Rural Classification.
Main outcome measures: A negative binomial regression model estimated adjusted incidence rate ratio and 95% confidence intervals (CI) for rural compared with urban mortality. Unadjusted rate ratios and rate differences for COVID-19 mortality in rural versus urban counties were compared with those for influenza and pneumonia and all-cause mortality over the past 5 years.
Results: During the study period, 9650 COVID-19 deaths occurred across 42 urban and 53 rural counties. Controlling for county-level sociodemographic characteristics, health care access, and comorbidities, incidence rate ratio was 1.13 (95% CI, 1.00-1.28, P < .05) for rural as compared with urban deaths. Unadjusted COVID-19 mortality risk difference between rural and urban counties was greater (61.85, 95% CI, 54.31-69.31) than 5-year influenza and pneumonia rural-urban risk difference (12.57, 95% CI, 11.16-13.00) during 2015-2019.
Conclusions: COVID-19 mortality rates were greater for populations living in Tennessee's rural as compared with urban counties during the study period. This differential impact must be considered in public health decision making to mitigate COVID-19.
Copyright © 2022 Wolters Kluwer Health, Inc. All rights reserved.
Conflict of interest statement
The authors declare no conflicts of interests.
Figures
References
-
- Koh HK, Blakey CR, Roper AY. Healthy People 2020: a report card on the health of the nation. JAMA. 2014;311(24):2475–2476. - PubMed
-
- Centers for Disease Control and Prevention. CDC COVID-19 Response Health Equity Strategy: Accelerating Progress Towards Reducing COVID-19 Disparities and Achieving Health Equity. Atlanta, GA: Centers for Disease Control and Prevention; 2020.
Publication types
MeSH terms
LinkOut - more resources
Full Text Sources
Medical
Miscellaneous
