. 2022 Apr 7;17(4):e0265254.
doi: 10.1371/journal.pone.0265254. eCollection 2022.

Expert-augmented automated machine learning optimizes hemodynamic predictors of spinal cord injury outcome

Affiliations

Expert-augmented automated machine learning optimizes hemodynamic predictors of spinal cord injury outcome

Austin Chou et al. PLoS One. .

Erratum in

Abstract

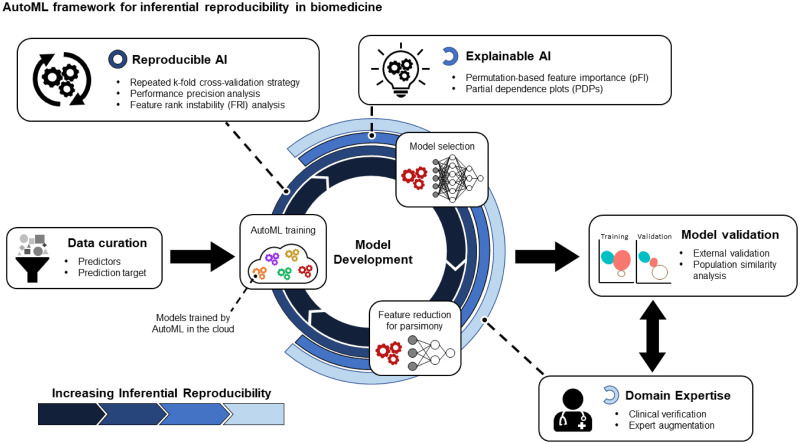
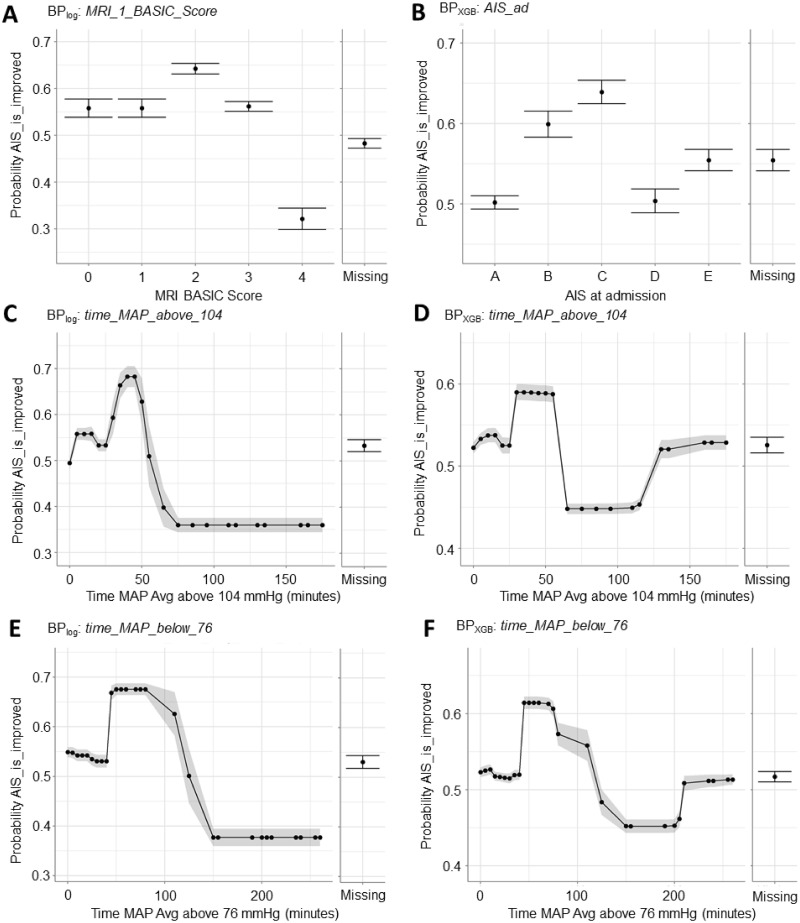
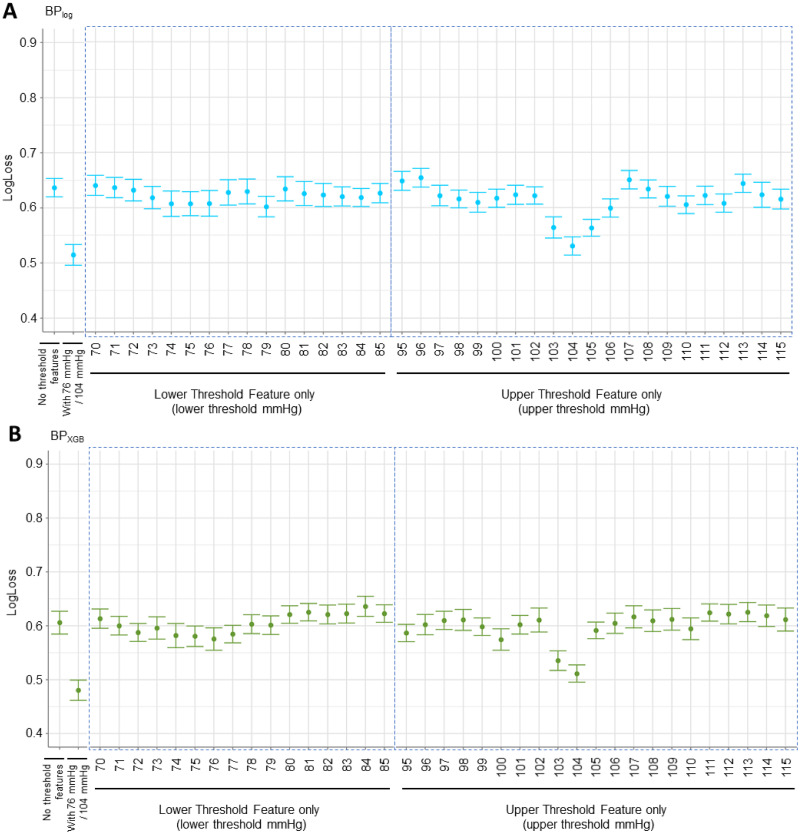
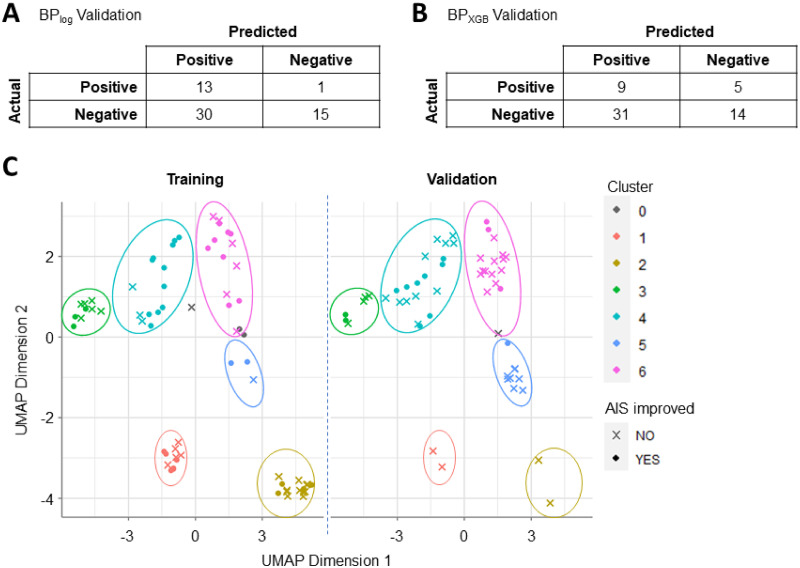
Artificial intelligence and machine learning (AI/ML) is becoming increasingly more accessible to biomedical researchers with significant potential to transform biomedicine through optimization of highly-accurate predictive models and enabling better understanding of disease biology. Automated machine learning (AutoML) in particular is positioned to democratize artificial intelligence (AI) by reducing the amount of human input and ML expertise needed. However, successful translation of AI/ML in biomedicine requires moving beyond optimizing only for prediction accuracy and towards establishing reproducible clinical and biological inferences. This is especially challenging for clinical studies on rare disorders where the smaller patient cohorts and corresponding sample size is an obstacle for reproducible modeling results. Here, we present a model-agnostic framework to reinforce AutoML using strategies and tools of explainable and reproducible AI, including novel metrics to assess model reproducibility. The framework enables clinicians to interpret AutoML-generated models for clinical and biological verifiability and consequently integrate domain expertise during model development. We applied the framework towards spinal cord injury prognostication to optimize the intraoperative hemodynamic range during injury-related surgery and additionally identified a strong detrimental relationship between intraoperative hypertension and patient outcome. Furthermore, our analysis captured how evolving clinical practices such as faster time-to-surgery and blood pressure management affect clinical model development. Altogether, we illustrate how expert-augmented AutoML improves inferential reproducibility for biomedical discovery and can ultimately build trust in AI processes towards effective clinical integration.


Conflict of interest statement

I have read the journal’s policy and the authors of this manuscript have the following competing interests: AC, SK, JF, JH, AL, RS, and CM are current or former employees of DataRobot and own shares of the company. Access to the DataRobot Automated Machine Learning platform was awarded through application and selection by the DataRobot AI for Good program. DataRobot affiliated authors provided editorial contributions during the preparation of the manuscript. All other authors have declared that they have no competing interests.

Figures

Fig 1
Fig 1. A framework for applying Automated Machine Learning (AutoML) for reproducible inferences in biomedical research.
After data is curated, we perform a cyclical model development process utilizing AutoML to optimize an array of models. Reproducible and explainable AI tools and strategies can be applied to ultimately draw clinical and biological inferences from the models and allow for integration of domain expertise. Critically for clinical modeling, we also include a feature reduction component to achieve a more parsimonious model. The final models are then validated with external validation data along with population similarity analysis for further clinical contextualization. By applying this framework, models produced by AutoML can be stabilized and interpreted for inferential reproducibility and clinical verifiability.
Fig 2
Fig 2. AutoML generated 15 models that performed better than the Majority Class Classifier model.
Each model consisted of automatically implemented preprocessing steps and algorithms. Models were assigned names according to the algorithm and encoded by a unique color. Blueprints of the same algorithm class are numbered for identification across both (A) LogLoss and (B) Area Under Curve (AUC) plots. Two models were selected for additional analysis: BPlog (blue box) and BPXGB (green box). Aggregating across 25 projects (unique partitioning arrangements of the dataset), BPlog had an average performance of 0.67 ± 0.01 LogLoss and 0.68 ± 0.02 AUC; BPXGB had an average performance of 0.68 ± 0.01 LogLoss and 0.67 ± 0.02 AUC. (C) BPlog consisted of a regularized logistic regression (L2) algorithm with a notable quintile spline transformation preprocessing step for numeric variables. (D) BPXGB implemented an eXtreme Gradient Boosted (XGB) trees classifier with unsupervised learning features, which refers to the TensorFlow Variational Autoencoder preprocessing step for categorical variables.
Fig 3
Fig 3. Feature rank instability (FRI) analysis as a function of number of projects aggregated.
As the number of projects increased, FRI decreased (i.e. pFI ranking became more stable). (A, B) Expected FRI calculated for all 46 features. BPlog had an average FRI of 174.40 ± 2.14 with 2-project aggregation and 13.03 ± 0.34 with 25-project aggregation (A). Similarly, BPXGB started with an average FRI of 153.83 ± 3.06 that decreased to 11.65 ± 0.33 at 25 projects (B). (C, D) Focusing only on the bottom five features by pFI to calculate FRI, BPlog had an average FRI of 20.41 ± 0.75 with 2-project aggregation and decreased to 0.96 ± 0.08 with 25-project aggregation (C). Similarly, BPXGB started with an average FRI of 7.77 ± 0.37 and decreased to 0.56 ± 0.06 for the bottom five features with 25-project aggregation (D).
Fig 4
Fig 4. Applying an iterative backward feature reduction process to identify parsimonious feature lists that maximize model performance.
The process was performed first by removing the lowest five features by feature importance (step size = 5) and then repeated with step size = 1 within the feature list size range that contained the best performance. (A) For BPlog, the step size was reduced starting at 16 features with the best performance observed with the 9-feature parsimonious feature list (LogLoss = 0.55 ± 0.02). (B) The corresponding pFI of the 9-feature parsimonious BPlog model showed that the MRI BASIC score and the time patients spent outside of the MAP thresholds were the most important features. The remaining features included other intraoperative timeseries-derived features and the time between hospitalization and surgery (Time_to_OR_a). (C) The feature reduction for BPXGB was expanded to always preserve the two MAP threshold features. The step size was reduced to one starting at 16 features with the best performance observed with the 11-feature parsimonious feature list (LogLoss = 0.48 ± 0.02). (D) The corresponding pFI for the parsimonious BPXGB model showed that the AIS score at admission (AIS_ad) was the most important feature. Non-timeseries-derived features included Cervical_Injury, Vertebral_Artery_Injury, and TBI_Present. The time_MAP_Avg_above_104 and time_MAP_Avg_below_76 features were ranked 7th and 9th respectively.
Fig 5
Fig 5. Partial dependence plots (PDPs) for features of interest help interpret how features affect model prediction of BPlog and BPXGB.
(A) For BPlog, an MRI BASIC score of 4 resulted in lower prediction of improved outcome. A MRI BASIC score of 0–3 increased prediction of better outcome with a MRI BASIC score of 2 leading to the highest probability of improvement. (B) For BPXGB, an AIS score of A or D at admission resulted in lower probability of patient improvement. AIS scores of B and C both led to higher probability of improvement with AIS score C resulting in the highest probability. (C) For BPlog and (D) BPXGB, if a patient’s MAP exceeded an upper threshold of 104 mmHg for more than 50–75 minutes, the predicted probability of improvement decreased significantly. (E) For BPlog and (F) BPXGB, if a patient’s MAP fell below a lower threshold of 76 mmHg for more than 100–150 minutes, the predicted probability of improvement decreased significantly. Notably, BPXGB PDP for both time_MAP_Avg_above_104 and time_MAP_Avg_below_76 exhibited a rebound in predicted improvement probability at extreme upper values that was absent on the BPlog PDPs.
Fig 6
Fig 6. LogLoss performance plots for investigating different lower and upper MAP thresholds using best-performing parsimonious BPlog and BPXGB models.
(A) With BPlog, we observe that the lower threshold values of 74, 75, 76, and 79 mmHg performed the best of the lower thresholds. The upper threshold values of 103, 104, and 105 mmHg performed the best of the upper thresholds. Notably, the best-performing upper threshold feature (104 mmHg) resulted in a larger improvement to model performance compared to the best-performing lower threshold feature (79 mmHg). (B) With BPXGB, the values of 74, 75, and 76 mmHg performed the best of the lower thresholds, and the values of 103 and 104 performed the best of the upper thresholds. Similar to BPlog, the best-performing upper threshold feature (104 mmHg) resulted in a larger improvement to model performance compared to the best-performing lower threshold feature (76 mmHg).
Fig 7
Fig 7. Model validation confusion matrices and clustering analysis to demonstrate differences in patient population between training and validation datasets.
Validation predictions were scored by comparing the average predicted probability of each validation sample against the average best F1 threshold for the corresponding model. (A) The best parsimonious BPlog model correctly predicted 13 of the 14 true positives (i.e. patient improved in outcome) and 15 of the 45 true negatives. (B) The best parsimonious BPXGB model correctly predicted 9 of the 14 true positives and 14 of the 45 true negatives. (C) UMAP and HDB clustering analysis on the combined training and validation data produced six clusters of patients. Notably, Clusters 1 and 2 showed high representation in the training cohort and low representation in the validation cohort. Conversely, Cluster 3 showed low and high representation in the training and validation cohorts respectively. Clusters 3, 5, and 6 have no discernable differences between cohorts.

References

    1. Yao Q, Wang M, Chen Y, Dai W, Li Y-F, Tu W-W, et al. Taking Human out of Learning Applications: A Survey on Automated Machine Learning. ArXiv181013306 Cs Stat [Internet]. 2019 Dec 16 [cited 2020 Dec 7]; http://arxiv.org/abs/1810.13306.
    1. Escalante HJ, Montes M, Sucar LE, Mx I, Mx I. Particle Swarm Model Selection.:36.
    1. Feurer M, Klein A, Eggensperger K, Springenberg JT, Blum M, Hutter F. Efficient and Robust Automated Machine Learning.:9.
    1. Balaji A, Allen A. Benchmarking Automatic Machine Learning Frameworks. ArXiv180806492 Cs Stat [Internet]. 2018 Aug 16 [cited 2021 Feb 14]; http://arxiv.org/abs/1808.06492
    1. Muhlestein WE, Akagi DS, Kallos JA, Morone PJ, Weaver KD, Thompson RC, et al.. Using a Guided Machine Learning Ensemble Model to Predict Discharge Disposition following Meningioma Resection. J Neurol Surg Part B Skull Base. 2018. Apr;79(2):123–30. doi: 10.1055/s-0037-1604393 - DOI - PMC - PubMed

Publication types