

High-resolution and high-sensitivity PET for quantitative molecular imaging of the monoaminergic nuclei: A GATE simulation study
- PMID: 35390182
- PMCID: PMC11025683
- DOI: 10.1002/mp.15653
High-resolution and high-sensitivity PET for quantitative molecular imaging of the monoaminergic nuclei: A GATE simulation study
Abstract
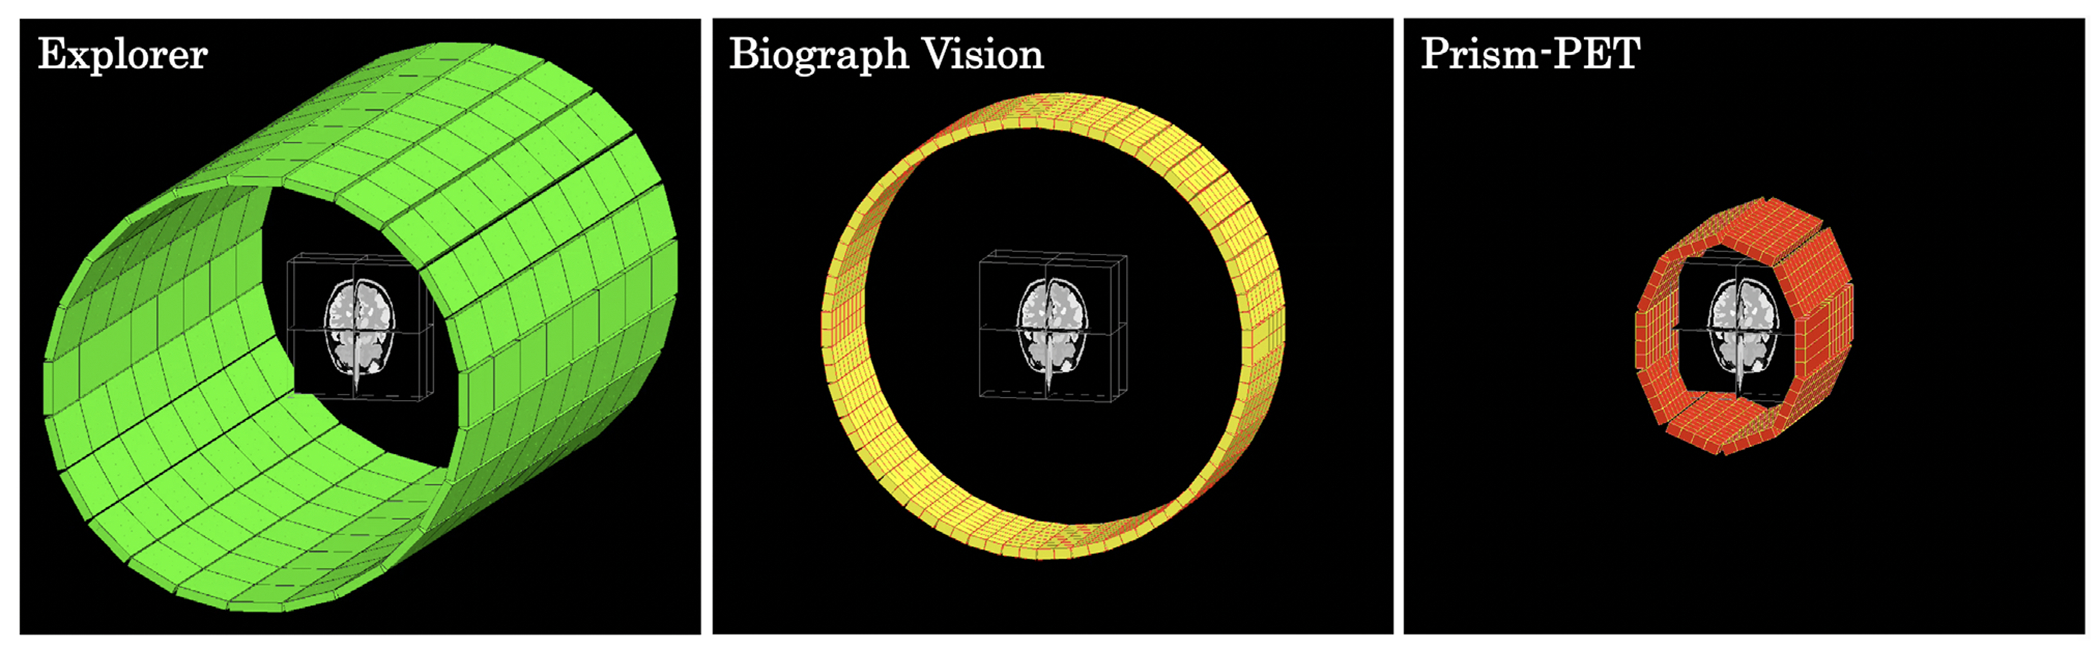
Purpose: Quantitative in vivo molecular imaging of fine brain structures requires high-spatial resolution and high-sensitivity. Positron emission tomography (PET) is an attractive candidate to introduce molecular imaging into standard clinical care due to its highly targeted and versatile imaging capabilities based on the radiotracer being used. However, PET suffers from relatively poor spatial resolution compared to other clinical imaging modalities, which limits its ability to accurately quantify radiotracer uptake in brain regions and nuclei smaller than 3 mm in diameter. Here we introduce a new practical and cost-effective high-resolution and high-sensitivity brain-dedicated PET scanner, using our depth-encoding Prism-PET detector modules arranged in a conformal decagon geometry, to substantially reduce the partial volume effect and enable accurate radiotracer uptake quantification in small subcortical nuclei.
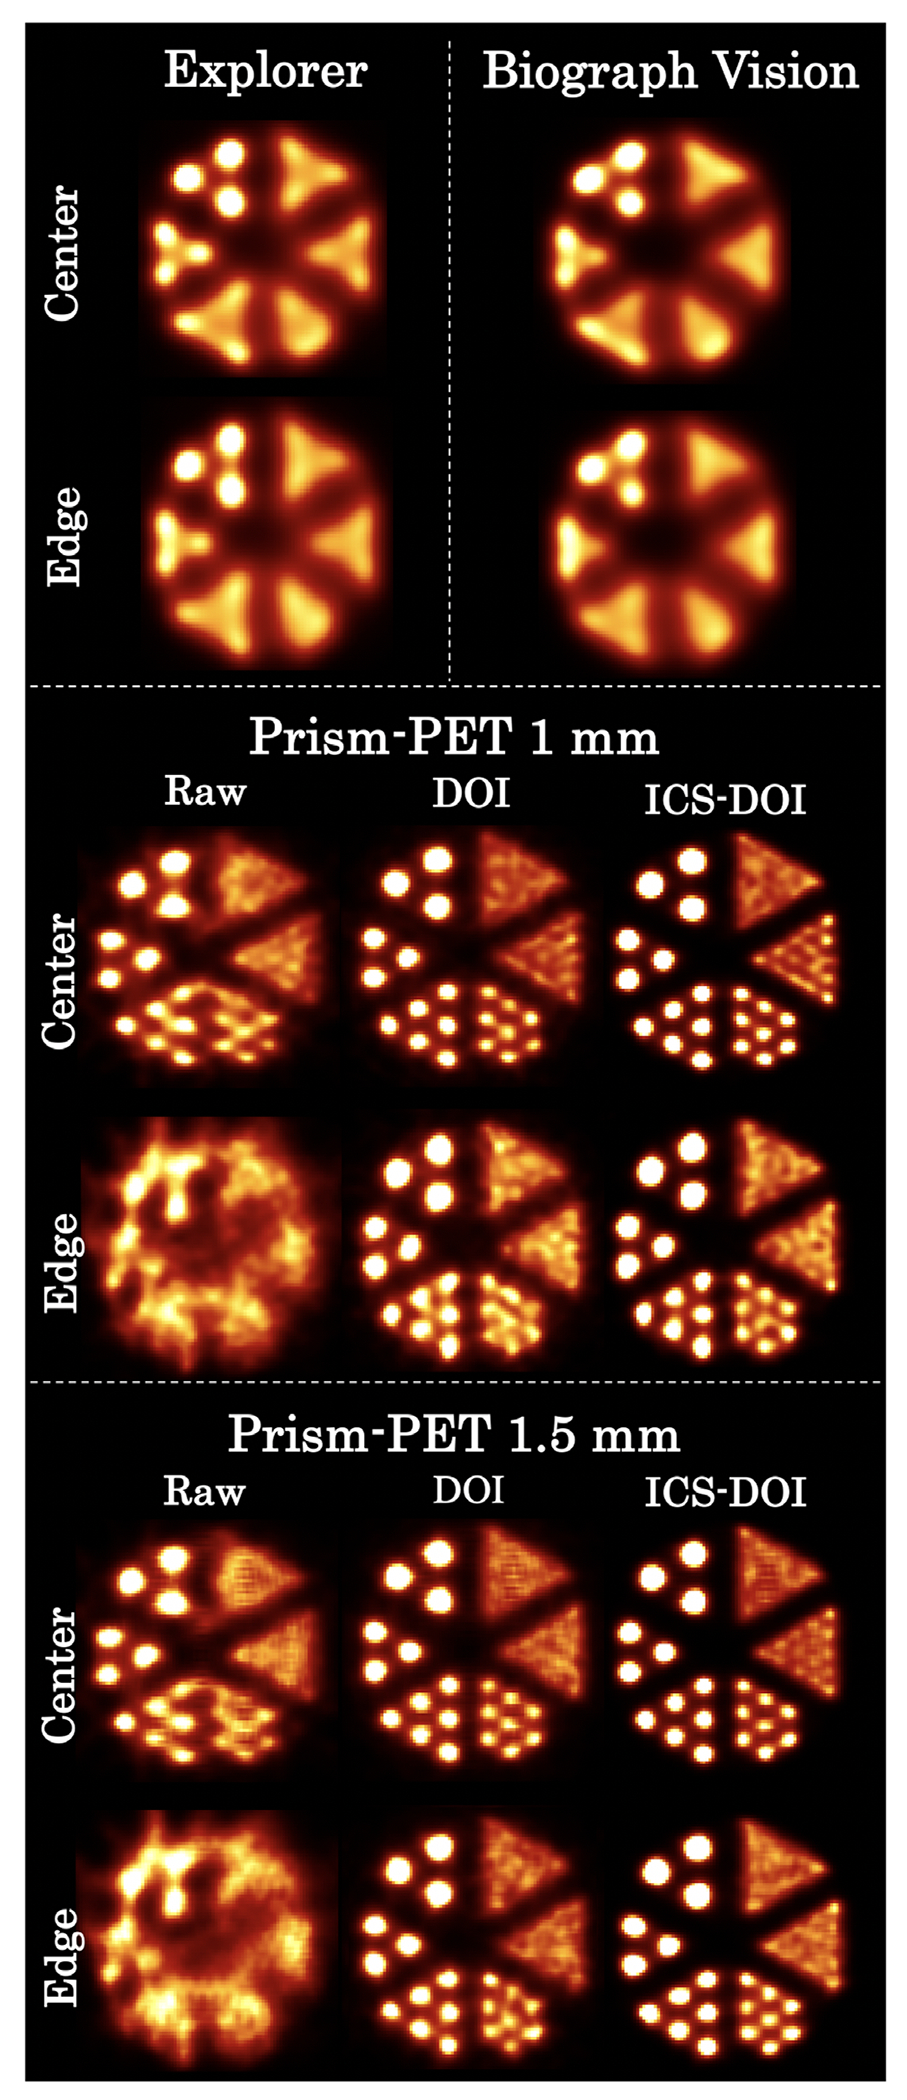
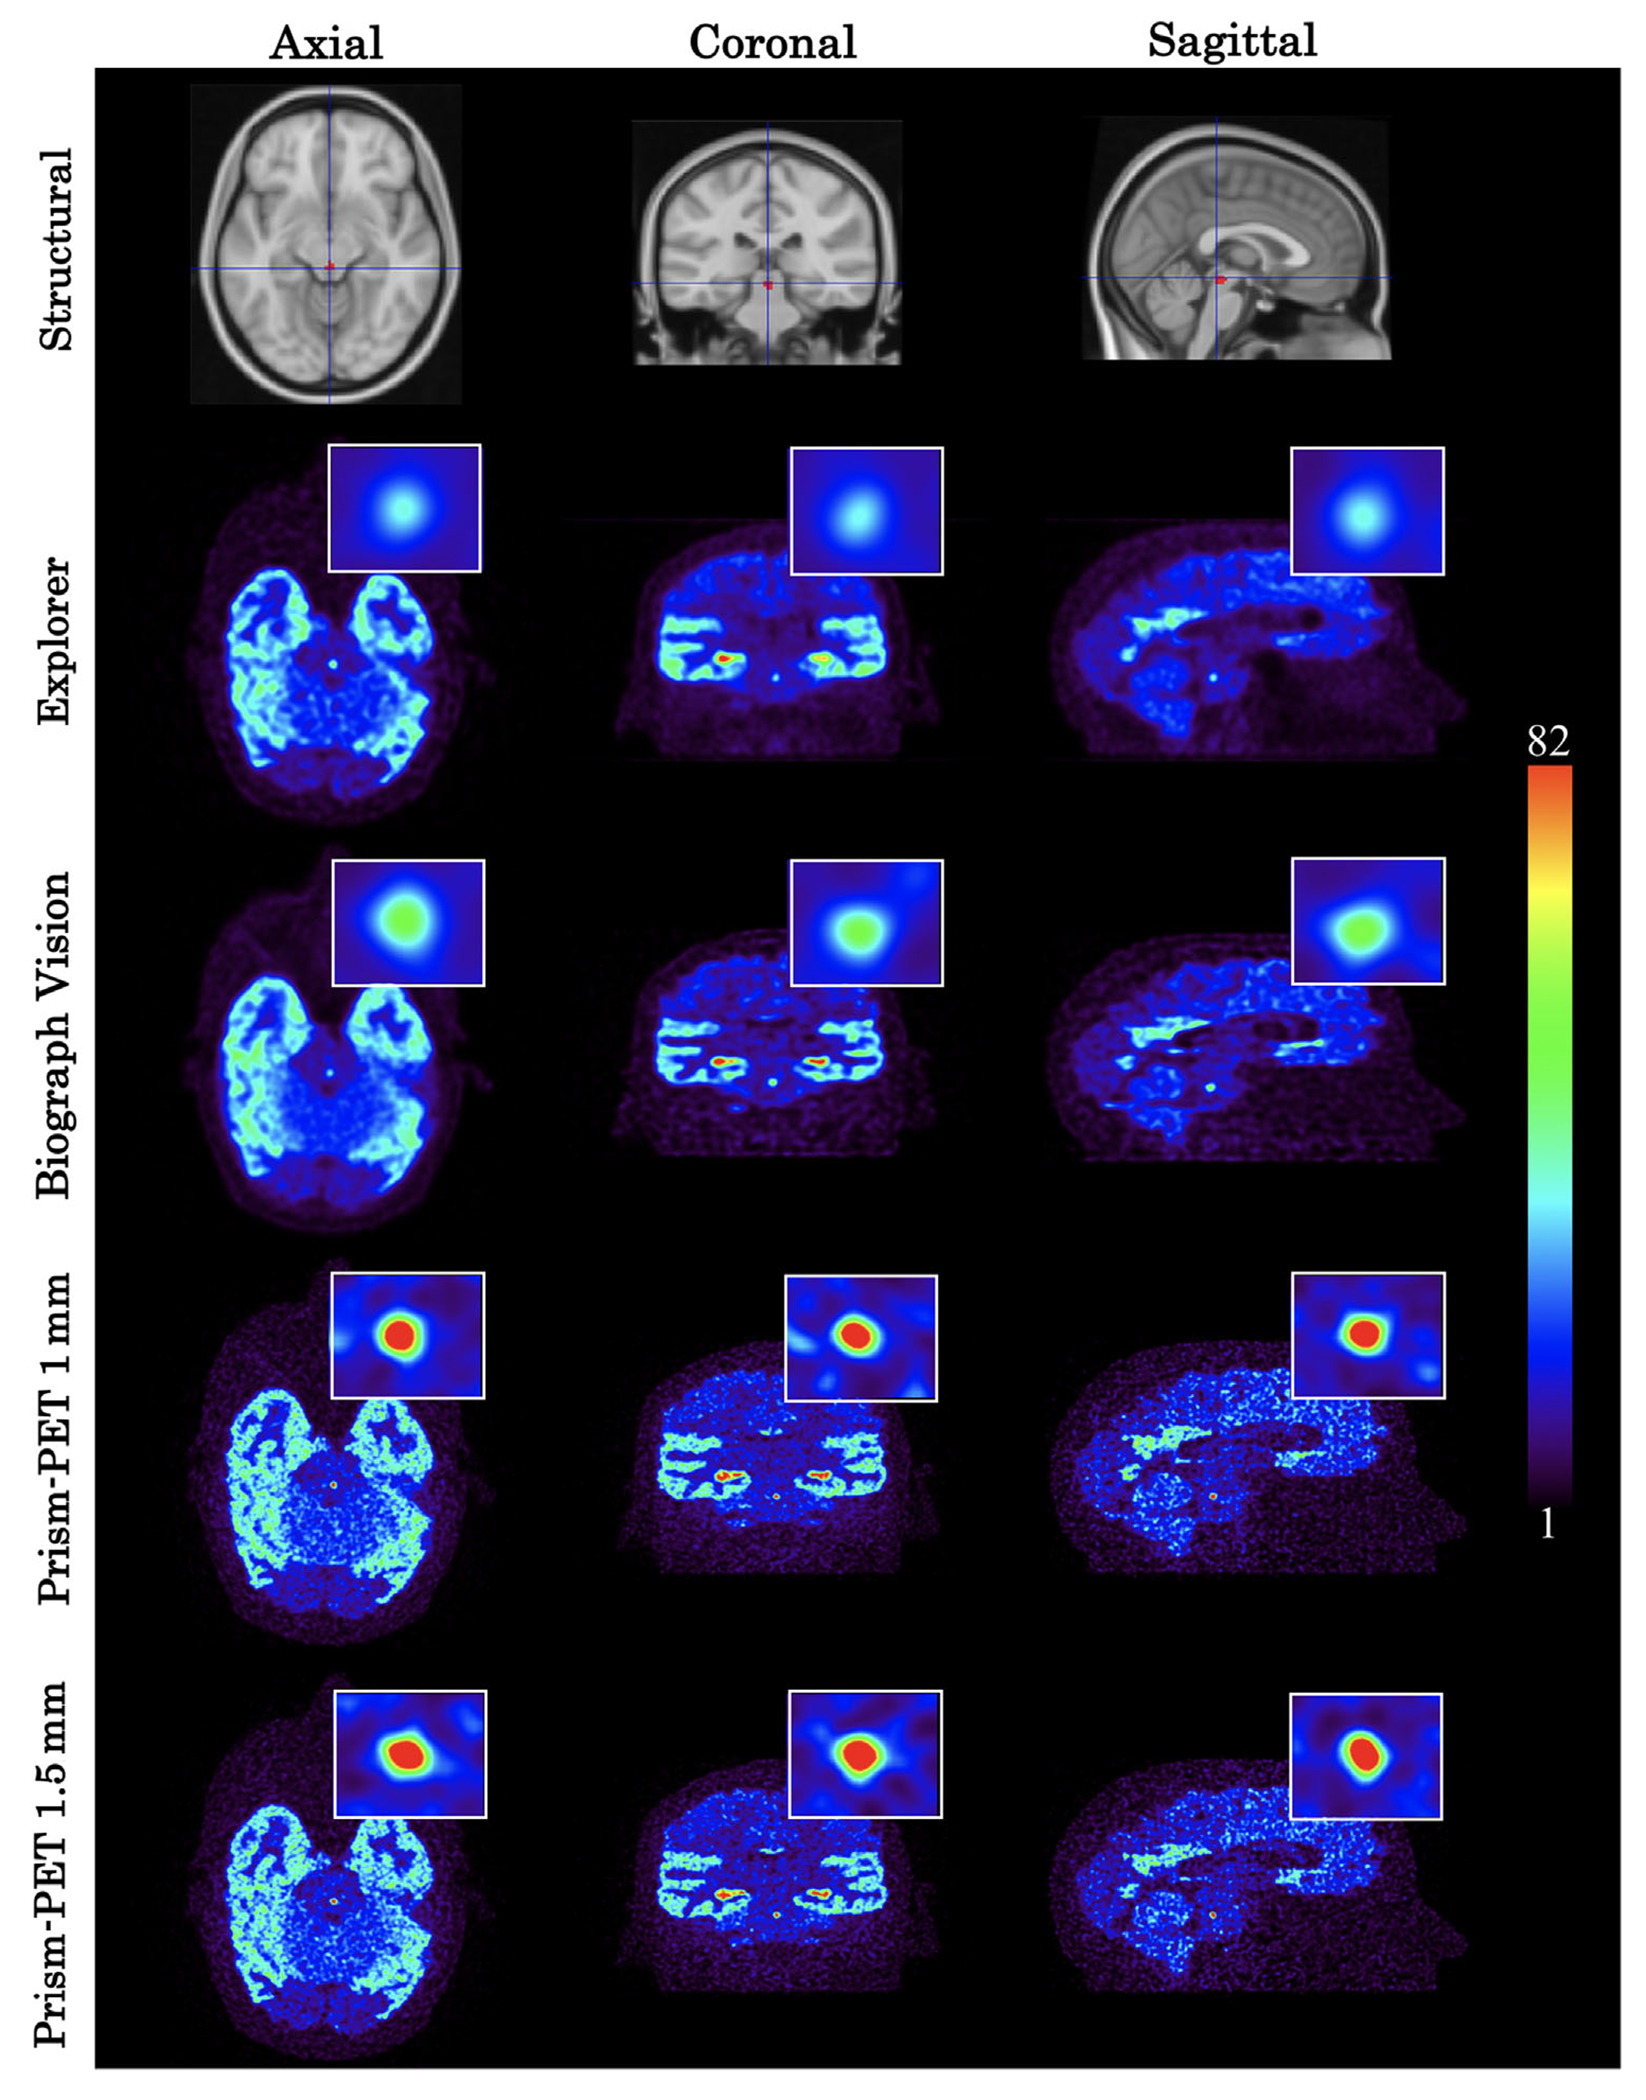
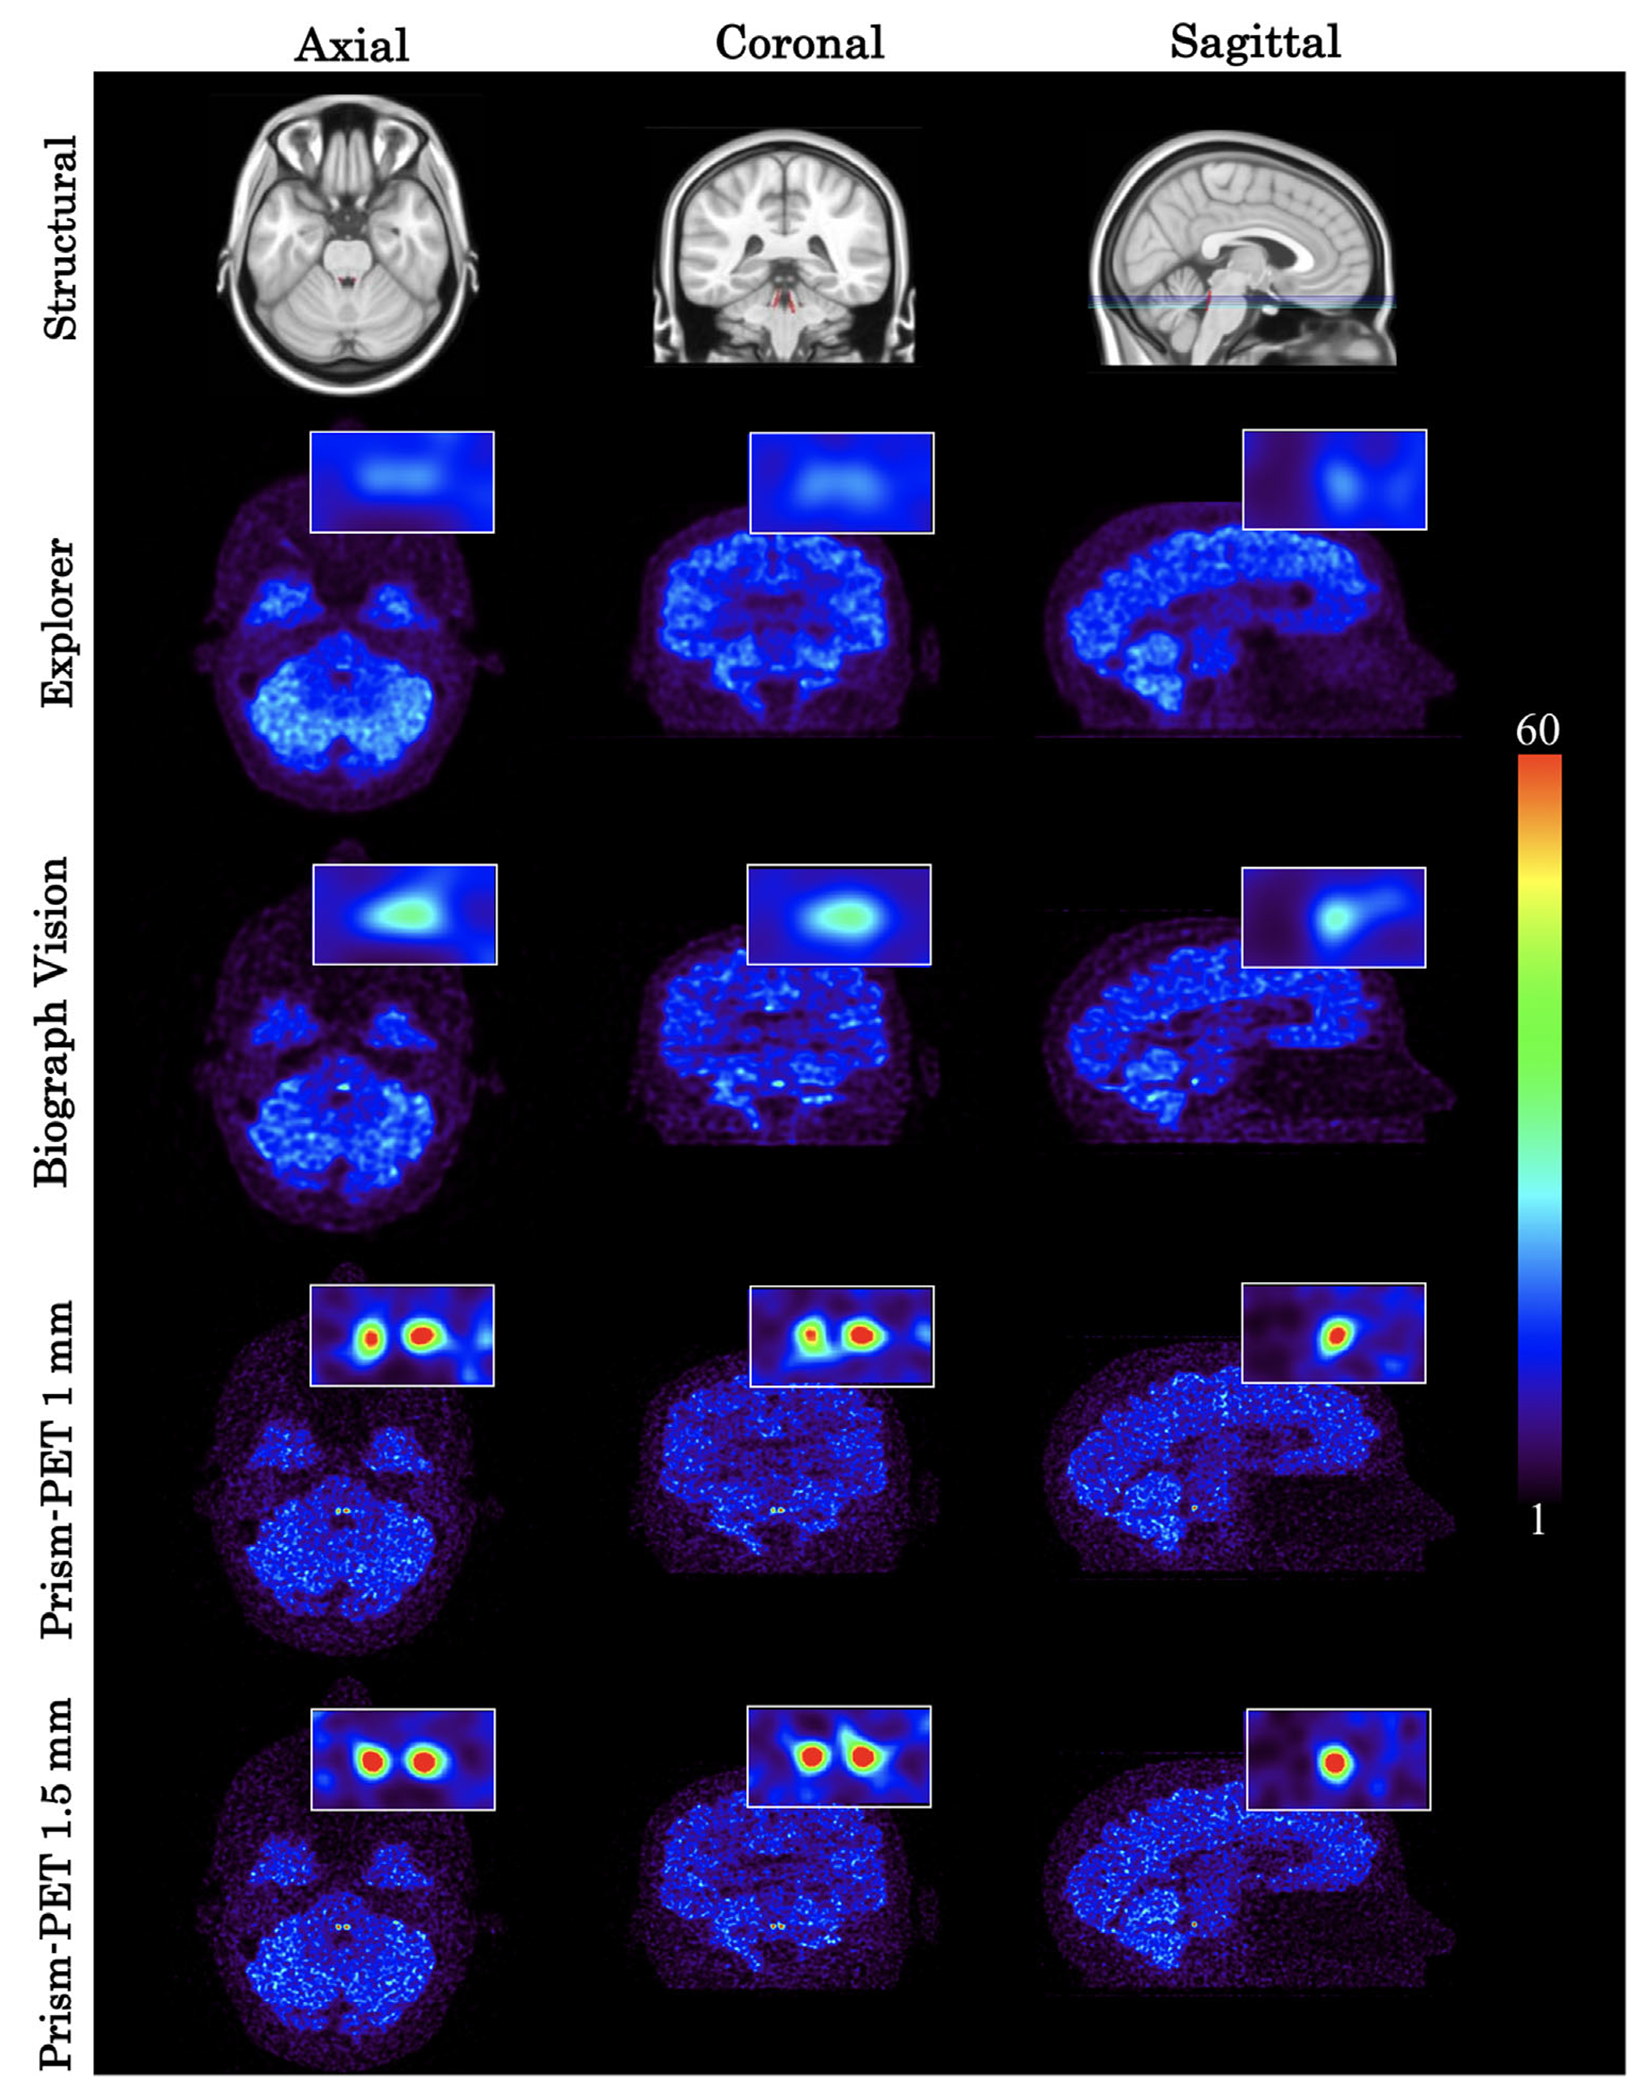
Methods: Two Prism-PET brain scanner setups were proposed based on our 4-to-1 and 9-to-1 coupling of scintillators to readout pixels using mm3 and mm3 crystal columns, respectively. Monte Carlo simulations of our Prism-PET scanners, Siemens Biograph Vision, and United Imaging EXPLORER were performed using Geant4 application for tomographic emission (GATE). National Electrical Manufacturers Association (NEMA) standard was followed for the evaluation of spatial resolution, sensitivity, and count-rate performance. An ultra-micro hot spot phantom was simulated for assessing image quality. A modified Zubal brain phantom was utilized for radiotracer imaging simulations of 5-HT1A receptors, which are abundant in the raphe nuclei (RN), and norepinephrine transporters, which are highly concentrated in the bilateral locus coeruleus (LC).
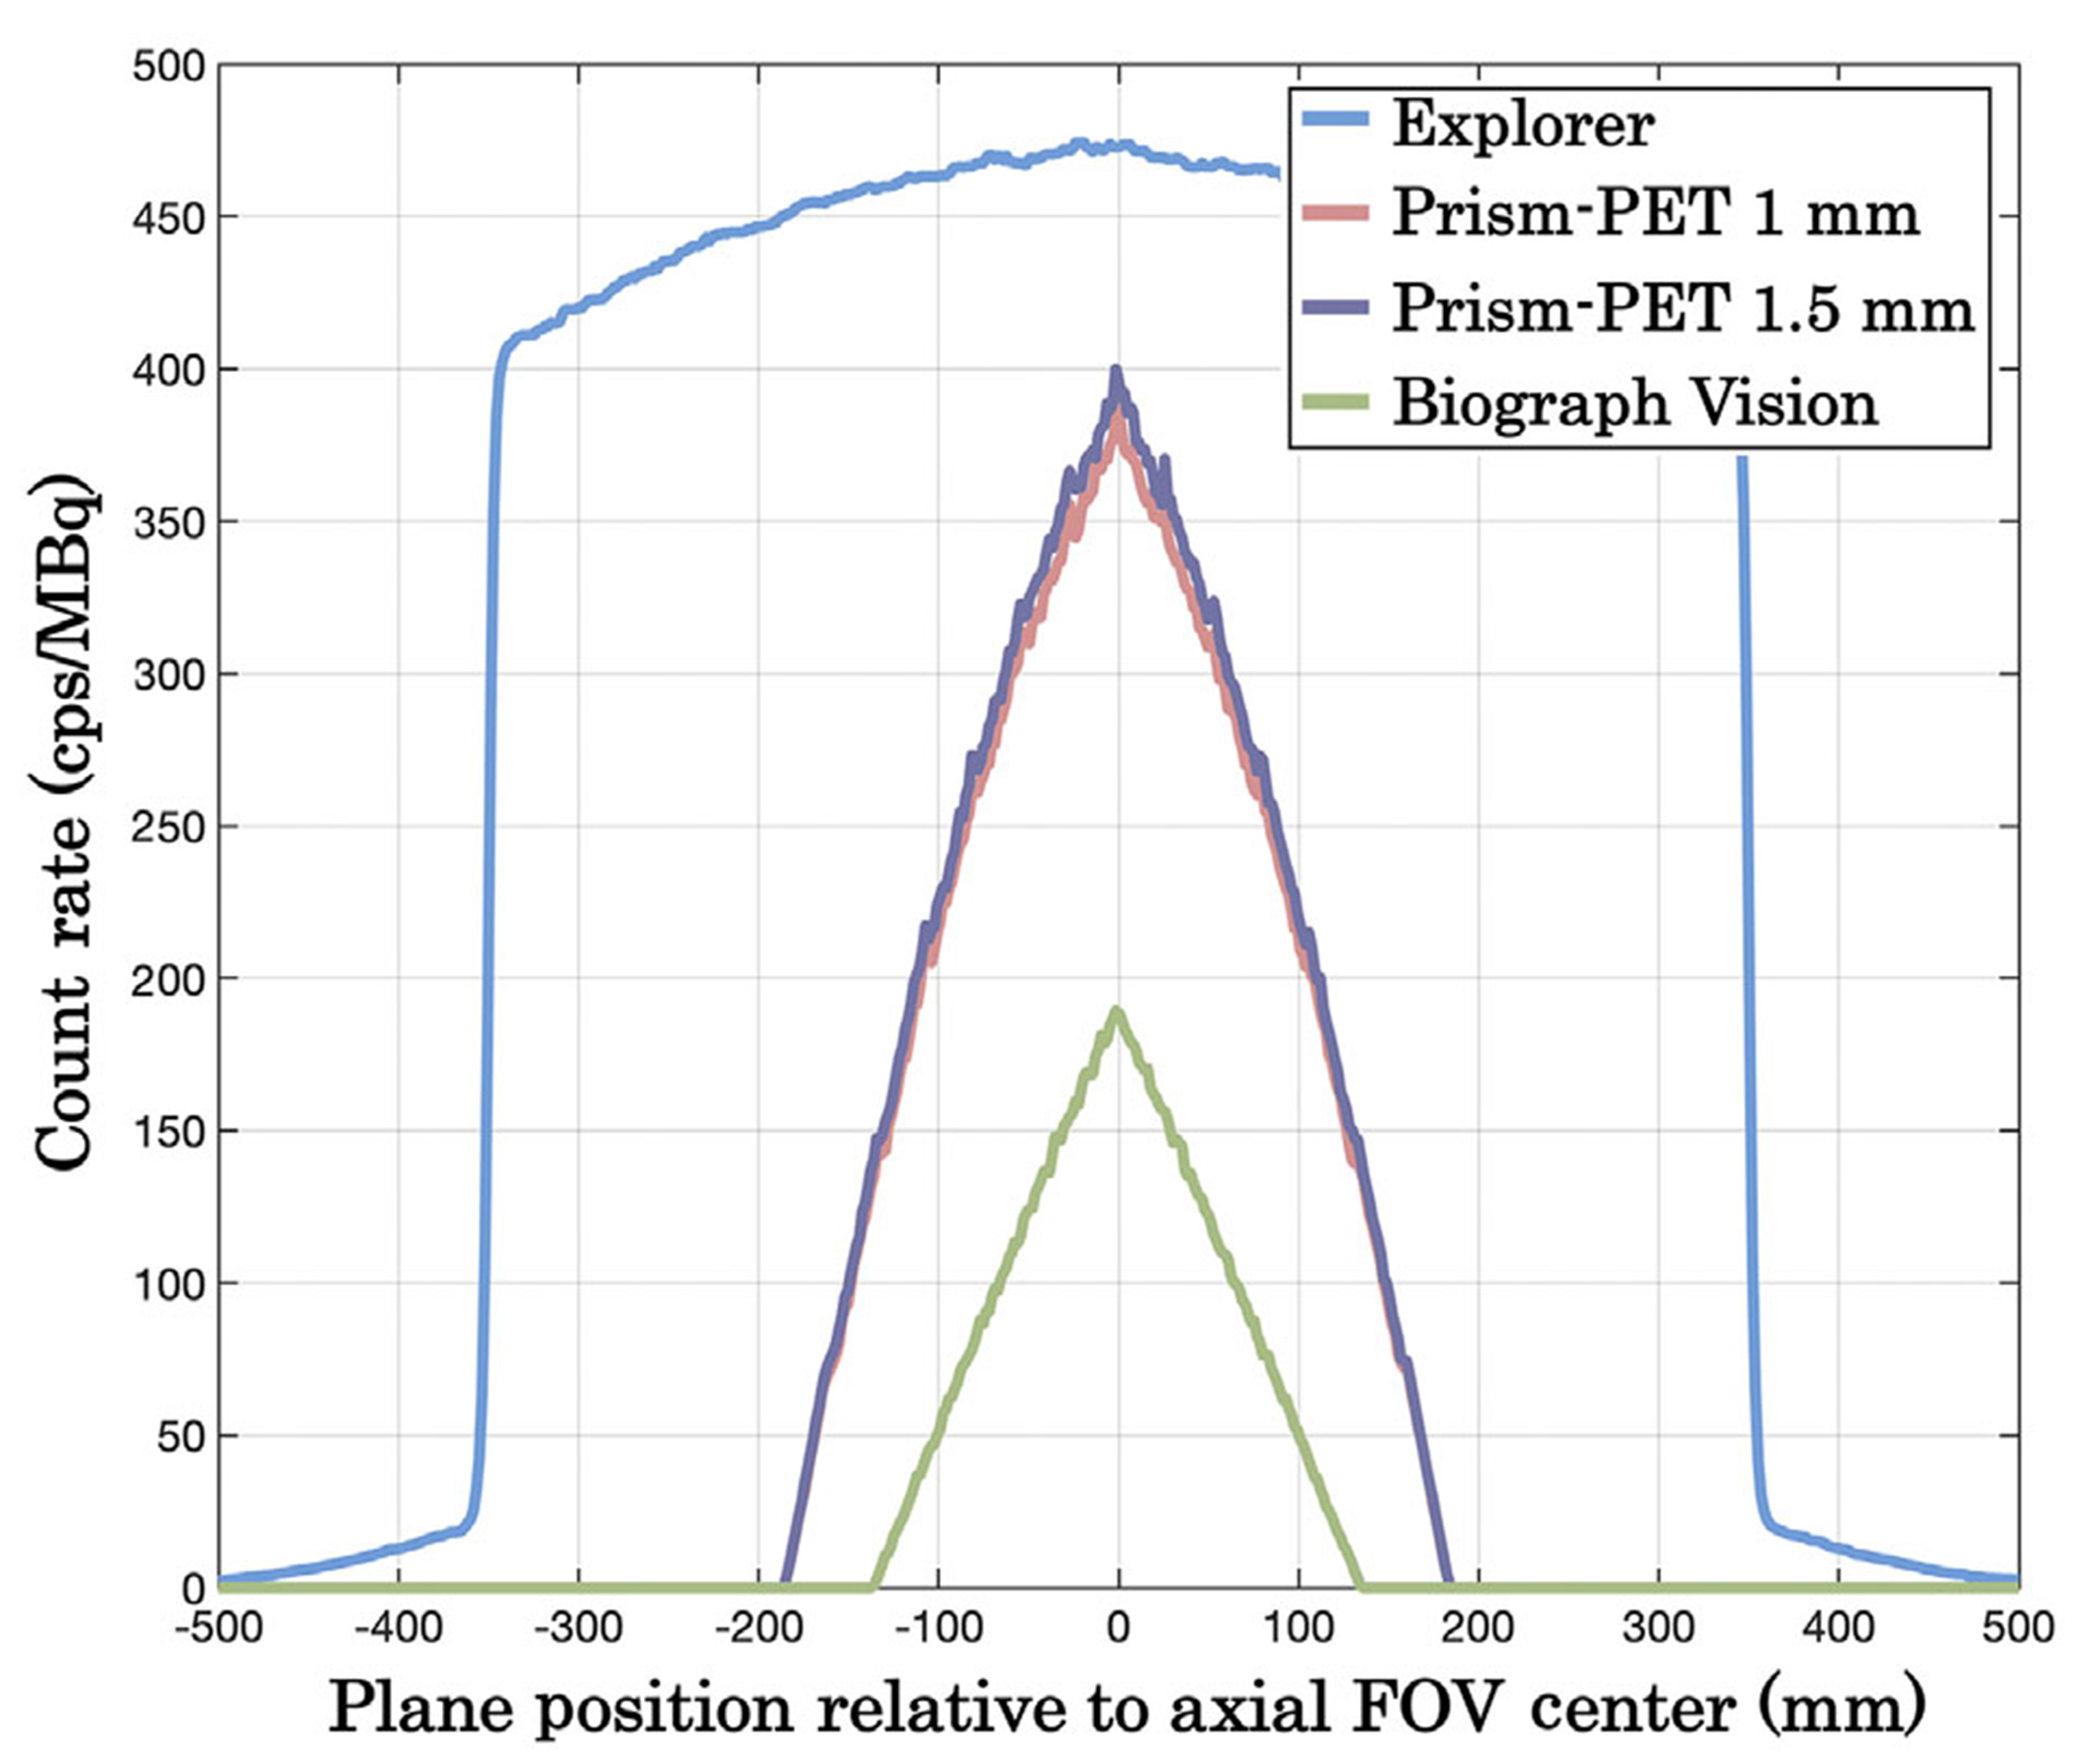
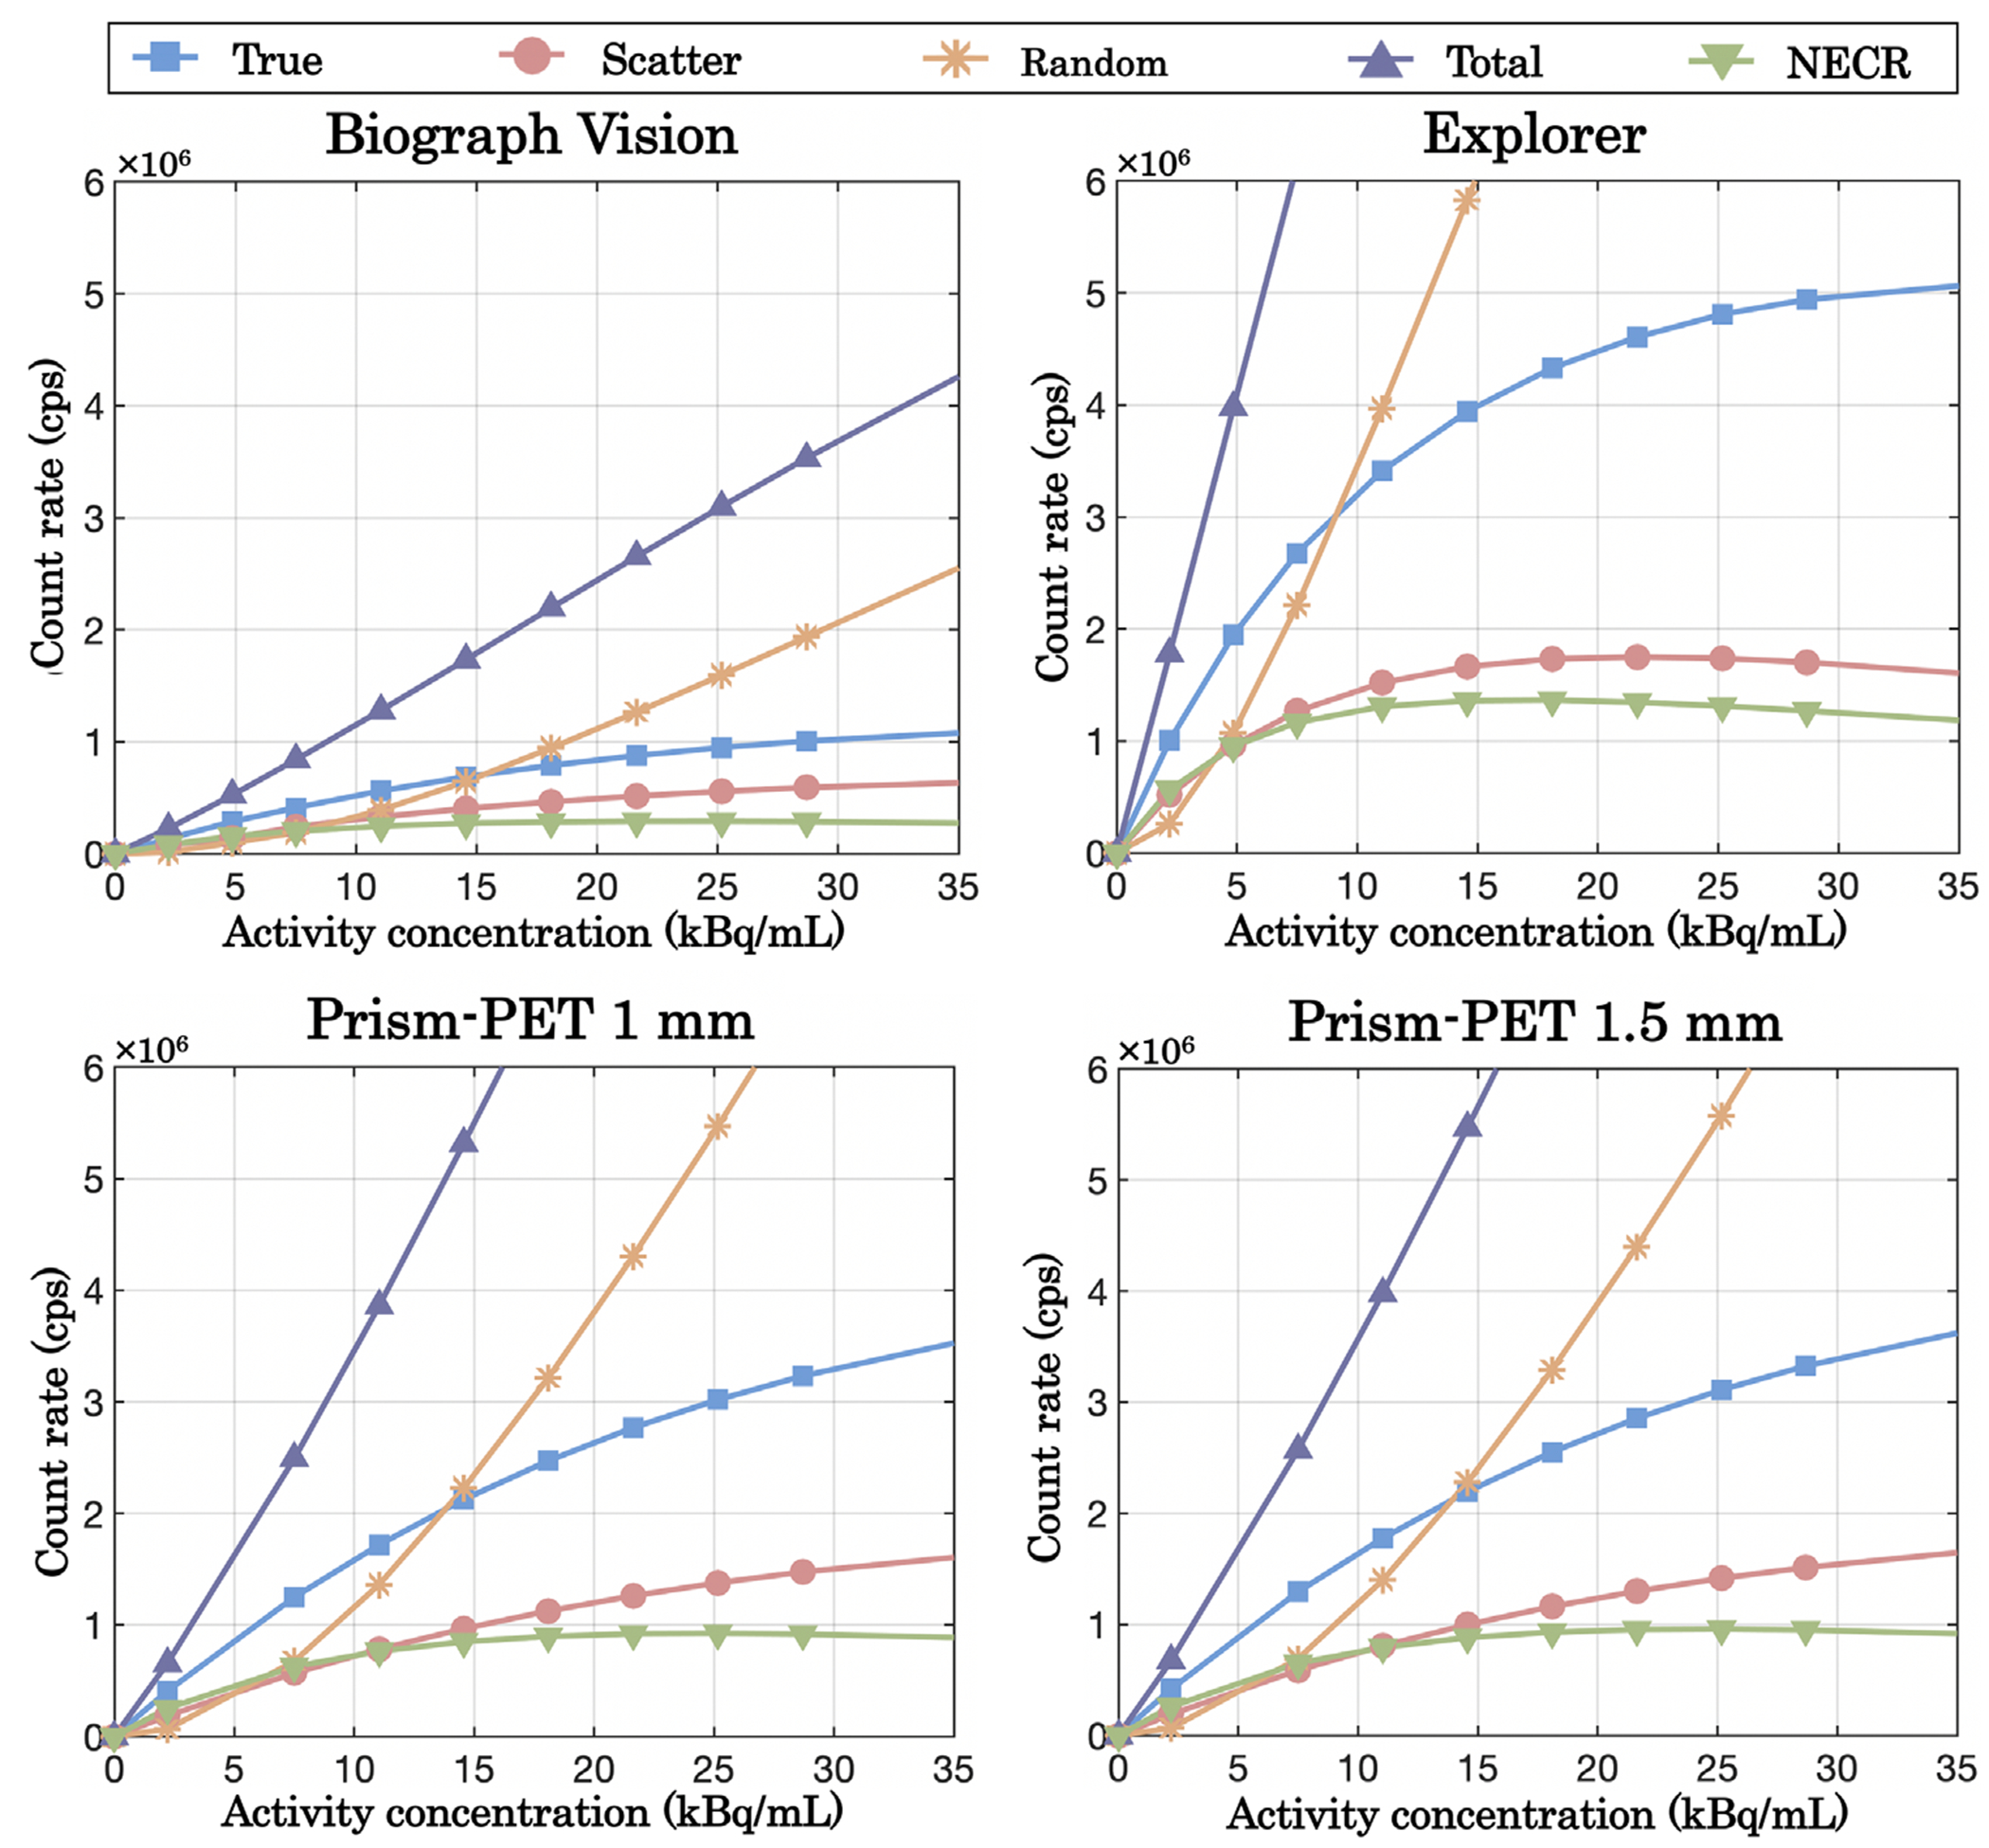
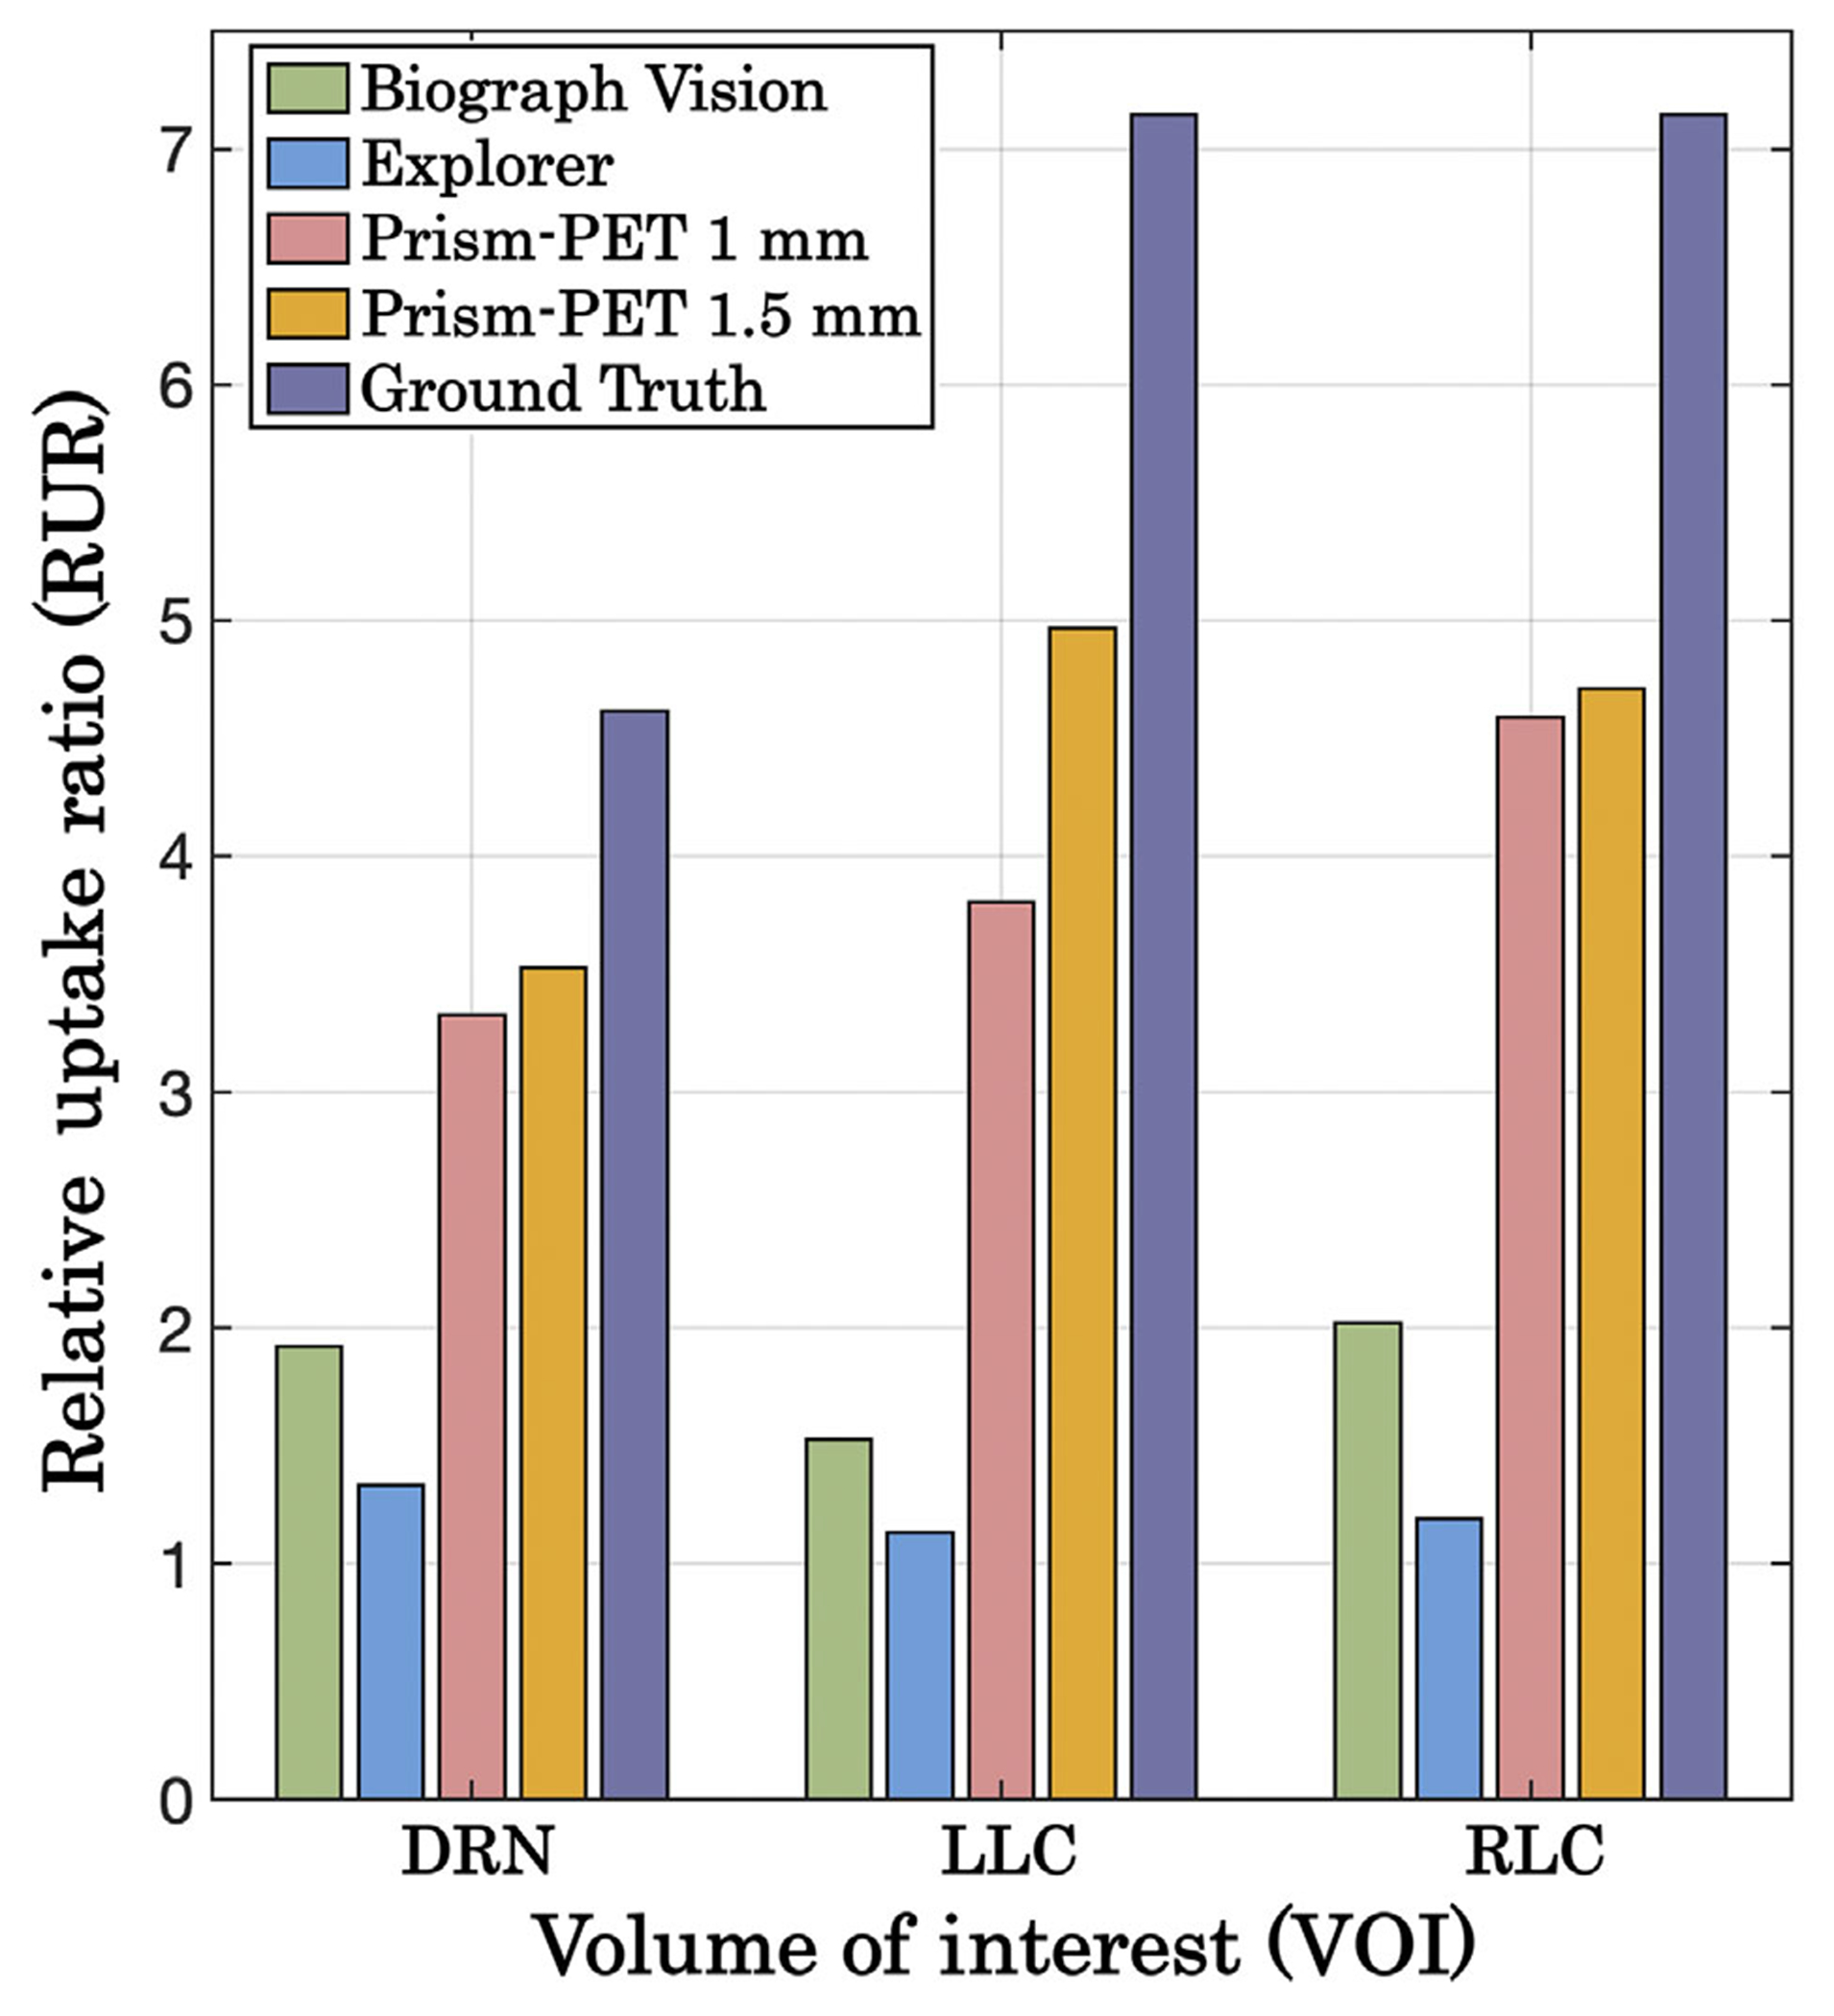
Results: The Prism-PET brain scanner with 1.5 mm crystals is superior to that with 1 mm crystals as the former offers better depth-of-interaction (DOI) resolution, which is key to realizing compact and conformal PET scanner geometries. We achieved uniform 1.3 mm full-width-at-half-maximum (FWHM) spatial resolutions across the entire transaxial field-of-view (FOV), a NEMA sensitivity of 52.1 kcps/MBq, and a peak noise equivalent count rate (NECR) of 957.8 kcps at 25.2 kBq/mL using 450-650 keV energy window. Hot spot phantom results demonstrate that our scanner can resolve regions as small as 1.35 mm in diameter at both center and 10 cm away from the center of the transaixal FOV. Both 5-HT1A receptor and norepinephrine transporter brain simulations prove that our Prism-PET scanner enables accurate quantification of radiotracer uptake in small brain regions, with a 1.8-fold and 2.6-fold improvement in the dorsal RN as well as a 3.2-fold and 4.4-fold improvement in the bilateral LC compared to the Biograph Vision and EXPLORER, respectively.
Conclusions: Based on our simulation results, the proposed high-resolution and high-sensitivity Prism-PET brain scanner is a promising cost-effective candidate to achieve quantitative molecular neuroimaging of small but important brain regions with PET clinically viable.
Keywords: Prism-PET; depth-of-interaction; high sensitivity; high spatial resolution; monoaminergic nuclei; positron emission tomography; quantitative molecular imaging; time-of-flight.
© 2022 American Association of Physicists in Medicine.
Conflict of interest statement
CONFLICT OF INTEREST
The authors have declared no conflict of interest.
Figures
References
-
- Laruelle M. Imaging synaptic neurotransmission with in vivo binding competition techniques: a critical review. J Cereb Blood Flow Metab. 2000;20:423–451. - PubMed
-
- Farde L, Hall H, Ehrin E, Sedvall G. Quantitative analysis of D2 dopamine receptor binding in the living human brain by PET. Science. 1986;231:258–261. - PubMed
