. 2022 May 5;109(5):909-927.
doi: 10.1016/j.ajhg.2022.03.010. Epub 2022 Apr 6.

Recessive PRDM13 mutations cause fatal perinatal brainstem dysfunction with cerebellar hypoplasia and disrupt Purkinje cell differentiation

Affiliations

Recessive PRDM13 mutations cause fatal perinatal brainstem dysfunction with cerebellar hypoplasia and disrupt Purkinje cell differentiation

Marion Coolen et al. Am J Hum Genet. .

Abstract

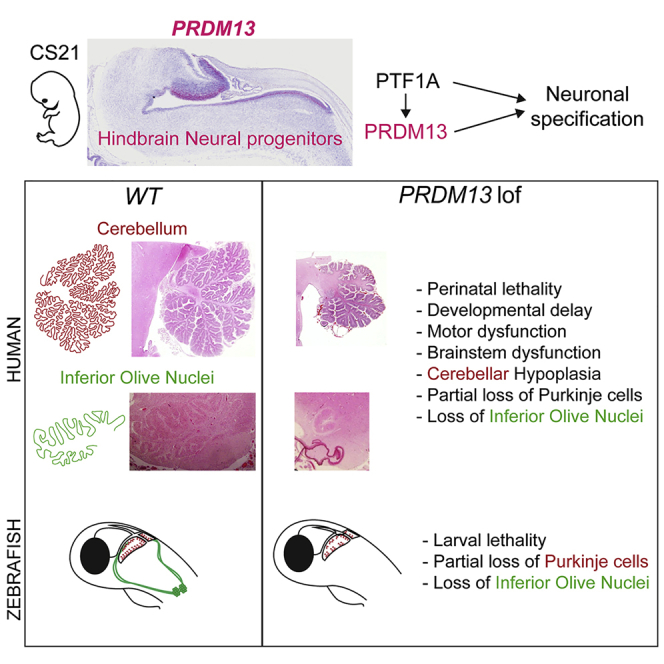
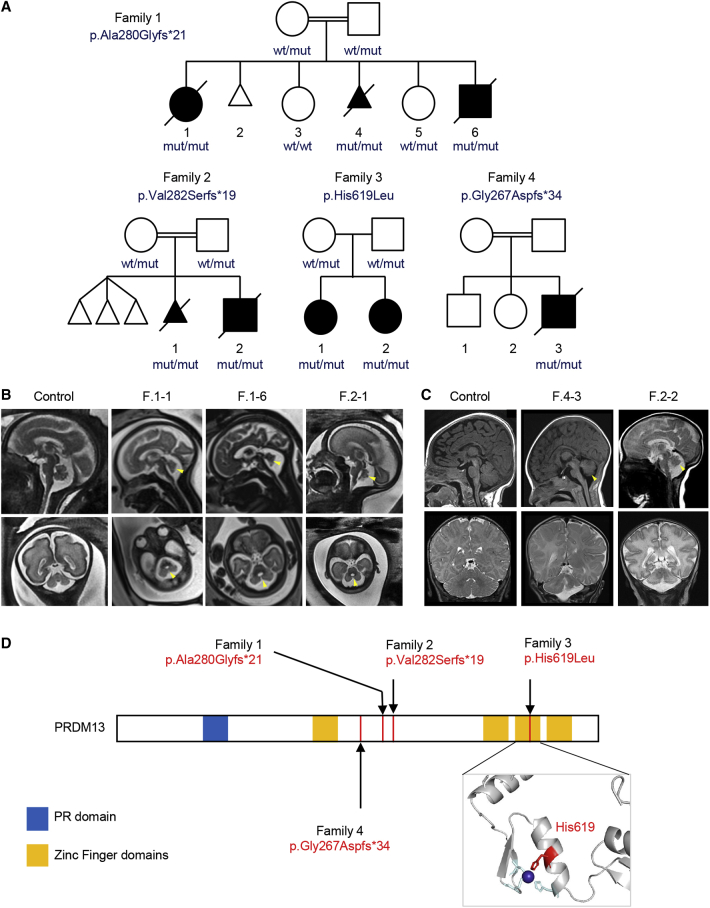
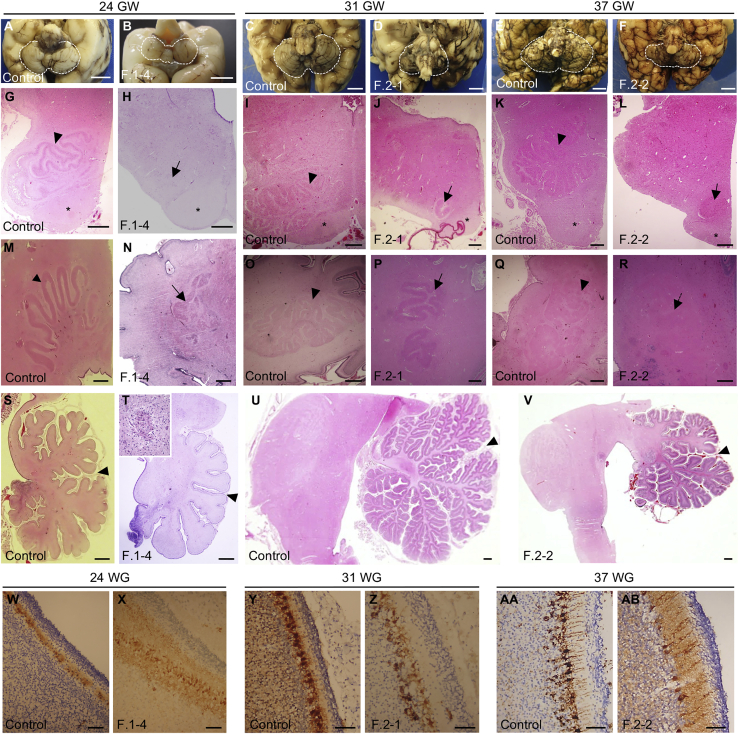
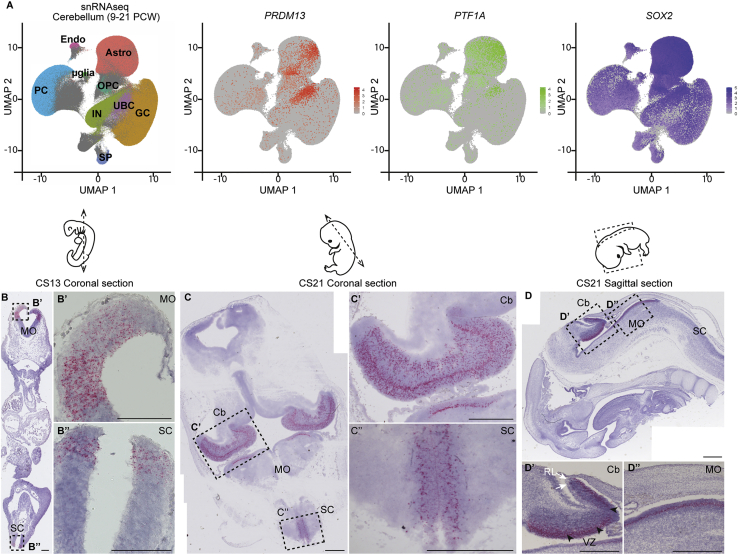
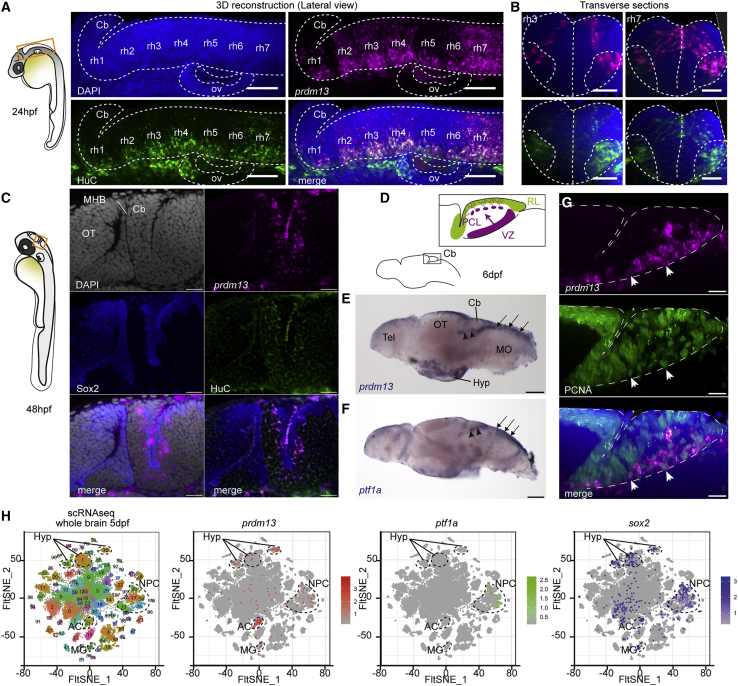
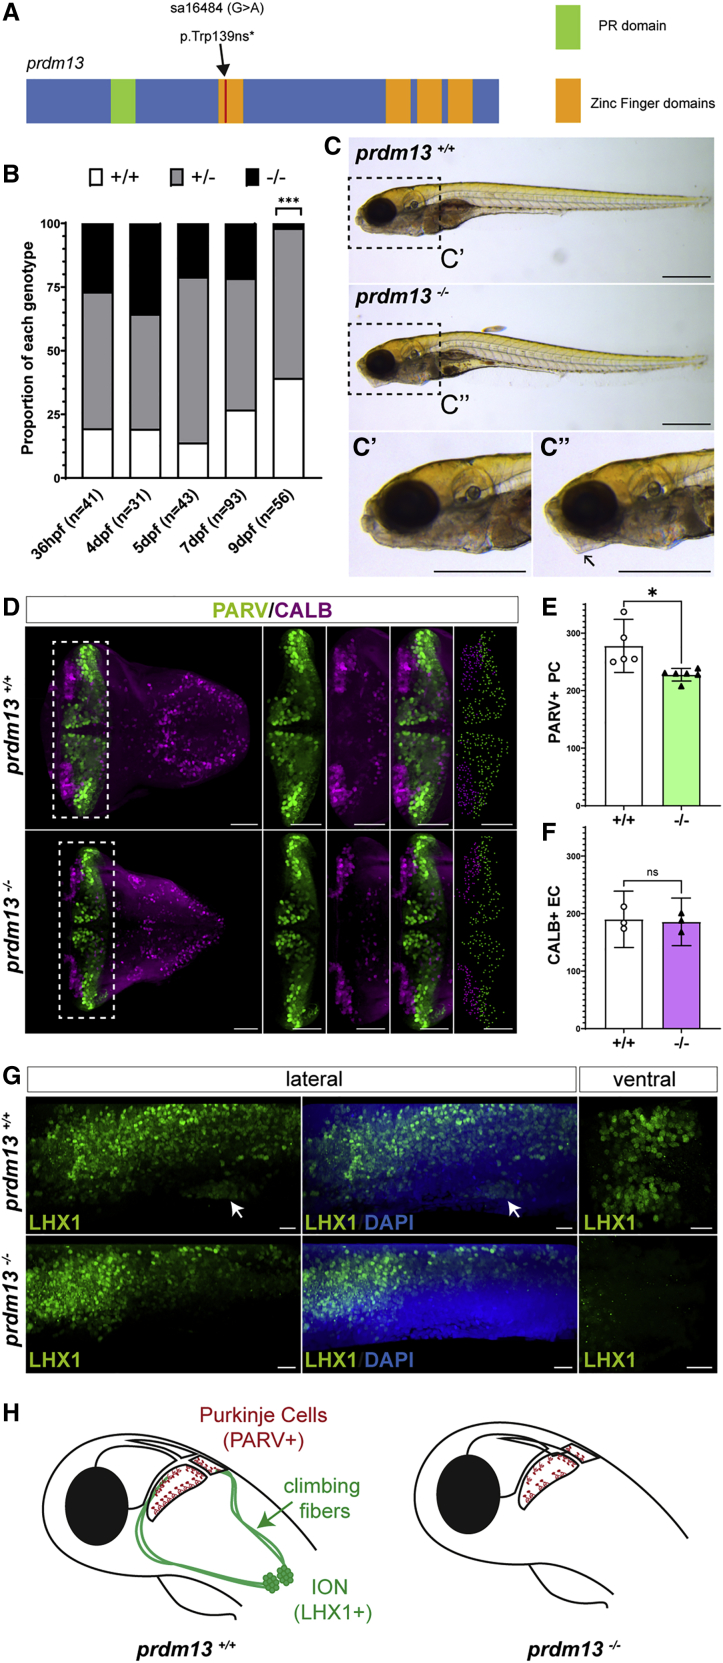
Pontocerebellar hypoplasias (PCHs) are congenital disorders characterized by hypoplasia or early atrophy of the cerebellum and brainstem, leading to a very limited motor and cognitive development. Although over 20 genes have been shown to be mutated in PCHs, a large proportion of affected individuals remains undiagnosed. We describe four families with children presenting with severe neonatal brainstem dysfunction and pronounced deficits in cognitive and motor development associated with four different bi-allelic mutations in PRDM13, including homozygous truncating variants in the most severely affected individuals. Brain MRI and fetopathological examination revealed a PCH-like phenotype, associated with major hypoplasia of inferior olive nuclei and dysplasia of the dentate nucleus. Notably, histopathological examinations highlighted a sparse and disorganized Purkinje cell layer in the cerebellum. PRDM13 encodes a transcriptional repressor known to be critical for neuronal subtypes specification in the mouse retina and spinal cord but had not been implicated, so far, in hindbrain development. snRNA-seq data mining and in situ hybridization in humans show that PRDM13 is expressed at early stages in the progenitors of the cerebellar ventricular zone, which gives rise to cerebellar GABAergic neurons, including Purkinje cells. We also show that loss of function of prdm13 in zebrafish leads to a reduction in Purkinje cells numbers and a complete absence of the inferior olive nuclei. Altogether our data identified bi-allelic mutations in PRDM13 as causing a olivopontocerebellar hypoplasia syndrome and suggest that early deregulations of the transcriptional control of neuronal fate specification could contribute to a significant number of cases.

Keywords: PRDM13; Purkinje cells; brainstem; cerebellum; inferior olive nuclei; neurodevelopment; neuronal specification; olivopontocerebellar hypoplasia; zebrafish.


Conflict of interest statement

Declaration of interests The authors declare no competing interests.

Figures

None
Graphical abstract
Figure 1
Figure 1
Bi-allelic mutations in PRDM13 in affected children and fetuses with posterior fossa anomalies (A) Families with predicted effect of PRDM13 variants and pedigrees. All pathogenic variants are homozygous in affected individuals and segregated as recessive traits. (B) T2-weighted fetal magnetic resonance images of control individual at 26 WG and affected individuals F.2-1, F.1-1, and F.1-6 at 26 WG, 30 WG, and 33 WG, respectively. Sagittal views are shown on top, and the bottom parts show coronal views for the control individual, F.2-1, and F.1-6 and axial views for F.1-1. The imaging shows reduced cerebellar vermis volume (yellow arrowhead) with abnormal or incomplete foliation and mild tapering of medulla oblongata for F.1-6. (C) Sagittal T1-weighted (top, for control individual and F.4-3), Sagittal T2-weighted (top, for F.2-2), and coronal T2-weighted (bottom) brain magnetic resonance images of control individual and individuals F.4-3 and F.2-2. For both children, a small and dysmorphic vermis is visible on the sagittal slices and small hemispheres are detected on coronal views. (D) Identified PRDM13 mutations. Bottom-right, modeling of the third zinc finger domain based on ZFP568 structure (PDB: 5V3J). The mutated histidine residue (in red) is part of the Cys2-His2-binding motif. Blue, zinc ion.
Figure 2
Figure 2
Neuropathological examination of the fetuses F.1-4 and F.2-1 and child F.2-2 (A–F) Posterior view (B) and basal view (A and C–F) of the brain showing cerebellar hypoplasia in affected individuals compared to stage-matched control individuals. Scale bar: 10 mm. Cerebella are outlined with white dashed lines. (B) An incomplete covering of the 4th ventricle by the vermis is visible for the fetus F.1-4. (G–L) Cross sections of the medulla stained with hematoxylin and eosin (HE) showing a fragmentation or extreme hypoplasia (arrows) of the olivary nuclei in affected individuals. Pyramidal tracts are clearly visible () and inferior olivary nuclei are noted (arrowhead) in control individuals. Scale bar: 500 μm. (M–R) Horizontal (M) and sagittal (N–R) HE-stained sections showing a dysplasia and fragmentation of the dentate nucleus (arrows) in affected individuals. Arrowheads in control individuals point to the dentate nucleus. Scale bar: 500 μm. (S–V) Sagittal HE-stained sections at the level of the vermis showing delayed lobulation with absence of tertiary foliation in the cerebellum of F.2-2 and hypoplasia severely affecting the anterior vermis (T and V). Primary fissures are indicated with arrowheads. Scale bar: 1 mm. Purkinje cell cluster heterotopia are visible in the white matter (T, top-left magnification). (W–AB) Immunostaining of Purkinje cells with calbindin showing a decreased number and delayed maturation of Purkinje cells in the cerebellar cortex of affected individuals. Scale bar: 50 μm
Figure 3
Figure 3
PRDM13 expression in neural progenitors in the developing cerebellum and brainstem (A) Single-nucleus RNA-seq (snRNA-seq) data from human fetal cerebellum (9–21 PCW). snRNA-seq datasets were retrieved from the Human Gene Expression During Development Atlas (Descartes, https://descartes.brotmanbaty.org) and analyzed with the Seurat package. Cells are visualized on uniform manifold approximation and projection (UMAP) plots. In the first panel, cells are color-coded according to cell annotations from the Descartes Atlas (PCs, Purkinje cells; UBCs, unipolar brush cells; GCs, granule cells; INs, interneurons; Astros, Astrocytes; OPCs, oligodendrocytes precursors; μglia, microglia; SPs, SLC24A4_PEX5L_positive cells; Endos, vascular endothelial cells). In the three other panels, cells are colored in graded intensities, reflecting the expression levels of PRDM13, PTF1A, and SOX2. (B–D) Detection of PRDM13 transcripts (red) by RNAscope in situ hybridization on coronal (B and C) or sagittal (D) sections through human embryos at Carnegie stage 13 (B) and 21 (C and D). (B′) and (B″), (C′) and (C″), (D′) and (D′) are higher magnifications of the regions outlined by dotted squares in (B), (C), and (D), respectively. At CS13, specific expression of PRDM13 is detected in the dorsal VZ of the caudal part of the hindbrain (Hb, B′) and in the dorsal VZ of the caudal neural tube (NT, B″). At CS21, PRDM13 starts to be expressed in the primordium of the cerebellum (Cb, C, C′) while being maintained in the medulla oblongata (MO, C, D, D″) and spinal cord (SC, C, C″). In the cerebellum (D′), PRDM13 is more specifically detected in the ventricular zone (VZ, black arrowheads), while it is absent from the rhombic lip (RL, white arrows). Scale bars: 100 μm (B) and 500 μm (C and D).
Figure 4
Figure 4
prdm13 expression during zebrafish hindbrain development (A) Lateral view of a 3D reconstruction of the zebrafish hindbrain at 24 hpf showing the expression of prdm13 (ISH, magenta) with a whole-mount immunostaining for the neuronal marker HuC (green). Cell nuclei are counterstained with DAPI (blue). A dotted line contours the hindbrain region. Cb, cerebellum; rh1–7, rhombomere 1–7; ov, otic vesicle. Scale bar: 50 μm. (B) Transverse section through the 3D reconstruction shown in (A) at the level of rhombomere 3 (left panel) and rhombomere 7 (right panel). Scale bar: 50 μm. (C) Optical z-plane showing prdm13 expression (magenta) together with an immunostaining for Sox2 (blue) and HuC (green) in the cerebellum at 48 hpf. Cell nuclei are counterstained with DAPI (gray). At this stage, prdm13 starts to be expressed in the cerebellar primordium, corresponding to the dorsal part of the first rhombomere, adjacent to the midbrain-hindbrain boundary (MHB). OT, optic tectum. Scale bar: 20 μm. (D) Schematic representation of the larval zebrafish brain at 6 days post fertilization (dpf), with a magnification on the larval cerebellum. Like in mammals, the zebrafish cerebellum develops from two distinct neurogenic progenitor pools: the rhombic lip (RL, green) and the ventricular zone (VZ, purple). The VZ gives rise to all the GABAergic neuronal populations, including Purkinje neurons, which migrate and align to form the Purkinje cell layer (PCL). (E and F) Whole-mount ISH on zebrafish larval brains at 6 dpf showing the expression of prdm13 (E) and ptf1a (F) in blue. Note the expression of prdm13 and ptf1a in the cerebellar VZ (black arrowheads) and dorsal hindbrain (black arrows). Cb, cerebellum; OT, optic tectum; Tel, telencephalon; Hyp, hypothalamus; MO: medulla oblongata. Scale bar: 100 μm. (G) Lateral view of a 3D reconstruction of the zebrafish cerebellum at 6 dpf showing the expression of prdm13 (ISH, magenta) with a whole-mount immunostaining for the proliferation marker PCNA (green). Cell nuclei are counterstained with DAPI (blue). Dotted lines outline the cerebellar primordium. prdm13 transcripts are detected in proliferating progenitors of the VZ (white arrowheads). Scale bar: 10 μm. (H) t-distributed stochastic neighbor embedding (t-SNE) projection plots of distinct single-cell populations obtained from the zebrafish brain at 5 dpf. The zebrafish single-cell RNA-seq (scRNA-seq) dataset was retrieved from the Gene Expression Omnibus (GEO) public database under accession GEO: GSE158142. In the first panel, cells are color-coded according to cluster annotations from the original publication. In the three other panels, cells are colored in graded intensities, reflecting the expression levels of prdm13, ptf1a, and sox2. Clusters in which prdm13 expression is enriched are circled with dotted lines. prdm13 expression is enriched in clusters 13, 25, 30, and 38, corresponding to neural progenitors (NPCs) that are also enriched for ptf1a and sox2. Expression of prdm13 is also detected in clusters 1, 34, and 35, which are annotated as hypothalamic clusters (Hyp); 21, which corresponds to amacrine cells (ACs); and 45, which correspond to Müller glia (MG).
Figure 5
Figure 5
Homozygous prdm13 disruption causes reduction in Purkinje neurons numbers and loss of inferior olive nucleus neurons in zebrafish (A) Zebrafish mutant allele sa16484. The mutant allele is a nonsense single-nucleotide mutation, leading to a truncation of the protein at the level of the first Zn finger domain. (B) Proportion of embryos of each genotype inside the progeny of a cross between two heterozygous fish from the prdm13sa16484 line at different stages. The number of embryos genotyped per stage is indicated underneath each bar. At 9 dpf, the proportions differ significantly from the expected ratios (Chi-square test; p = 0.0002). (C) Photographs of wild-type and homozygous mutant larvae from the prdm13sa16484 line at 7 dpf. (C′) and (C″) are higher magnification of the head regions of a wild-type (C′) and homozygous mutant (C″) larva. Homozygous prdm13 mutant larvae display an abnormal body curvature and lower jaw morphology (arrow in C″). Scale bar: 500 μm. (D) 3D reconstructions of the hindbrain in dorsal view from a wild-type (top panels) and a homozygous mutant (bottom panels) larva at 6 dpf. Larval brains were immunostained for parvalbumin (PARV, green), a marker of Purkinje cells (PCs), and calbindin (CALB, magenta), a marker of some eurydendroid cells (ECs). The panels on the right show a higher magnification of the cerebellum; the last ones show the distribution of PCs (green) and ECs (magenta), as determined by 3D-image segmentation of the cerebellar region. Scale bar: 50 μm, (E and F) Total number of PARV+ PCs (E) and CALB+ ECs (F) in wild-type and mutant prdm13 larvae. Data are presented as mean ± 95% confidence interval. The number of PCs is significantly reduced in mutant larvae (n = 5 (prdm13+/+) and n = 6 (prdm13−/−); unpaired t test p = 0.011), while no significant changes in EC numbers are observed (n = 3 (prdm13−/−) and n = 3 (prdm13+/+); unpaired t test p = 0.7854). (G) Representative images of 3D reconstructions of the hindbrain from a wild-type (top panels) and a homozygous mutant (bottom panels) larva at 7 dpf. Larval brains were immunostained for LHX1 (green), which labels inferior olivary nucleus projection neurons (white arrow). The left and middle panels are lateral views and the right panels are ventral views centered on the inferior olivary nuclei (IONs). Note the absence of ION neurons in mutant larvae (four larvae were immunostained for each genotype). Scale bar: 20 μm. (H) Schematic representation of the phenotype of prdm13 mutant larvae, which present a reduction in the number of Purkinje cells (red) and an absence of ION projection neurons (green), which normally send climbing fibers onto PCs.

References

    1. Accogli A., Addour-Boudrahem N., Srour M. Diagnostic Approach to Cerebellar Hypoplasia. Cerebellum. 2021;20:631–658. - PubMed
    1. Poretti A., Boltshauser E., Doherty D. Cerebellar hypoplasia: differential diagnosis and diagnostic approach. Am. J. Med. Genet. C. Semin. Med. Genet. 2014;166C:211–226. - PubMed
    1. Haldipur P., Millen K.J. What cerebellar malformations tell us about cerebellar development. Neurosci. Lett. 2019;688:14–25. - PMC - PubMed
    1. Aldinger K.A., Dempsey J.C., Tully H.M., Grout M.E., Mehaffey M.G., Dobyns W.B., Doherty D. Rhombencephalosynapsis: Fused cerebellum, confused geneticists. Am. J. Med. Genet. C. Semin. Med. Genet. 2018;178:432–439. - PMC - PubMed
    1. Ucuncu E., Rajamani K., Wilson M.S.C., Medina-Cano D., Altin N., David P., Barcia G., Lefort N., Banal C., Vasilache-Dangles M.T., et al. MINPP1 prevents intracellular accumulation of the chelator inositol hexakisphosphate and is mutated in Pontocerebellar Hypoplasia. Nat. Commun. 2020;11:6087. - PMC - PubMed

Publication types

Substances

Supplementary concepts