. 2022 Jun:28:100785.
doi: 10.1016/j.neo.2022.100785. Epub 2022 Apr 4.

Notch3 signaling between myeloma cells and osteocytes in the tumor niche promotes tumor growth and bone destruction

Affiliations

Notch3 signaling between myeloma cells and osteocytes in the tumor niche promotes tumor growth and bone destruction

Hayley M Sabol et al. Neoplasia. 2022 Jun.

Abstract

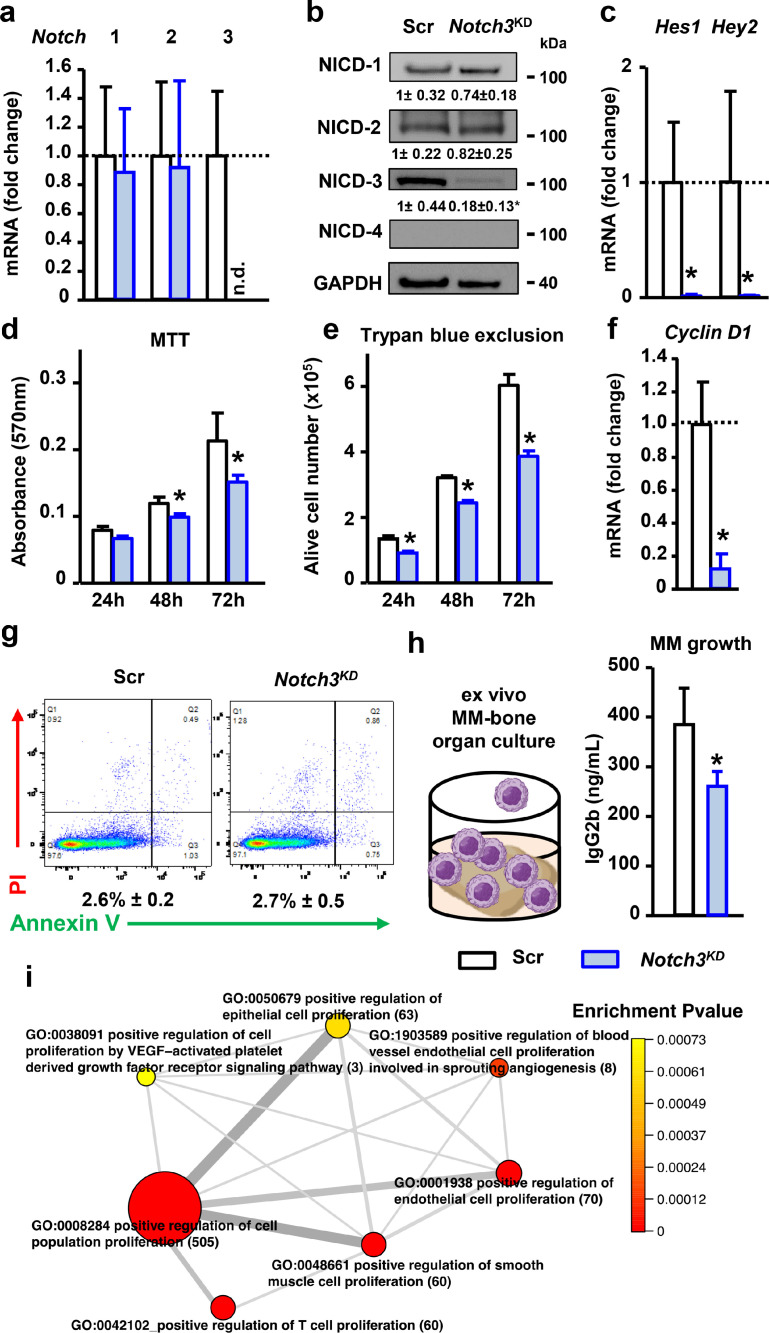
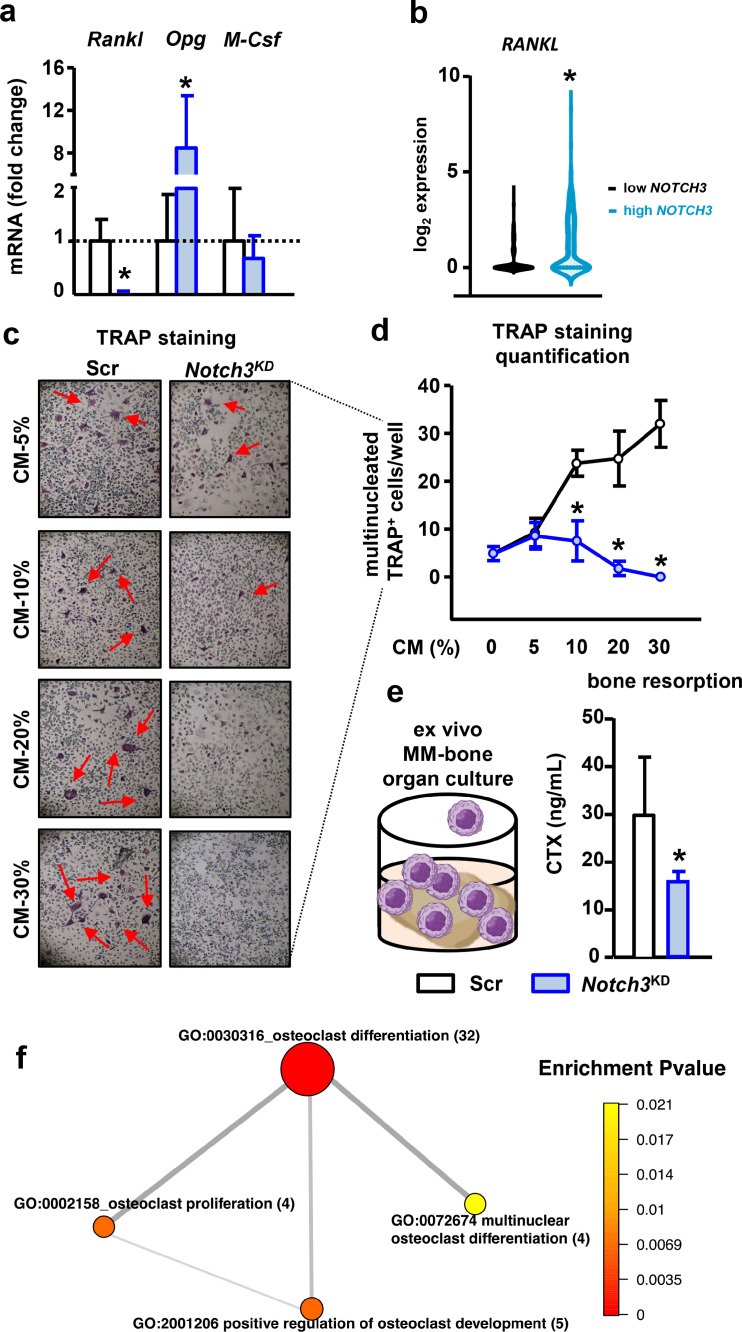
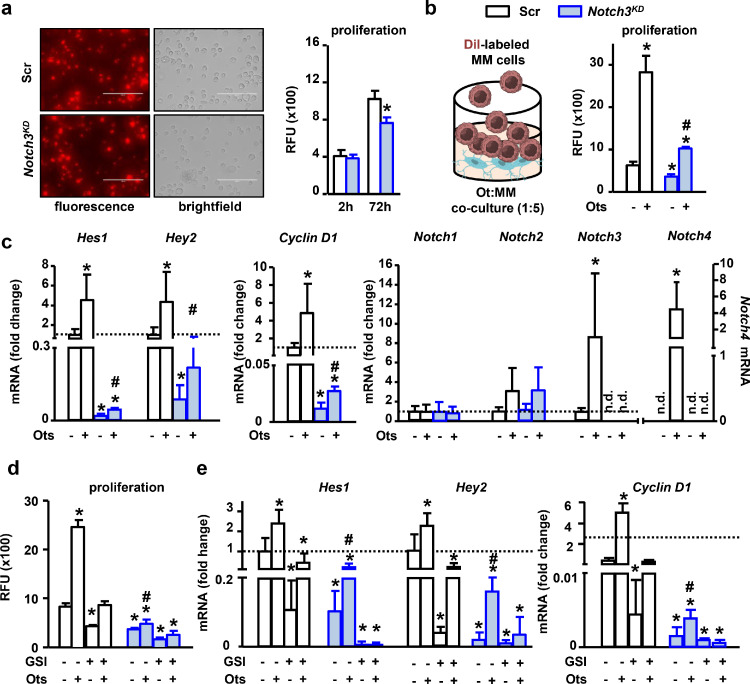
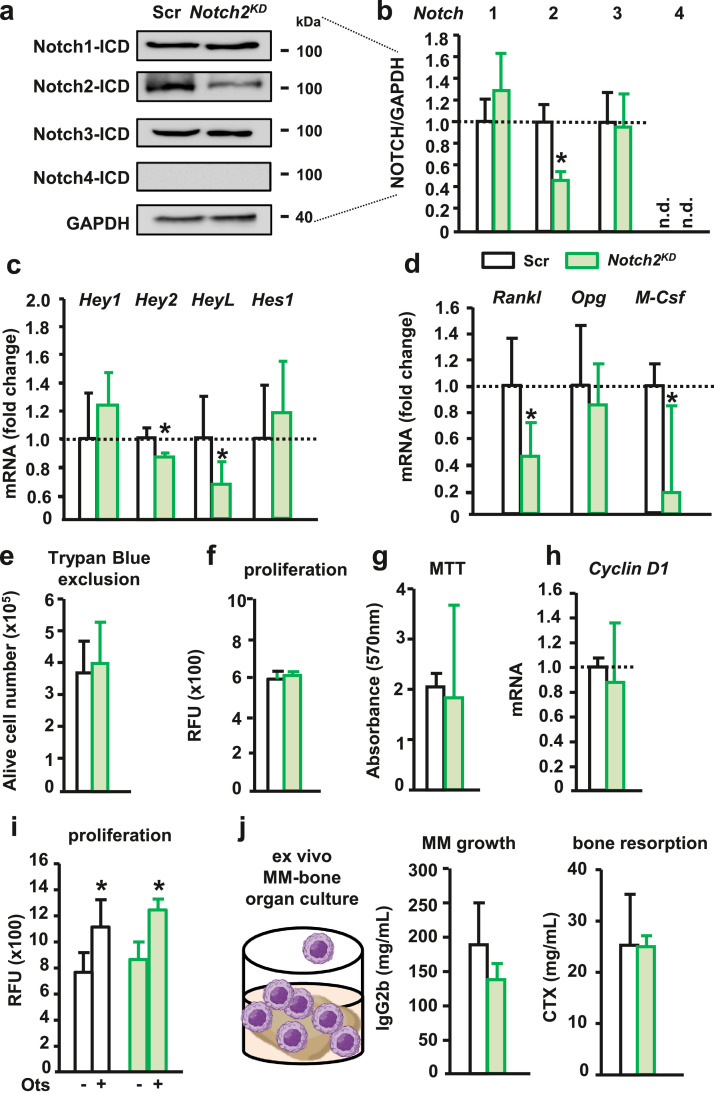
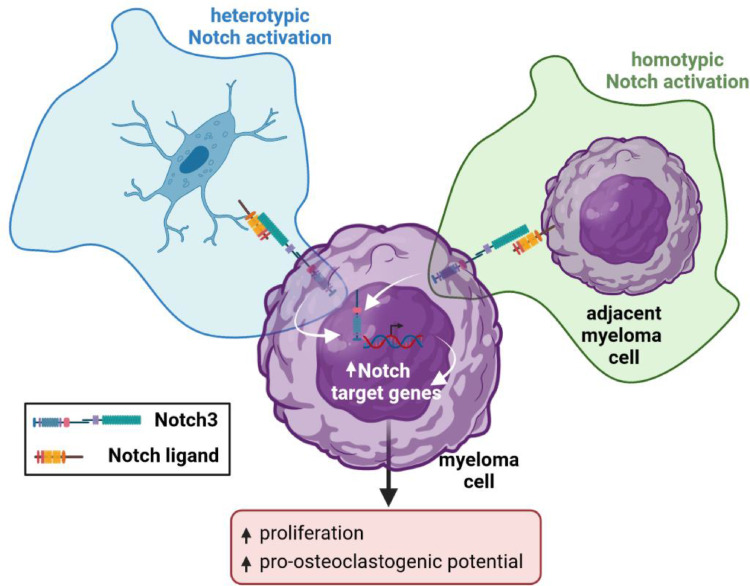
In multiple myeloma (MM), communication via Notch signaling in the tumor niche stimulates tumor progression and bone destruction. We previously showed that osteocytes activate Notch, increase Notch3 expression, and stimulate proliferation in MM cells. We show here that Notch3 inhibition in MM cells reduced MM proliferation, decreased Rankl expression, and abrogated the ability of MM cells to promote osteoclastogenesis. Further, Notch3 inhibition in MM cells partially prevented the Notch activation and increased proliferation induced by osteocytes, demonstrating that Notch3 mediates MM-osteocyte communication. Consistently, pro-proliferative and pro-osteoclastogenic pathways were upregulated in CD138+ cells from newly diagnosed MM patients with high vs. low NOTCH3 expression. These results show that NOTCH3 signaling in MM cells stimulates proliferation and increases their osteoclastogenic potential. In contrast, Notch2 inhibition did not alter MM cell proliferation or communication with osteocytes. Lastly, mice injected with Notch3 knock-down MM cells had a 50% decrease in tumor burden and a 50% reduction in osteolytic lesions than mice bearing control MM cells. Together, these findings identify Notch3 as a mediator of cell communication among MM cells and between MM cells and osteocytes in the MM tumor niche and warrant future studies to exploit Notch3 as a therapeutic target to treat MM.

Keywords: Bone; Cancer; Myeloma; Notch; Osteocytes; Tumor microenvironment.


Conflict of interest statement

Declaration of Competing Interest The authors declare that they have no known competing financial interests or personal relationships that could influence the work reported in this paper.

Figures

Fig. 1
Fig. 1
NOTCH receptor expression in CD138+ cells from newly diagnosed MM patients and human MM cell lines. (a) NOTCH1, 2, 3, and 4 expression distribution in a population of 768 newly diagnosed MM patients. Dashed lines indicate the top and bottom quartiles used to separate low vs. high NOTCH receptor expression. (b) Comparison of NOTCH1, 2, 3, and 4 expression levels in newly diagnosed MM patients. *p<0.05 vs. NOTCH1 expression. (c) Protein levels of the activated form of NOTCH3 (NICD3) in human MM cell lines. Two independent samples per cell line are shown.
Fig. 2
Fig. 2
Genetic inhibition of Notch3 decreases Cyclin D1 expression and proliferation in MM cells. (a)Notch1-4 mRNA gene expression in shRNA-scramble (Scr) or shRNA-Notch3 (Notch3KD) MM cells. (b) Western blot images for NICD1-4 in 5TGM1 MM cells. Bands were quantified and normalized by GAPDH. (c) mRNA gene expression of Notch target genes Hes1 and Hey2 in control or shRNA-Notch3-transduced MM cells. (d) Cell viability by MTT assay, (e) number of alive MM cells by Trypan Blue exclusion, and (f)Cyclin D1 mRNA gene expression in Scr and Notch3KD MM cells. For mRNA gene expression, fold change calculations vs. Scr are shown. (g) Apoptosis assay using flow cytometry after staining with annexin V/propidium iodide (PI). Representative scatter plots of PI (y-axis) vs. annexin V (x-axis) and percentage of apoptotic cells are shown. Representative experiments out of 3. n=4/group. n.d. = not detected.*p<0.05 vs Scr vehicle. (h) Levels of the tumor biomarker IgG2b in conditioned media collected from ex vivo MM-bone organ cultures show less MM growth in bones bearing Notch3KD MM cells after 11 days of culture. Representative experiment out of 2. *p<0.05 vs. Scr, n=4-5/group. (i) GO terms network plot of selected upregulated functional enrichment analysis of GO terms related to proliferation in MM patients with high vs. low NOTCH3 expression. The size of the circles represents the number of genes in the individual GO terms. The thickness of the lines represents the number of overlapped genes between the individual GO terms.
Fig. 3
Fig. 3
Notch3 inhibition decreases the osteoclastogenic potential of MM cells. (a)Rankl, Opg, and M-Csf mRNA gene expression in shRNA-scramble (Scr) or shRNA-Notch3 (Notch3KD) MM cells. (b)RANKL expression in newly diagnosed MM patients with high vs. low NOTCH3 expression. *p<0.05 vs. low NOTCH3 MM patients. For mRNA gene expression, fold change calculations vs. Scr are shown. (c) Representative images of TRAP+ cells in pre-osteoclast cultures treated with conditioned media (CM) from control or Notch3KD MM cells without exogenous recombinant RANKL. (d) Quantification of the number of multinucleated TRAP+ cells in pre-osteoclast cultures treated with increasing concentrations of CM from control or Notch3KD MM cells. Representative experiment out of 3. *p<0.05 vs. Scr. n=4-6/group. (e) Levels of the bone resorption marker CTX in CM collected from ex vivo MM-bone organ cultures show less bone resorption in bones bearing Notch3KD MM cells after 11 days of culture. Representative experiment out of 2. *p<0.05 vs. Scr, n=4-5/group. (f) GO terms network plot of selected upregulated functional enrichment analysis of GO terms related to osteoclast differentiation and proliferation in MM patients with high vs. low NOTCH3 expression. The size of the circles represents the number of genes in the individual GO terms. The thickness of the lines represents the number of overlapped genes between the individual GO terms.
Fig. 4
Fig. 4
Notch3 signaling is required for the increased MM cell proliferation induced by osteocytes. (a) Representative images of shRNA-scramble (Scr) or shRNA-Notch3 (Notch3KD) MM cells stained with DiI. Relative fluorescence units (RFU) in DiI labeled Scr or Notch3KD MM cells at basal levels and after 72h of culture. (b) DiI RFU in Scr or Notch3KD MM cells cultured with/without osteocytes. (c) mRNA gene expression of Hes1, Hey2, Cyclin D1, and Notch receptors in Scr or Notch3KD MM cells cultured with/without osteocytes. (d) DiI RFU and (e) mRNA gene expression in Scr or Notch3KD MM cells in the absence and presence of osteocytes, with/without GSI (5µM). Representative experiments out of 3. *p<0.05 vs. Scr vehicle/alone. #p<0.05 vs Notch3KD vehicle/alone. n=6/group. For mRNA gene expression, fold change calculations vs. Scr are shown.
Fig. 5
Fig. 5
Notch2 homotypic and heterotypic signaling in MM cells. (a-b) Protein levels of activated Notch receptors in 5TGM1 MM cells transduced with shRNA-scramble (Scr) or shRNA-Notch2 (Notch2KD) after 72h of culture. Representative western blot images for NICDs 1-4 in MM cells. (c-d) mRNA gene expression for Notch target genes, Rankl, Opg, and M-Csf mRNA in Notch2KD MM cells. (e-h) Number of alive MM cells by Tryan Blue exclusion, MM cell proliferation by DiI fluorescence (relative fluorescence units, RFU) or MTT assay, Cyclin D1 mRNA gene expression, in Scr or Notch2KD MM cells at 72h of culture. For mRNA gene expression, fold change calculations vs. Scr are shown. (i) DiI RFU of Scr or Notch2KD MM cells co-cultured with osteocytes for 72h. (j)Ex vivo MM-bone organ culture established with Scr or Notch2KD MM cells. (j) IgG2b and CTX levels in conditioned media after 11 days. *p<0.05 vs. Scr. Representative experiments out of 2-3. n=3-8/group. n.d.=not detected.
Fig. 6
Fig. 6
Genetic inhibition of Notch3 signaling in MM reduces tumor progression and bone destruction in a mouse model of MM disease. (a-b) Tumor progression in mice injected with saline, shRNA-scramble (Scr), or shRNA-Notch3 (Notch3KD) MM cells. Linear regression shows that the slopes of the IgG2b (tumor biomarker) progression curves are statistically different between mice bearing Scr vs. Notch3KD MM cells. (c-d) Representative X-Ray images of tibias bearing Scr or Notch3KD MM cells and quantification of the number of cortical osteolytic lesions per tibia. (e) MicroCT 3D reconstruction of tibias injected with saline, Scr, or Notch3KD MM cells. (f) Analysis of bone volume over tissue volume (BV/TV) in the cancellous bone of the proximal tibia. *p<0.05 vs. Scr. Saline: 4F/3M; MM-Scramble: 6F/6M; MM-Notch3KD: 4F/4M.
Fig. 7
Fig. 7
Notch3 signaling in MM cells mediates homotypic and heterotypic communication via Notch between neighboring MM cells and between MM cells and osteocytes in the tumor niche. Homotypic Notch3 signaling between MM cells is required for normal Notch signaling, proliferation, survival, and osteoclastogenic potential. Heterotypic Notch3 signaling mediates the activation of Notch and the stimulation of proliferation in MM cells induced by osteocytes.

References

    1. Rajkumar S.V. Myeloma today: Disease definitions and treatment advances. Am. J. Hematol. 2016;91:90–100. - PMC - PubMed
    1. Terpos E., Berenson J., Raje N., Roodman G.D. Management of bone disease in multiple myeloma. Expert Rev. Hematol. 2014;7:113–125. - PubMed
    1. Lomas O.C., Tahri S., Ghobrial I.M. The microenvironment in myeloma. Curr. Opin. Oncol. 2020;32:170–175. - PubMed
    1. Meurette O., Mehlen P. Notch signaling in the tumor microenvironment. Cancer Cell. 2018;34:536–548. - PubMed
    1. Sabol H.M., Delgado-Calle J. The multifunctional role of Notch signaling in multiple myeloma. J. Cancer Metast. Treat. 2021;7:20. - PMC - PubMed

Publication types