. 2022 Mar 30:15:3541-3558.
doi: 10.2147/IJGM.S351168. eCollection 2022.

Using a Machine Learning Approach to Identify Key Biomarkers for Renal Clear Cell Carcinoma

Affiliations

Using a Machine Learning Approach to Identify Key Biomarkers for Renal Clear Cell Carcinoma

Xiaying Han et al. Int J Gen Med. .

Abstract

Background: The most common and deadly subtype of renal carcinoma is kidney renal clear cell carcinoma (KIRC), which accounts for approximately 75% of renal carcinoma. However, the main cause of death in KIRC patients is tumor metastasis. There are no obvious clinical features in the early stage of kidney cancer, and 25-30% of patients have already metastasized when they are first diagnosed. Moreover, KIRC patients whose local tumors have been removed by nephrectomy are still at high risk of metastasis and recurrence and are not sensitive to chemotherapy and radiotherapy, leading to poor prognosis. Therefore, early diagnosis and treatment of this disease are very important.

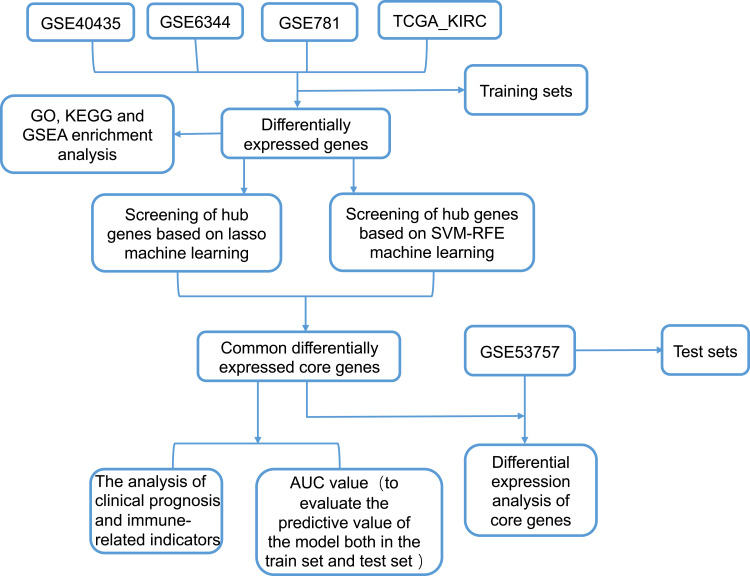
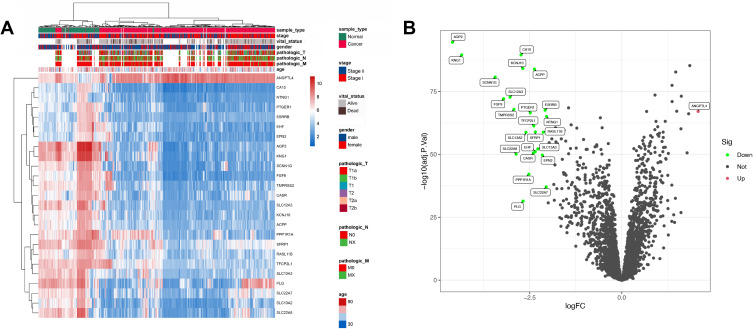
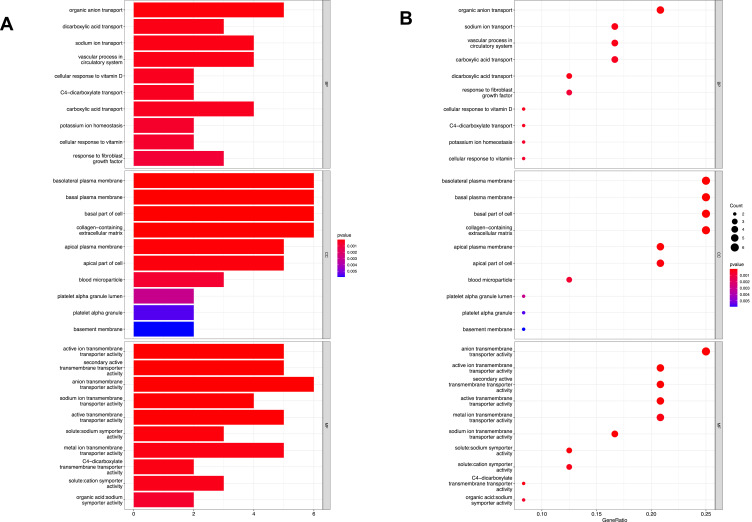
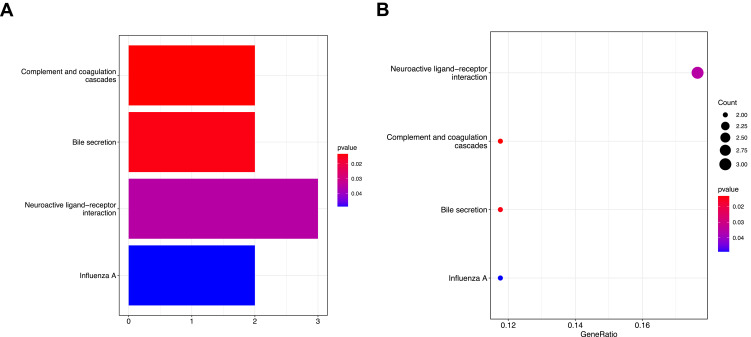
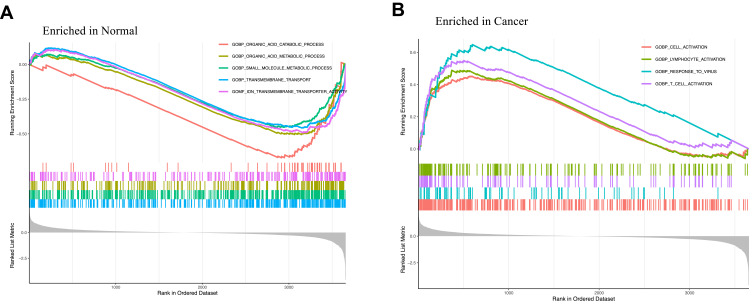
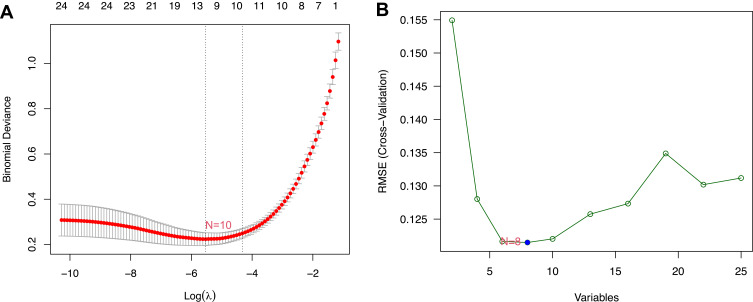
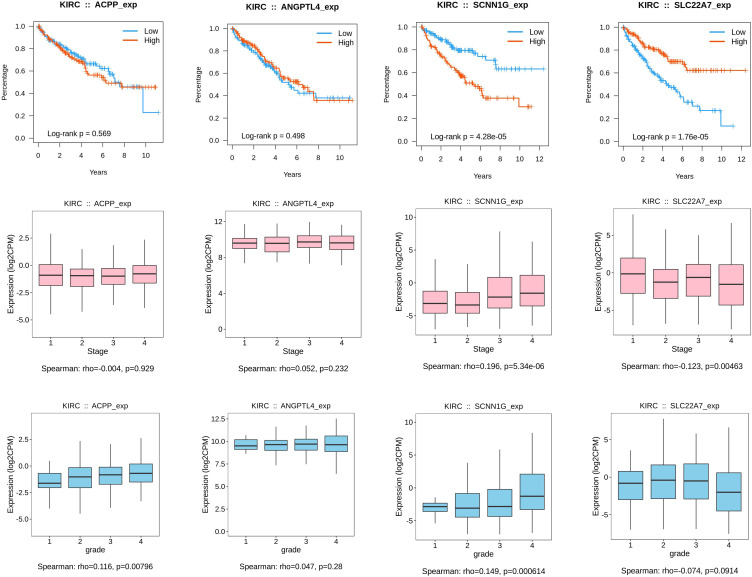
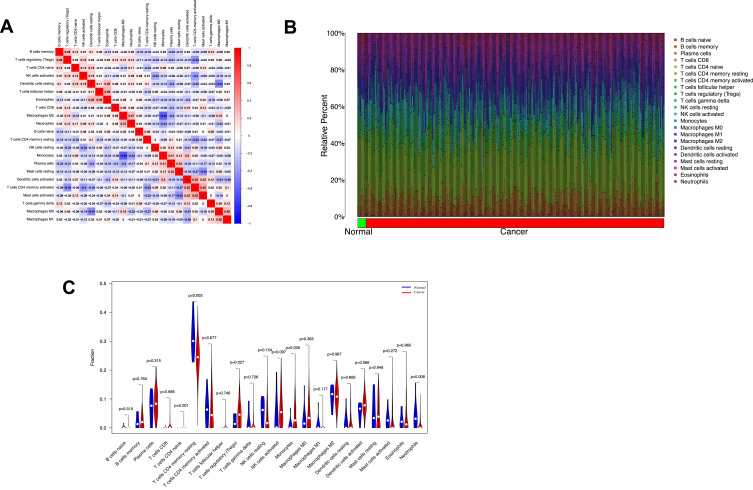
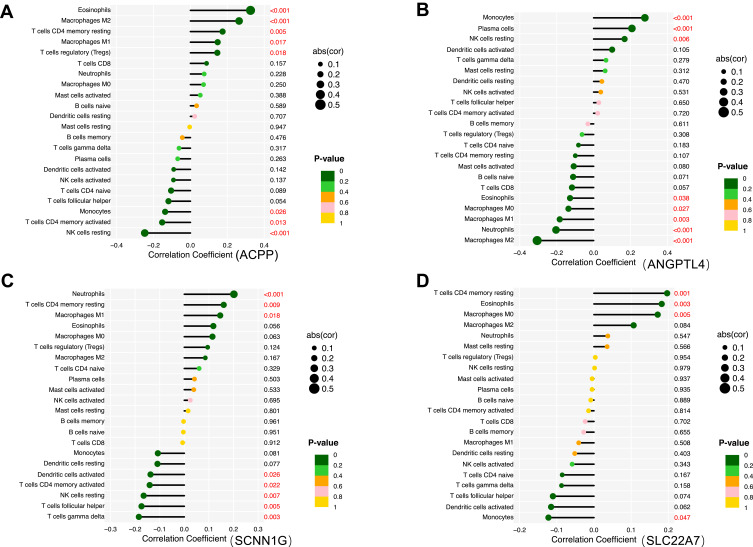
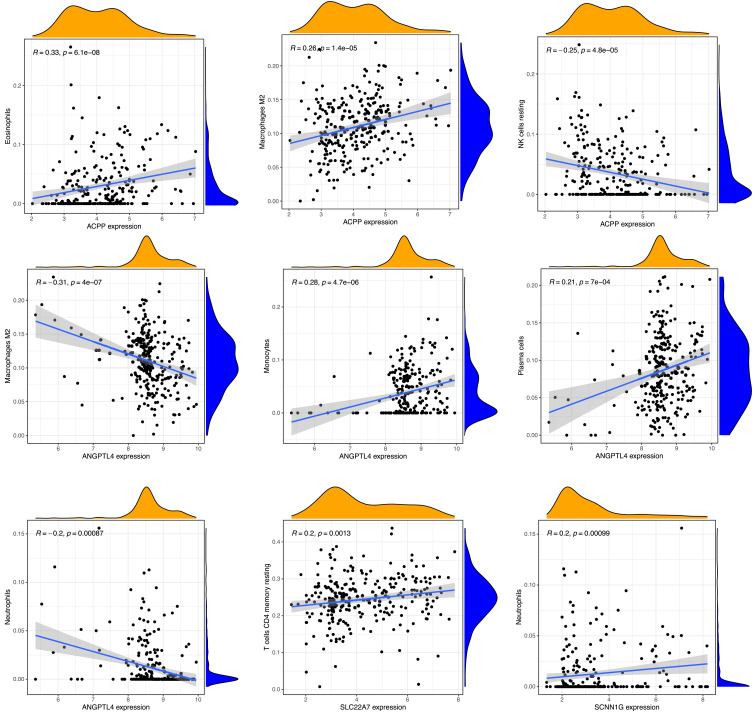
Methods: KIRC-related patient datasets were downloaded from the GEO database and TCGA database. DEG screening and GO, KEGG and GSEA enrichment analysis was firstly conducted and then the LASSO and support vector machine (SVM) RFE algorithms were adopted to identify KIRC-associated key genes in training sets and validate them in the test set. The clinical prognostic analysis including the association between the expression of key genes and the overall survival, stage, grade across KIRC, the immune infiltration difference between normal samples and cancer samples, the correlation between the key genes and immune cells, immunomodulator, immune subtypes of KIRC were investigated in this research.

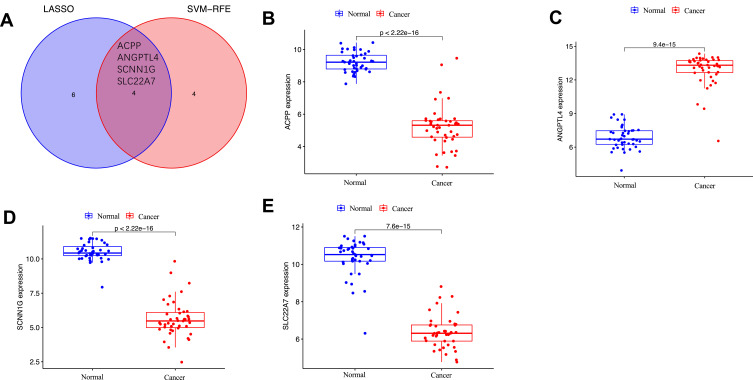
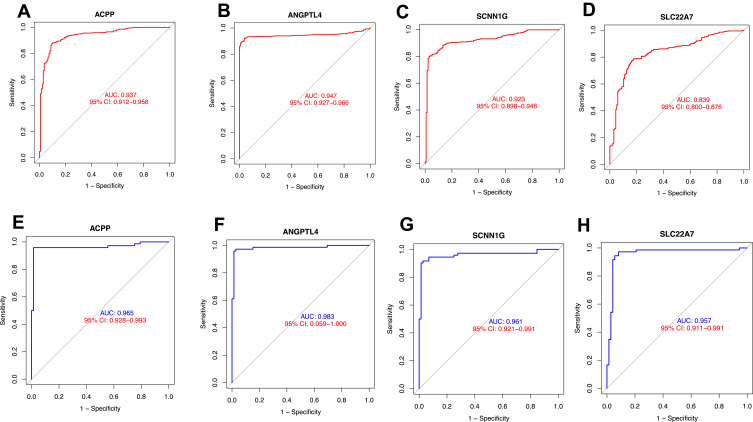
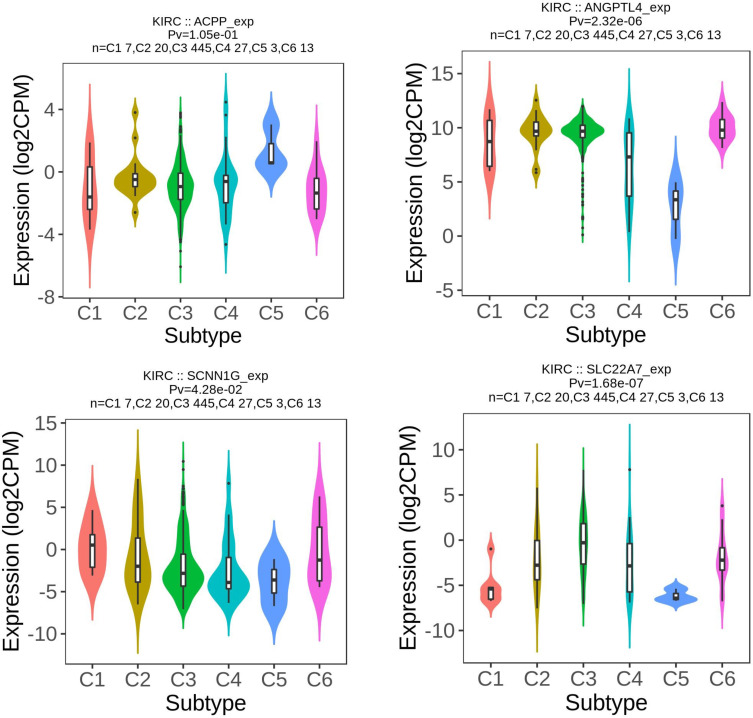
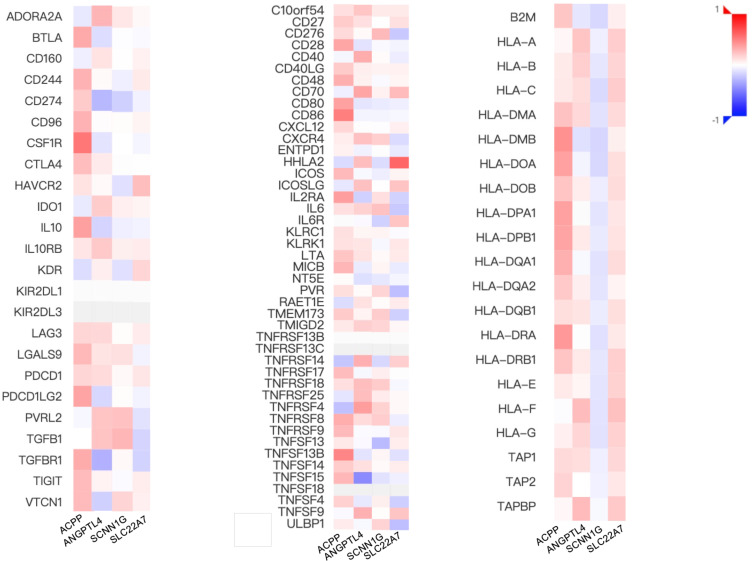
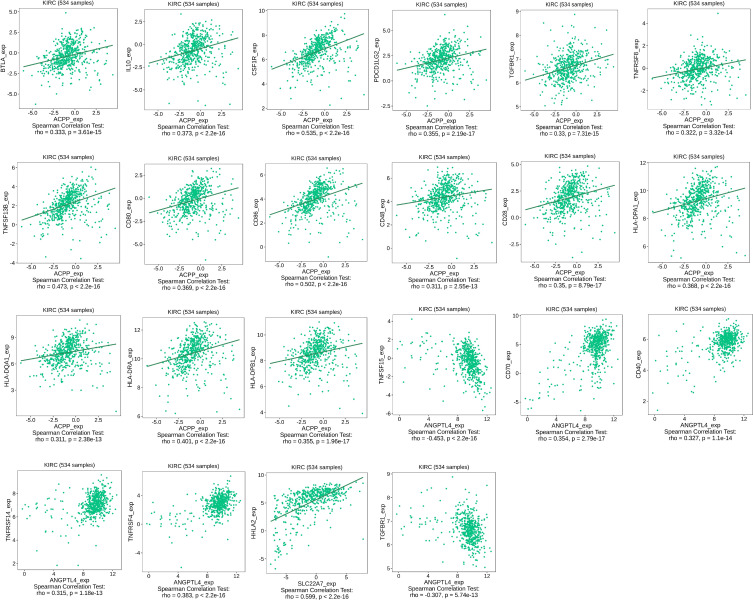
Results: We finally screened out 4 key genes, including ACPP, ANGPTL4, SCNN1G, SLC22A7. The expression of key genes show difference among normal samples and tumor samples, SCNN1G and SLC22A7 could be predictor of prognosis of patients. The expression of key genes was related with the abundance of tumor infiltration immune cells and the gene expression of immune checkpoint.

Conclusion: This study screened the 4 key genes, which contributed to early diagnosis, prognosis assessment and immune target treatment of patients with KIRC.

Keywords: biomarkers; machine learning; prognosis; renal clear cell carcinoma; treatment.


Conflict of interest statement

The authors declared that they have no conflicts of interest for this work.

Figures

Figure 1
Figure 1
The flowchart of this study.
Figure 2
Figure 2
The gene differential expression analysis of GSE6344, GSE40435, GSE781, TCGA_KIRC data set. (A) Whole gene expression heat map of normal tissues and cancer tissues with high expression in red and low expression in blue, with clinical information (B) the DEG Volcano map shows upregulated genes in red and down-regulated genes in green.
Figure 3
Figure 3
Barplot (A) and bubble plot (B) figures of GO enrichment analysis of 25 differential genes gotten from DEG screening.
Figure 4
Figure 4
Barplot (A) and bubble plot (B) figures of KEGG enrichment analysis of 25 differential genes gotten from DEG screening.
Figure 5
Figure 5
Figures of GSEA enrichment analysis in normal tissues (A) and cancer tissues (B).
Figure 6
Figure 6
The potential key genes of KIRC were screened by LASSO regression model and SVM-RFE using training set. (A) LASSO regression model screened the potential key genes of KIRC. The X-axis represented the λ value, the Y-axis represented the cross-validation error. N=10 represented that 10 key genes were screened. (B) SVM-RFE algorithm screened the potential key genes. The X-axis represented the λ value, the Y-axis represented the cross-validation error. N=8 represented that 8 key genes were screened.
Figure 7
Figure 7
The intersection hub genes of the two algorithm (A) and each gene differential analysis in normal and cancer tissues, including ACPP (B), ANGPTL4 (C), SCNN1G (D), SLC22A7 (E).
Figure 8
Figure 8
ROC curves of training set and test set for gene signature. ACPP (A), ANGPTL4 (B), SCNN1G (C), SLC22A7 (D) in training set, ACPP (E), ANGPTL4 (F), SCNN1G (G), SLC22A7 (H) in test set.
Figure 9
Figure 9
Clinical prognostic analysis including the association between the expression of key genes including ACPP, ANGPTL4, SCNN1G, SLC22A7 and the overall survival, stage, grade across KIRC.
Figure 10
Figure 10
(A) The correlation among immune cells of the samples in the training set. (B) Relative percentage of 22 immune cell subsets in normal samples and cancer samples. (C) Vioplot diagram of immune infiltration difference between normal samples and cancer samples, green as normal samples, red as cancer samples.
Figure 11
Figure 11
Lollipop figures of the correlation between the key genes including ACPP (A), ANGPTL4 (B), SCNN1G (C), SLC22A7 (D) and immune cells using the training set. The P value in Y-axis <0.05 was marked in red.
Figure 12
Figure 12
Scatter plot of the correlation between key gene expressions and immune cells using the training set.
Figure 13
Figure 13
Kruskal test analysis of key gene expression levels in immune subtypes of KIRC using TISIDB website.
Figure 14
Figure 14
The correlation analysis between key genes expression and immune checkpoint genes’ expression using TISIDB website.
Figure 15
Figure 15
The scatter plots of key genes expression and immune checkpoint genes’ expression using TISIDB website.

References

    1. Moch H, Cubilla AL, Humphrey PA, Reuter VE, Ulbright TM. The 2016 WHO classification of tumours of the urinary system and male genital organs-part a: renal, penile, and testicular tumours. Eur Urol. 2016;70(1):93–105. doi: 10.1016/j.eururo.2016.02.029 - DOI - PubMed
    1. Zhan C, Wang Z, Xu C, et al. Development and validation of a prognostic gene signature in clear cell renal cell carcinoma. Front Mol Biosci. 2021;8(45). doi: 10.3389/fmolb.2021.609865 - DOI - PMC - PubMed
    1. Li Y, Gong Y, Ning X, et al. Downregulation of CLDN7 due to promoter hypermethylation is associated with human clear cell renal cell carcinoma progression and poor prognosis. J Exp Clin Cancer Res. 2018;37(1):276. doi: 10.1186/s13046-018-0924-y - DOI - PMC - PubMed
    1. Motzer RJ, Bander NH, Nanus DM. Renal-cell carcinoma. N Engl J Med. 1996;335(12):865–875. doi: 10.1056/NEJM199609193351207 - DOI - PubMed
    1. Liu H, Yang Y. Identification of mast cell-based molecular subtypes and a predictive signature in clear cell renal cell carcinoma. Front Mol Biosci. 2021;8(927). doi: 10.3389/fmolb.2021.719982 - DOI - PMC - PubMed