. 2022 Mar 22:13:836494.
doi: 10.3389/fimmu.2022.836494. eCollection 2022.

CB2R Activation Regulates TFEB-Mediated Autophagy and Affects Lipid Metabolism and Inflammation of Astrocytes in POCD

Affiliations

CB2R Activation Regulates TFEB-Mediated Autophagy and Affects Lipid Metabolism and Inflammation of Astrocytes in POCD

Lieliang Zhang et al. Front Immunol. .

Abstract

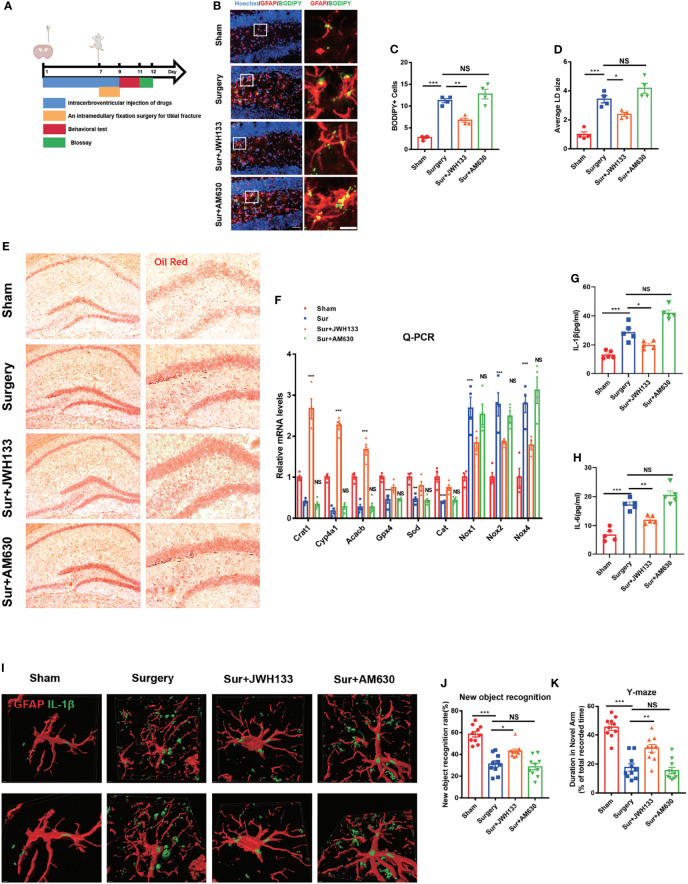
Evidence suggests that the accumulation of lipid drots (LDs) accelerates damage to mitochondria and increases the release of inflammatory factors. These have been implicated as a mechanism underlying neurodegenerative diseases or tumors and aging-related diseases such as postoperative cognitive dysfunction (POCD), nevertheless, accumulation of lipid droplets has not been extensively studied in the central nervous system (CNS). Here, we found that after surgery, there was activation of astrocytes and lipid accumulation in the hippocampus. However, cannabinoid receptor type II (CB2R) activation significantly reduced lipid accumulation in astrocytes and change the expression of genes related to lipid metabolism. CB2R reduces the release of the inflammatory factors interleukin-1 beta (IL-1β) and interleukin 6 (IL-6) in peripheral serum and simultaneously improves cognitive ability in mice with POCD. Further research on mechanisms indicates that CB2R activation promotes the nuclear entry of the bHLH-leucine zipper transcription factor, the transcription factor EB (TFEB), and which is a master transcription factor of the autophagy-lysosomal pathway, also reduces TFEB-S211 phosphorylation. When CB2R promotes TFEB into the nucleus, TFEB binds at two sites within promoter region of PGC1α, promoting PGC1α transcription and accelerating downstream lipid metabolism. The aforementioned process leads to autophagy activation and decreases cellular lipid content. This study uncovers a new mechanism allowing CB2R to regulate lipid metabolism and inflammation in POCD.

Keywords: astrocytes; autophagy; cannabinoid type 2 receptor; inflammation; lipid accumulation; mitochondrial damage; postoperative cognitive dysfunction.


Conflict of interest statement

The authors declare that the research was conducted in the absence of any commercial or financial relationships that could be construed as a potential conflict of interest.

Figures

Figure 1
Figure 1
(A) Experimental protocol and timeline. Administration of JWH133 or AM630 via the lateral ventricle of the mice by using a stainless steel tube 7 d before surgery; behavioral and biological testing 2 d after surgery. (B) Immunofluorescence staining of GFAP and BODIPY staining in the hippocampal DG brain region. Statistical data on BODIPY+ cells, with the average LD size (C, D) (means±SEM, n=4, scale bars=40 and 3 μm). (E) Oil Red O LD staining in the hippocampus (n=4, scale bars=200 and 100 μm). (F) RT-qPCR results for the relative mRNA expression levels of Crat, Cyp4a12a, Acacb, Gpx4, Sod, Cat, and Nox1,2,4 in the hippocampus (means±SEM, n=4). (G, H) ELISA of IL-1β and IL-6 serum levels (n=5). (I) Co-labeling of GFAP and IL-1β in the hippocampus, as detected by immunofluorescence assay. Analysis of the fluorescence signal by using Imaris 9.0 to generate a 3D model (scale bars=2 μm). (J, K) New object recognition and Y-maze testing of mice in each group (means±SEM, n =10). NS means not significant, * P < 0.05, ** P < 0.01, *** P < 0.001 compared with the corresponding group, as determined by ANOVA.
Figure 2
Figure 2
(A) Experimental protocol and timeline. Injection with the AAV virus in the hippocampus of mice 2 weeks before surgery; behavioral and biological testing 2 d after surgery. (B) Immunofluorescence staining of GFAP and AAV virus–GFP staining in the hippocampal DG brain region. (C–E) Immunofluorescence staining of GFAP and BODIPY staining in the hippocampal DG brain region; statistical data on BODIPY+ cells and the average LD size (means±SEM, n=4, scale bars=40 and 3 μm). (F–N) RT-qPCR results of the relative mRNA expression levels of Crat, Cyp4a12a, Acacb, Gpx4, Sod, Cat, and Nox1,2,4 in the hippocampus (means±SEM, Crat, Cyp4a12a, Acacb, n=4; Sod, Cat, and Nox1,2,4 n=6). (O, P) ELISA of serum IL-1β and IL-6 (n=5). (Q, R) New object recognition and Y-maze testing of mice in each group (means±SEM, n =10). * P < 0.05, ** P < 0.01, *** P < 0.001 compared with the corresponding group, as determined by two-way ANOVA, F (1, 12) BODIPY Cells Interaction=17.22; F (1, 12) LD size Interaction=7.598; F (1, 12) Crat Interaction=2.169;F (1, 12) Cyp4a12a Interaction=8.219; F (1, 12) Acacb Interaction=9.162;F (1, 20) Gpx4 Interaction=7.022;F (1, 20) Cat Interaction=3.355;F (1, 20) Sod Interaction=4.956;F (1, 20) Nox1 Interaction=6.025;F (1, 20) Nox2 Interaction=4.125;F (1, 20) Nox4 Interaction=4.494;F (1, 16)IL-1βInteraction=4.600;F (1, 16) IL-6 Interaction=3.384; F (1, 28) New object recognition Interaction=3.258;F (1, 28) Y-maze Interaction=2.318, followed by Tukey’s post hoc test.
Figure 3
Figure 3
(A, B) GFAP expression analyzed by immunochemistry in the hippocampal dentate gyrus brain region; statistical data depicted in the graph (means±SEM, n=4, scale bars=100 μm). Quantification of positive areas by using ImageJ. (C, D) Nissl staining of the hippocampus in (C) and statistical graph is shown in (D) (n=4, scale bars =200 μm and 100μm). Examination of the hippocampus by Golgi–Cox staining (E–G); pictures analyzed with the NeuroJ plugin in ImageJ to calculate the total length of dendrites and the density of synaptic spines (means±SEM, n=4, scale bars=4 μm). NS means not significant, *P < 0.05, **P < 0.01, ***P < 0.001 compared with the corresponding group, as determined by ANOVA.
Figure 4
Figure 4
(A) U87 cells incubated with 1 μM of JWH133 or 1 μM of Triacsin C for 1 h and stimulated with 100 ng/mL of LPS for 6 h, collected for fluorescence photography (Scale bar= 20 μm) and cell flow analysis. (B) Statistical data in (C) (means±SEM, for 4 independent experiments). (D) JC1-green fluorescence and JC1-red fluorescence measured by flow cytometry in each group (scale bar=20 μm). (E) Flow cytometric analyses of the mitochondrial function by JC-1 assay and green fluorescence intensity of JC1-green. (F) Flow cytometry of the green fluorescence intensity of JC1-green (means±SEM, for 4 independent experiments). (G) After cell treatment, cells were incubated with Mitochondrial Tracker Green for 30 minutes at 37°C, and images were captured under confocal microscope (scale bar=50μm). NS means not significant, * P < 0.05, ** P < 0.01, *** P < 0.001 compared with the corresponding group, as determined by ANOVA.
Figure 5
Figure 5
(A) U87 cells incubated with 5 mM of 3-MA and 1 μM of JWH133 for 1 h and then stimulated with 100 ng/mL of LPS for 6 h. U87 cells in the LPS+JWH133+SiRNA-TFEB group, mediated by SiRNA–TFEB for 48 h before treatment, collected for Q-PCR analysis (Sqstm1, Lamp1, Ctsd, Ctsb, Atp6v1d, Atp6v1h, and LPS+JWH133+SiRNA-TEEB LPS+JWH133+3-MA compared with LPS+JWH133; Statistical difference indicated in the figure; means±SEM, for 4 independent experiments). (B, C) U87 cells used in experiments 4 d after infection with the RFP-GFP-MAP1LC3B adenovirus. Cells treated using the same procedure as before. Determination of the relative GFP-to-RFP ratio (for 4 independent experiments, scale bar=20 μm). (D, E) BODIPY staining and statistical data for U87 cells (for 4 independent experiments, scale bar=20 μm). (F, G) Q-PCR analysis of IL-1β and IL-6 (means±SEM, for 4 independent experiments). (H) U87 cells tested for TFEB expression by using immunofluorescence (Scale bar=50 μm). (I–L) Transfection of GV143-TFEB, GV143-S211A, and GV143-S142A plasmids into U87 cells, cytoplasmic nucleoprotein extraction, and Western blot detection. Data shown in the figure (means±SEM, for 3 independent experiments). NS means not significant, * P < 0.05, ** P < 0.01, *** P < 0.001 compared with the corresponding group, as determined by two-way ANOVA, F (2,12) TFEB Interaction=22.83; F (2,12) TFEB -S211A Interaction= 0.05; F (2,12) TFEB -S142A Interaction= 24.81, followed by Tukey’s post hoc test.
Figure 6
Figure 6
Transfection of GV143-TFEB plasmid into U87 cells. (A) After treatment of cells with LPS and JWH133, mRNA is extracted from U87 cells and PGC-1 expression is detected by Q-PCR (means±SEM, for 6 independent experiments). (B) ChIP analysis of U87 cells. (means±SEM, for 4 independent experiments). (C) Representative diagrams of constructs containing the PGC1α promoter region with either the intact or truncated promoter region of PGC1α. Luciferase activity measured after transfecting increasing amounts of TFEB-Flag combined with PGC1α plasmids (means±SEM, for 4 independent experiments). (D, E) U87 cells transfected with the TFEB-flag plasmid or mediated by PGC1α expression, processed with LPS and JWH133, and stained with BODIPY. Data shown in the figure. (means±SEM, for 3 independent experiments). (F, G) Q-PCR analysis of IL-1β and IL-6 (means±SEM, for 4 independent experiments). NS means not significant, *P < 0.05, **P < 0.01, ***P < 0.001 compared with the corresponding group, as determined by ANOVA.
Figure 7
Figure 7
CB2R activation regulates TFEB-mediated autophagy and affects lipid metabolism and inflammation of astrocytes in POCD.

Similar articles

Cited by

References

    1. Needham MJ, Webb CE, Bryden DC. Postoperative Cognitive Dysfunction and Dementia: What We Need to Know and do. Br J Anaesth (2017) 119:i115–25. doi: 10.1093/bja/aex354 - DOI - PubMed
    1. Li D, Chen M, Meng T, Fei J. Hippocampal Microglial Activation Triggers a Neurotoxic-Specific Astrocyte Response and Mediates Etomidate-Induced Long-Term Synaptic Inhibition. J Neuroinflamm (2020) 17:109. doi: 10.1186/s12974-020-01799-0 - DOI - PMC - PubMed
    1. Farmer BC, Kluemper J, Johnson LA. Apolipoprotein E4 Alters Astrocyte Fatty Acid Metabolism and Lipid Droplet Formation. Cells (2019) 8(20):182. doi: 10.3390/cells8020182 - DOI - PMC - PubMed
    1. Zhu J, Hu Z, Han X, Wang D, Jiang Q, Ding J, et al. . Dopamine D2 Receptor Restricts Astrocytic NLRP3 Inflammasome Activation via Enhancing the Interaction of Beta-Arrestin2 and NLRP3. Cell Death Differ (2018) 25:2037–49. doi: 10.1038/s41418-018-0127-2 - DOI - PMC - PubMed
    1. Qi G, Mi Y, Shi X, Gu H, Brinton RD, Yin F. ApoE4 Impairs Neuron-Astrocyte Coupling of Fatty Acid Metabolism. Cell Rep (2021) 34:108572. doi: 10.1016/j.celrep.2020.108572 - DOI - PMC - PubMed

MeSH terms

Substances

LinkOut - more resources