. 2022 Mar 22:13:793982.
doi: 10.3389/fimmu.2022.793982. eCollection 2022.

Functional Profile of CD8+ T-Cells in Response to HLA-A*02:01-Restricted Mutated Epitopes Derived from the Gag Protein of Circulating HIV-1 Strains from Medellín, Colombia

Affiliations

Functional Profile of CD8+ T-Cells in Response to HLA-A*02:01-Restricted Mutated Epitopes Derived from the Gag Protein of Circulating HIV-1 Strains from Medellín, Colombia

Alexandra Sánchez-Martínez et al. Front Immunol. .

Abstract

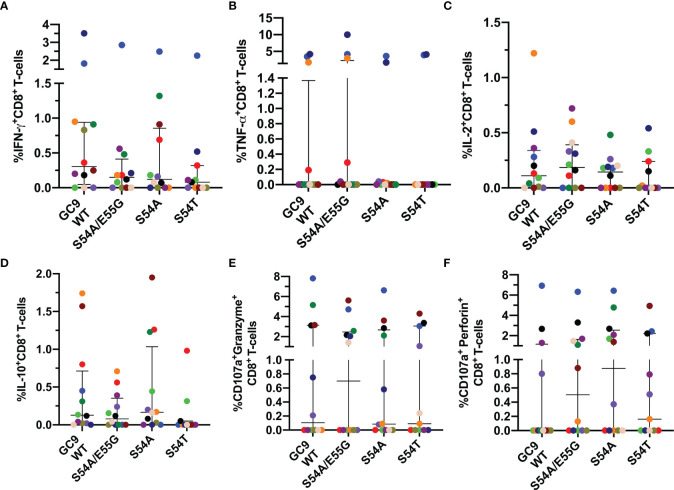
CD8+ T-cells play a crucial role in the control of HIV replication. HIV-specific CD8+ T-cell responses rapidly expand since the acute phase of the infection, and it has been observed that HIV controllers harbor CD8+ T-cells with potent anti-HIV capacity. The development of CD8+ T-cell-based vaccine against HIV-1 has focused on searching for immunodominant epitopes. However, the strong immune pressure of CD8+ T-cells causes the selection of viral variants with mutations in immunodominant epitopes. Since HIV-1 mutations are selected under the context of a specific HLA-I, the circulation of viral variants with these mutations is highly predictable based on the most prevalent HLA-I within a population. We previously demonstrated the adaptation of circulating strains of HIV-1 to the HLA-A*02 molecule by identifying mutations under positive selection located in GC9 and SL9 epitopes derived from the Gag protein. Also, we used an in silico prediction approach and evaluated whether the mutations found had a higher or lower affinity to the HLA-A*02. Although this strategy allowed predicting the interaction between mutated peptides and HLA-I, the functional response of CD8+ T-cells that these peptides induce is unknown. In the present work, peripheral blood mononuclear cells from 12 HIV-1+ HLA-A*02:01+ individuals were stimulated with the mutated and wild-type peptides derived from the GC9 and SL9 epitopes. The functional profile of CD8+ T-cells was evaluated using flow cytometry, and the frequency of subpopulations was determined according to their number of functions and the polyfunctionality index. The results suggest that the quality of the response (polyfunctionality) could be associated with the binding affinity of the peptide to the HLA molecule, and the functional profile of specific CD8+ T-cells to mutated epitopes in individuals under cART is maintained.

Keywords: CD8+ T-cells; HIV-1; HLA-A*02; T-cell epitopes; class I HLA-peptide binding affinity; gag-derived peptides; polyfunctionality.


Conflict of interest statement

The authors declare that the research was conducted in the absence of any commercial or financial relationships that could be construed as a potential conflict of interest.

Figures

Figure 1
Figure 1
CD8+ T-cell response to polyclonal antigen-independent stimulation. Frequencies of CD8+ T-cells positive for IFN-γ (A), TNF-α (B), IL-2 (C), IL-10 (D), and CD107a together with granzyme B (E) or perforin (F). Each point represents the CD8+ T-cell response in the negative control (NC), and after stimulation with SEB and PMA/Ionomycin (PMA) for 12 hours. The Wilcoxon test was used to compare the response of cells stimulated with each polyclonal stimulus and NC. Plots depict median and IQR, n = 10-12.
Figure 2
Figure 2
Polyfunctional CD8+ T-cell response to polyclonal antigen-independent stimulation. (A) Pie charts represent the average frequencies of CD8+ T-cells cells secreting cytokines and cytotoxic molecules producing every possible combination of the six molecules analyzed after stimulation with Staphylococcal Enterotoxin B (SEB) and PMA/Ionomycin (PMA) for 12 hours SEB and PMA/Ionomycin. The segments within the pie chart denote populations producing different combinations of molecules (pie segment legend). The size of the pie segment correlates to the frequency of the particular population. The arcs around the circumference indicate the particular molecule (see outer arc legend) produced by the proportion of cells that lie under the arc. Parts of the pie surrounded by multiple arcs represent polyfunctional cells. (B) Percentage of cells exhibiting one, two, or more than three functions. (C) Polyfunctionality index. Wilcoxon test was used for matched-paired samples. Plots depict the median and IQR, n = 10.
Figure 3
Figure 3
Cytokine mediated and cytotoxic CD8+ T-cell response to GC9 WT, S54A/E55G, S54A and S54T. Frequency of CD8+ T-cells positive for IFN-γ (A), TNF-α (B), IL-2 (C), and IL-10 (D), CD107a co-expressed granzyme B (E) or CD107a co-expressed perforin (F). Each point represents the CD8+ T-cell response in an individual to each peptide (10 µg/mL) after subtraction of the negative control. Wilcoxon test was used for matched-paired samples and comparisons were made between each mutated peptide with the wild type version (GC9 WT). Plots depict the median and IQR, n = 11-12.
Figure 4
Figure 4
Functional profile of CD8+ T-cell response to GC9 WT, S54A/E55G, S54A and S54T. (A) Pie charts represent the average frequencies of CD8+ T-cells cells secreting cytokines and cytotoxic molecules producing every possible combination of the six molecules analyzed in response to GC9 WT and mutated peptides (10 µg/mL). The size of the pie segment correlates to the frequency of the particular population. The arcs around the circumference indicate the particular molecule (see outer arc legend) produced by the proportion of cells that lie under the arc. Parts of the pie surrounded by multiple arcs represent polyfunctional cells. (B) Percentage of cells responding through one, two, or more than three functions. (C) Polyfunctionality index. Wilcoxon test was used for matched-paired samples and comparisons were made between each mutated peptide with the wild type version (GC9 WT), but also among mutated variants. Plots depict the median and IQR, n = 11-12.
Figure 5
Figure 5
Cytokine mediated and cytotoxic CD8+ T-cell response to SL9 WT and Y79F/T84V/L85F. Frequency of CD8+ T-cells positive for IFN-γ (A), TNF-α (B), IL-2 (C), IL-10 (D), CD107a co-expressed granzyme B (E) or CD107a co-expressed perforin (F). Each point represents the CD8+ T-cell response in an individual to each peptide (10 µg/mL) after subtraction of the negative control. Wilcoxon test was used for matched-paired samples. Plots depict the median and IQR, n = 11.
Figure 6
Figure 6
Polyfunctional CD8+ T-cell response to SL9 WT and Y79F/T84V/L85F. (A) Pie charts represent the average frequencies of CD8+ T-cells cells secreting cytokines and cytotoxic molecules producing every possible combination of the six molecules analyzed in response to SL9 WT and mutated peptides (10 µg/mL). The size of the pie segment correlates to the frequency of the particular population. The arcs around the circumference indicate the particular molecule (see outer arc legend) produced by the proportion of cells that lie under the arc. Parts of the pie surrounded by multiple arcs represent polyfunctional cells. (B) Percentage of cells responding through one, two, or more than three functions. (C) Polyfunctionality index. Wilcoxon test was used for comparison. Plots depict the median and IQR, n = 11.
Figure 7
Figure 7
Association between clinical variables and the CD8+ T-cell response to wild type and mutated peptides. (A) Correlation between the PI of CD8+ T-cells after stimulation with the S54A (black dots) and Y79F/T84V/L85F peptides (gray dots), and the time on treatment of the HIV-1-infected individuals. (B) Correlation between the PI of CD8+ T-cells after stimulation with the GC9 WT and CD4:CD8 ratio. (C) Correlation between the frequency of CD107a+perforin+ CD8+ T-cells after stimulation with the SL9 WT and CD4+ T-cell counts. The rho and P-value of the Spearman test are shown.

References

    1. Beyrer C. A Pandemic Anniversary: 40 Years of HIV/AIDS. Lancet (2021) 397(10290):2142–3. doi: 10.1016/S0140-6736(21)01167-3 - DOI - PubMed
    1. Greener M. Forty Years on: How Close is an HIV Vaccine? Prescriber (2021) 32(5):32–6. doi: 10.1002/psb.1919 - DOI
    1. Bai RJ, Dai LL, Wu H. Advances and Challenges in Antiretroviral Therapy for Acquired Immunodeficiency Syndrome. Chin Med J (2020) 133(23):2775–7. doi: 10.1097/CM9.0000000000001226 - DOI - PMC - PubMed
    1. Denton PW, Søgaard OS, Tolstrup M. Impacts of HIV Cure Interventions on Viral Reservoirs in Tissues. Front Microbiol (2019) 10(AUG):1–7. doi: 10.3389/fmicb.2019.01956 - DOI - PMC - PubMed
    1. Collins DR, Gaiha GD, Walker BD. CD8+ T Cells in HIV Control, Cure and Prevention. Nat Rev Immunol (2020) 20(8):471–82. doi: 10.1038/s41577-020-0274-9 - DOI - PMC - PubMed

LinkOut - more resources