. 2022 Mar 22:16:845476.
doi: 10.3389/fnhum.2022.845476. eCollection 2022.

The Effect of Inter-pulse Interval on TMS Motor Evoked Potentials in Active Muscles

Affiliations

The Effect of Inter-pulse Interval on TMS Motor Evoked Potentials in Active Muscles

Noora Matilainen et al. Front Hum Neurosci. .

Abstract

Objective: The time interval between transcranial magnetic stimulation (TMS) pulses affects evoked muscle responses when the targeted muscle is resting. This necessitates using sufficiently long inter-pulse intervals (IPIs). However, there is some evidence that the IPI has no effect on the responses evoked in active muscles. Thus, we tested whether voluntary contraction could remove the effect of the IPI on TMS motor evoked potentials (MEPs).

Methods: In our study, we delivered sets of 30 TMS pulses with three different IPIs (2, 5, and 10 s) to the left primary motor cortex. These measurements were performed with the resting and active right hand first dorsal interosseous muscle in healthy participants (N = 9 and N = 10). MEP amplitudes were recorded through electromyography.

Results: We found that the IPI had no significant effect on the MEP amplitudes in the active muscle (p = 0.36), whereas in the resting muscle, the IPI significantly affected the MEP amplitudes (p < 0.001), decreasing the MEP amplitude of the 2 s IPI.

Conclusions: These results show that active muscle contraction removes the effect of the IPI on the MEP amplitude. Therefore, using active muscles in TMS motor mapping enables faster delivery of TMS pulses, reducing measurement time in novel TMS motor mapping studies.

Keywords: TMS; active muscle contraction; inter-pulse interval; motor evoked potential; motor mapping; motor threshold.


Conflict of interest statement

The authors declare that the research was conducted in the absence of any commercial or financial relationships that could be construed as a potential conflict of interest.

Figures

Figure 1
Figure 1
Experimental design of the study. (A) T1- (pictured) and T2-weighted MR images were used to create individual cortical reconstructions. (B) The induced electric fields were calculated based on computer simulations. (C) The location of the TMS coil (red mark) for the experiment was predetermined from the cortical reconstruction in order to obtain the optimal cortical location for the FDI muscle. (D) TMS measurement consisted of two parts, resting and active condition. Both included three sets of 30 stimuli with 2, 5, and 10 s IPI. The order of the conditions and IPIs were pseudo-randomized. (E) MEPs were recorded from the FDI muscle of the right hand. The peak-to-peak amplitude of the MEPs was used in the analysis. The silent period was defined as the duration between the MEP onset and the resumption of the voluntary EMG.
Figure 2
Figure 2
(A) Relationship between the MEP amplitudes and the EMG baseline (RMS value over 1 s before the stimulus) during TMS stimulation with active contraction on logarithmic scale. Participant-specific intercepts have been removed from the data using a linear mixed effects model. The gray shaded area around the regression line represents the 95% confidence interval. (B) Mean coefficient of variation (CV) of the log transformed MEP amplitude versus IPI at active and resting conditions. Error bars represent the standard errors.
Figure 3
Figure 3
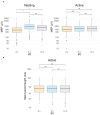
MEP amplitudes of each IPI (2, 5, and 10 s) for resting and active condition. Participant-specific intercepts have been removed from the data using a linear mixed effects model. Graphs represent the minimum, maximum, median, first quartile, and third quartile in the data set on a logarithmic scale. The trend line is drawn from the second to the last pulse.
Figure 4
Figure 4
The effect of the IPI. Participant-specific intercepts have been removed from the data using a linear mixed effects model. Graphs represent the minimum, maximum, median, first quartile, and third quartile in the data set on a logarithmic scale. ***p ≤ 0.001, Ns, non-significance. (A) Pulses after the first pulse (pulse numbers 2–30) show a difference in the MEP amplitudes in the resting condition but not in the active condition. In the resting condition, the MEP amplitude of the 2 s IPI differs significantly from those of the 5 and 10 s IPIs (p < 0.001). In the active condition, there is no significant difference between the MEP amplitudes of different IPIs (p >0.1). (B) Boxplot illustration of the length of the silent period for different IPIs in the active condition. A Wilcoxon signed-rank test with a Bonferroni adjustment shows no support for significant differences between the different IPIs (all p = 1).

References

    1. Bungert A., Antunes A., Espenhahn S., Thielscher A. (2017). Where does TMS stimulate the motor cortex? combining electrophysiological measurements and realistic field estimates to reveal the affected cortex position. Cereb. Cortex 27, 5083–5094. 10.1093/cercor/bhw292 - DOI - PubMed
    1. Çan M. K., Laakso I., Nieminen J. O., Murakami T., Ugawa Y. (2018). Coil model comparison for cerebellar transcranial magnetic stimulation. Biomed. Phys. Eng. Exp.. 5, 015020. 10.1088/2057-1976/aaee5b - DOI
    1. Chen R., Classen J., Gerloff C., Celnik P., Wassermann E., Hallett M., et al. . (1997). Depression of motor cortex excitability by low-frequency transcranial magnetic stimulation. Neurology 48, 1398–1403. - PubMed
    1. Dale A. M., Fischl B., Sereno M. I. (1999). Cortical surface-based analysis: I. segmentation and surface reconstruction. NeuroImage 9, 179–194. - PubMed
    1. Darling W. G., Wolf S. L., Butler A. J. (2006). Variability of motor potentials evoked by transcranial magnetic stimulation depends on muscle activation. Exp. Brain Res. 174, 376–385. 10.1007/s00221-006-0468-9 - DOI - PMC - PubMed

LinkOut - more resources