. 2022 Mar 15:10:874043.
doi: 10.3389/fcell.2022.874043. eCollection 2022.

Nicotinic Acid Adenine Dinucleotide Phosphate Induces Intracellular Ca2+ Signalling and Stimulates Proliferation in Human Cardiac Mesenchymal Stromal Cells

Affiliations

Nicotinic Acid Adenine Dinucleotide Phosphate Induces Intracellular Ca2+ Signalling and Stimulates Proliferation in Human Cardiac Mesenchymal Stromal Cells

Pawan Faris et al. Front Cell Dev Biol. .

Abstract

Nicotinic acid adenine dinucleotide phosphate (NAADP) is a newly discovered second messenger that gates two pore channels 1 (TPC1) and 2 (TPC2) to elicit endo-lysosomal (EL) Ca2+ release. NAADP-induced lysosomal Ca2+ release may be amplified by the endoplasmic reticulum (ER) through the Ca2+-induced Ca2+ release (CICR) mechanism. NAADP-induced intracellular Ca2+ signals were shown to modulate a growing number of functions in the cardiovascular system, but their occurrence and role in cardiac mesenchymal stromal cells (C-MSCs) is still unknown. Herein, we found that exogenous delivery of NAADP-AM induced a robust Ca2+ signal that was abolished by disrupting the lysosomal Ca2+ store with Gly-Phe β-naphthylamide, nigericin, and bafilomycin A1, and blocking TPC1 and TPC2, that are both expressed at protein level in C-MSCs. Furthermore, NAADP-induced EL Ca2+ release resulted in the Ca2+-dependent recruitment of ER-embedded InsP3Rs and SOCE activation. Transmission electron microscopy revealed clearly visible membrane contact sites between lysosome and ER membranes, which are predicted to provide the sub-cellular framework for lysosomal Ca2+ to recruit ER-embedded InsP3Rs through CICR. NAADP-induced EL Ca2+ mobilization via EL TPC was found to trigger the intracellular Ca2+ signals whereby Fetal Bovine Serum (FBS) induces C-MSC proliferation. Furthermore, NAADP-evoked Ca2+ release was required to mediate FBS-induced extracellular signal-regulated kinase (ERK), but not Akt, phosphorylation in C-MSCs. These finding support the notion that NAADP-induced TPC activation could be targeted to boost proliferation in C-MSCs and pave the way for future studies assessing whether aberrant NAADP signaling in C-MSCs could be involved in cardiac disorders.

Keywords: cardiac mesenchymal stem cells; membrane contact sites; nicotinic acid adenine dinucleotide phosphate (NAADP); proliferation; store operated Ca2+ entry; two-pore channels (TPCs).


Conflict of interest statement

The authors declare that the research was conducted in the absence of any commercial or financial relationships that could be construed as a potential conflict of interest.

Figures

FIGURE 1
FIGURE 1
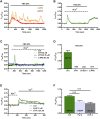
NAADP induces intracellular Ca2+ signals by mobilizing lysosomal Ca2+ in C-MSCs. (A) Exogenous administration of NAADP-AM (1 µM) indues either intracellular Ca2+ oscillations or a transient increase in [Ca2+]i. (B) In absence of external Ca2+ (0Ca2+), NAADP-AM (1 µM) induced only a transient increase in [Ca2+]i, whereas subsequent restitution of extracellular Ca2+ after the full recovery of [Ca2+]i to the baseline resulted in a second Ca2+ signal that was due to extracellular Ca2+ entry. (C) Mean ± SE of the amplitude of the peak Ca2+ response to NAADP in the presence and absence of extracellular Ca2+. Student’s t-test: ***p < 0.001. (D) Mean ± SE of the amplitude of NAADP-induced intracellular Ca2+ release and SOCE. (E) Disrupting the lysosomal Ca2+ store with GPN (200 μM, 30 min), nigericin (50 μM, 30 min) or bafilomycin A1 (1 μM, 30 min) severely affected the intracellular Ca2+ response to NAADP-AM. (F) Mean ± SE of the amplitude of the peak Ca2+ response to NAADP-AM in the absence and in the presence of GPN, nigericin (Nig), or bafilomycin A1 (Baf). One-Way Anova followed by the post-hoc Dunnett’s test: ***p < 0.001.
FIGURE 2
FIGURE 2
Two-pore channels (TPCs) mediate NAADP-induced lysosomal Ca2+ release in C-MSCs. (A) TPC1 and TPC2 gene expression in total RNA extracts of C-MSCs. qRT-PCR data are shown as transcript abundance (genes threshold cycles [Ct] with respect to the house-keeping gene GAPDH). n = 4/group. Student’s t-test: ***p < 0.001. (B) Western Blot analysis of TPC1 and TPC2 proteins in total cellular extracts. n = 3/group. (C) The Ca2+ response to NAADP-AM was suppressed by incubating the cells with the following TPC inhibitors: NED-19 (100 μM, 30 min), NED-K (10 μM, 30 min), and tetrandrine (10 μM, 30 min). (D) Mean ± SE of the amplitude of the peak Ca2+ response to NAADP in the absence (Ctrl) and in the presence of NED-19, NED-K and tetrandrine (Tetra). Student’s t-test: ***p < 0.001.
FIGURE 3
FIGURE 3
InsP3Rs support the Ca2+ response to NAADP. (A) Administration of NAADP-AM (1 µM) after the pharmacological depletion of the ER Ca2+ pool with CPA (30 μm, 30 min) failed to induce intracellular Ca2+ release. CPA induced a transient increase in [Ca2+]i that reflects passive ER Ca2+ leakage from the ER. (B) The intracellular Ca2+ transient evoked by NAADP-AM (1 µM) in the absence of extracellular Ca2+ (0Ca2+) under control conditions. (C) The intracellular Ca2+ release evoked by NAADP-AM (1 µM) under control (Ctrl) conditions was severely affected by blocking InsP3Rs with 2-APB (50 μm, 30 min) or inhibiting PLC activity with U73122 (10 μm, 10 min). (D) Mean ± SE of the amplitude of the peak intracellular Ca2+ response to NAADP-AM under the designated treatments. Student’s t-test: ***p < 0.001.
FIGURE 4
FIGURE 4
Ultrastructural analysis of C-MSCs. Several examples of membrane contacts between lysosomes (Ly) and ER are shown. (A) Note the closeness of the lysosomes with the cell nucleus and ER. Scale bar: 1 µm. (B) The lysosome-ER contact site is indicated (arrow and inset). Scale bar: 1 μm; inset scale bar: 100 nm. (C) The arrow indicates the membrane contact site. Scale bar: 500 nm. (D) Extensive contact (arrows) between the lysosomal and the ER membranes. Scale bar: 500 nm. (E) Note the contact (arrows) between the ribosomes-rich ER and the lysosome. Scale bar: 200 nm. (F) Two close lysosomes; the one on the right is in tight contact with the ER (arrows and inset). Scale bar: 1 μm; inset scale bar: 100 nm.
FIGURE 5
FIGURE 5
NAADP-AM-induced lysosomal Ca2+ mobilization is functionally coupled to SOCE in C-MSCs. (A) The influx of extracellular Ca2+ evoked by NAADP-AM (1 µM) upon depletion of intracellular Ca2+ stores (Ctrl) was severely affected by inhibiting SOCE with Pyr6 (10 μM, 10 min) or BTP-2 (20 μm, 20 min). The previous NAADP-AM-evoked endogenous Ca2+ release has not been shown. (B) Mean ± SE of the amplitude of NAADP-AM-evoked Ca2+ entry evoked by nigericin in the absence (Ctrl) and presence of Pyr-6 and BTP-2. Student’s t-test: ***p < 0.001. (C) Nigericin-evoked extracellular Ca2+ entry was attenuated or inhibited by, respectively, blocking SOCE with BTP-2 (20 μM, 20 min) or Pyr6 (10 μM, 10 min). (D) Mean ± SE of the amplitude of Ca2+ entry evoked by nigericin in the absence (Ctrl) and presence of Pyr-6 and BTP-2. Student’s t-test: ***p < 0.001.
FIGURE 6
FIGURE 6
Fetal bovine serum (FBS)-induces intracellular Ca2+ release from endogenous stores and enhance SOCE. (A) 20% FBS induced oscillatory or transient increases in [Ca2+]i. (B) Under 0Ca2+ conditions, 20% FBS induced a transient elevation in [Ca2+]i. Subsequent re-addition of extracellular Ca2+, 100 s after agonist removal from the bath, resulted in a second bump in [Ca2+]i that was indicative of SOCE. (C) The intracellular Ca2+ release evoked by 20% FBS (Ctrl) was inhibited by depleting the ER Ca2+ pool with CPA (30 μM, 30 min), by blocking InsP3Rs with 2-APB (50 μM, 30 min), or inhibiting PLC with U73122 (10 μM, 10 min). (D) Mean ± SE of the amplitude of the peak intracellular Ca2+ response to 20% FBS under the designated treatments. (E) Subsequent to store depletion by 20% of FBS application (data are not shown her(E), FBS were washed out from bath, then extracellular Ca2+ added to the bath to bath in the presence and absence of SOCE inhibitors, Pyr6 (10 μm, 10 min) or BTP-2 (20 μm, 20 min). (F) Mean ± SE of the amplitude of Ca2+ entry evoked by 20% FBS in the absence (Ctrl) and presence of Pyr6 and BTP-2. The asterisk indicates ***p < 0.001.
FIGURE 7
FIGURE 7
TPCs mediate 20% FBS-induced intracellular Ca2+ release. (A) Intracellular Ca2+ release induced by 20% FBS was abolished upon depletion of the lysosomal Ca2+ pool with either GPN (200 μM, 30 min) or nigericin (50 μM, 30 min). (B) Mean ± SE of the amplitude of the intracellular Ca2+ peak evoked by 20% FBS under the designated treatments. (C) 20% FBS induced an intracellular Ca2+ transient that was significantly reduced or inhibited by blocking TPCs with, respectively, NED-K (10 μM, 30 min), tetrandrine (10 μM, 30 min) or NED-19 (100 μM, 30 min). (D) Mean ± SE of the amplitude of the intracellular Ca2+ peak evoked by 20% FBS in the absence (Ctrl) or presence of NED-19, NED-K or tetrandrine (Tetra). Student’s t-test: ***p < 0.001.
FIGURE 8
FIGURE 8
TPCs mediate 20% FBS-induced proliferation and ERK phosphorylation in C-MSCs. Following 4 h of growth without serum, cells were treated with NED-19 (100 μM, 30 min) and subsequently stimulated with 20% FBS. (A) Following 24 and 48 h of FBS stimulation, the medium was removed, cells detached from the plates, and counted by hemocytometer (n = 3/group). Student’s t-test: *p < 0.05. (B) The cells were lysate after 60 min of FBS stimulation. Total protein extract from treated cells was subjected to Western blot analysis to visualize active phosphorylated form and total of ERK and AKT using specific antibodies. Phospho-ERK1/2 and Phospho-AKT levels were corrected by total ERK1/2 and AKT densitometry respectively. (C) Western blot data are presented as the fold change of target protein expression. The results are expressed as mean ± SEM (n = 3/group). Student’s t-test: *p < 0.05.

Similar articles

Cited by

References

    1. Adapala R. K., Kanugula A. K., Paruchuri S., Chilian W. M., Thodeti C. K. (2020). TRPV4 Deletion Protects Heart from Myocardial Infarction-Induced Adverse Remodeling via Modulation of Cardiac Fibroblast Differentiation. Basic Res. Cardiol. 115, 14. 10.1007/s00395-020-0775-5 - DOI - PMC - PubMed
    1. Atakpa P., Van Marrewijk L. M., Apta-Smith M., Chakraborty S., Taylor C. W. (2019). GPN Does Not Release Lysosomal Ca2+ but Evokes Ca2+ Release from the ER by Increasing the Cytosolic pH Independently of Cathepsin C. J. Cel Sci 132. 10.1242/jcs.223883 - DOI - PMC - PubMed
    1. Bagno L., Hatzistergos K. E., Balkan W., Hare J. M. (2018). Mesenchymal Stem Cell-Based Therapy for Cardiovascular Disease: Progress and Challenges. Mol. Ther. 26, 1610–1623. 10.1016/j.ymthe.2018.05.009 - DOI - PMC - PubMed
    1. Balducci V., Faris P., Balbi C., Costa A., Negri S., Rosti V., et al. (2021). The Human Amniotic Fluid Stem Cell Secretome Triggers Intracellular Ca2+ Oscillations, NF‐κB Nuclear Translocation and Tube Formation in Human Endothelial colony‐forming Cells. J. Cel Mol Med 25, 8074–8086. 10.1111/jcmm.16739 - DOI - PMC - PubMed
    1. Bartlett P. J., Cloete I., Sneyd J., Thomas A. P. (2020). IP3-Dependent Ca2+ Oscillations Switch into a Dual Oscillator Mechanism in the Presence of PLC-Linked Hormones. iScience 23, 101062. 10.1016/j.isci.2020.101062 - DOI - PMC - PubMed