In Situ Analysis of mTORC1/C2 and Metabolism-Related Proteins in Pediatric Osteosarcoma
- PMID: 35392503
- PMCID: PMC8980219
- DOI: 10.3389/pore.2022.1610231
In Situ Analysis of mTORC1/C2 and Metabolism-Related Proteins in Pediatric Osteosarcoma
Abstract
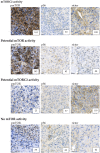
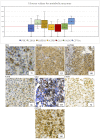
Activation of the mTOR pathway has been observed in osteosarcoma, however the inhibition of mammalian target of rapamycin (mTOR) complex 1 has had limited results in osteosarcoma treatment. Certain metabolic pathways can be altered by mTOR activation, which can affect survival. Our aim was to characterize the mTOR profile and certain metabolic alterations in pediatric osteosarcoma to determine the interactions between the mTOR pathway and metabolic pathways. We performed immunohistochemistry on 28 samples to analyze the expression of mTOR complexes such as phospho-mTOR (pmTOR), phosphorylated ribosomal S6 (pS6), and rapamycin-insensitive companion of mTOR (rictor). To characterize metabolic pathway markers, we investigated the expression of phosphofructokinase (PFK), lactate dehydrogenase-A (LDHA), β-F1-ATPase (ATPB), glucose-6-phosphate dehydrogenase (G6PDH), glutaminase (GLS), fatty acid synthetase (FASN), and carnitin-O-palmitoyltransferase-1 (CPT1A). In total, 61% of the cases showed low mTOR activity, but higher pmTOR expression was associated with poor histological response to chemotherapy and osteoblastic subtype. Rictor expression was higher in metastatic disease and older age at the time of diagnosis. Our findings suggest the importance of the Warburg-effect, pentose-phosphate pathway, glutamine demand, and fatty-acid beta oxidation in osteosarcoma cells. mTOR activation is linked to several metabolic pathways. We suggest performing a detailed investigation of the mTOR profile before considering mTORC1 inhibitor therapy. Our findings highlight that targeting certain metabolic pathways could be an alternative therapeutic approach.
Keywords: mTOR; metabolic; metabolic adaptation; osteosarcoma; pathways; pediatric.
Copyright © 2022 Mohás, Krencz, Váradi, Arató, Felkai, Kiss, Moldvai, Sebestyén and Csóka.
Conflict of interest statement
The authors declare that the research was conducted in the absence of any commercial or financial relationships that could be construed as a potential conflict of interest.
Figures


References
-
- Pizzo PA, Poplack DG. Principles and Practice of Pediatric Oncology. 7th ed. Philadelphia PA ,USA: Lippincott Williams and Wilkins; (2015).
-
- Smeland S, Bielack SS, Whelan J, Bernstein M, Hogendoorn P, Krailo MD, et al. Survival and Prognosis with Osteosarcoma: Outcomes in More Than 2000 Patients in the EURAMOS-1 (European and American Osteosarcoma Study) Cohort. Eur J Cancer (2019) 109:36–50. 10.1016/j.ejca.2018.11.027 - DOI - PMC - PubMed
MeSH terms
Substances
LinkOut - more resources
Full Text Sources
Medical
Miscellaneous

