. 2022 Mar 22:13:801656.
doi: 10.3389/fpls.2022.801656. eCollection 2022.

Modulated Light Dependence of Growth, Flowering, and the Accumulation of Secondary Metabolites in Chilli

Affiliations

Modulated Light Dependence of Growth, Flowering, and the Accumulation of Secondary Metabolites in Chilli

Eva Darko et al. Front Plant Sci. .

Abstract

Chili is widely used as a food additive and a flavouring and colouring agent and also has great importance in health preservation and therapy due to the abundant presence of many bioactive compounds, such as polyphenols, flavonoids, carotenoids, and capsaicinoids. Most of these secondary metabolites are strong antioxidants. In the present study, the effect of light intensity and spectral composition was studied on the growth, flowering, and yield of chilli together with the accumulation of secondary metabolites in the fruit. Two light intensities (300 and 500 μmol m-2 s-1) were applied in different spectral compositions. A broad white LED spectrum with and without FR application and with blue LED supplement was compared to blue and red LED lightings in different (80/20 and 95/5%) blue/red ratios. High light intensity increased the harvest index (fruit yield vs. biomass production) and reduced the flowering time of the plants. The amount of secondary metabolites in the fruit varied both by light intensity and spectral compositions; phenolic content and the radical scavenging activity were stimulated, whereas capsaicin accumulation was suppressed by blue light. The red colour of the fruit (provided by carotenoids) was inversely correlated with the absolute amount of blue, green, and far-red light. Based on the results, a schematic model was created, representing light-dependent metabolic changes in chilli. The results indicated that the accumulation of secondary metabolites could be modified by the adjustment of light intensity and spectral composition; however, different types of metabolites required different light environments.

Keywords: LED lighting; capsaicine; chilli; flavonoids; secondary metabolites.


Conflict of interest statement

The authors declare that the research was conducted in the absence of any commercial or financial relationships that could be construed as a potential conflict of interest.

Figures

FIGURE 1
FIGURE 1
Flowering under different light regimens: (A) Application of red and blue LEDs with a 95:5 ratio at moderate (300 μmol m–2 s–1) light intensity; (B) utilisation of red and blue LEDs with a 80:20 ratio at (300 μmol m–2 s–1) light intensity; (C) a wide spectrum with an average proportion of 65:20:15 of red:green:blue at moderate (300 μmol m–2 s–1) light intensity: (D) a wide spectrum supplemented with far-red application in an average proportion of 65:20:15:0.6 of red:green:blue:far-red at moderate (300 μmol m–2 s–1) light intensity; (E) a wide spectrum supplemented with far-red application in an average proportion of 65:20:15:0.6 of red:green:blue:far-red at high (500 μmol m–2 s–1) light intensity; (F) a wide spectrum supplemented with far-red and blue light application in an average proportion of 64:20:16:0.6 of red:green:blue:far-red at high (500 μmol m–2 s–1) light intensity.
FIGURE 2
FIGURE 2
Carotenoid (A) and total phenolic content (B), and an antioxidant capacity of the fruit (C). Light conditions used: (A) Application of red and blue LEDs with a 95:5 ratio at moderate (300 μmol m–2 s–1) light intensity; (B), utilisation of red and blue LEDs with an 80:20 ratio at (300 μmol m–2 s–1) light intensity; (C) a wide spectrum with an average proportion of 65:20:15 of red:green:blue at moderate (300 μmol m–2 s–1) light intensity: (D) a wide spectrum supplemented with far-red application in an average proportion of 65:20:15:0.6 of red:green:blue:far-red at moderate (300 μmol m–2 s–1) light intensity; (E), a wide spectrum supplemented with far-red application in an average proportion of 65:20:15:0.6 of red:green:blue:far-red at high (500 μmol m–2 s–1) light intensity; (F) a wide spectrum supplemented with far-red and blue light application in an average proportion of 64:20:16:0.6 of red:green:blue:far-red at high (500 μmol m–2 s–1) light intensity.
FIGURE 3
FIGURE 3
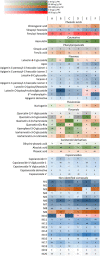
A heat map representing the accumulation of phenolic compounds in the fruit. Different colours represent different concentration ranges. Differences between the values (within the rows) are indicated by different letters. The significance was determined at the p < 0.05 level, using Tukey’ s post-hoc test. Light conditions used: (A) application of red and blue LEDs with a 95:5 ratio at moderate (300 μmol m–2 s–1) light intensity; (B) utilisation of red and blue LEDs with an 80:20 ratio at (300 μmol m–2 s–1) light intensity; (C) a wide spectrum with an average proportion of 65:20:15 of red:green:blue at moderate (300 μmol m–2 s–1) light intensity: (D) a wide spectrum supplemented with far-red application in an average proportion of 65:20:15:0.6 of red:green:blue:far-red at moderate (300 μmol m–2 s–1) light intensity; (E) a wide spectrum supplemented with far-red application in an average proportion of 65:20:15:0.6 of red:green:blue:far-red at high (500 μmol m–2 s–1) light intensity; (F) a wide spectrum supplemented with far-red and blue light application in an average proportion of 64:20:16:0.6 of red:green:blue:far-red at high (500 μmol m–2 s–1) light intensity.
FIGURE 4
FIGURE 4
Correlation analysis between the light conditions and all studied parameters of chilli. The absolute and relative amounts of different light regions were integrated daily (DLI) and used as indicated in Table 1. The blue colour indicates negative (inverse), whereas red colour represents positive (direct) correlations, and more intense colour shows higher correlation. The “r” values are also presented. The bold values show the significance level at the p < 0.05 level.
FIGURE 5
FIGURE 5
Schematic representation of different secondary metabolic pathways focusing on the metabolites found in the chilli fruit. The effects of light observed in the present experiments are also indicated. The scheme is based on the KEGG database (maps 00998, 00941, 00940, and 01060).

References

    1. Acunha T., dos S., Crizel R. L., Tavares I. B., Barbieri R. L., de Pereira C. M. P., et al. (2017). Bioactive compound variability in a Brazilian Capsicum pepper collection. Crop Sci. 57 1611–1623. 10.2135/cropsci2016.08.0701 - DOI - PubMed
    1. Al Murad M., Razi K., Jeong B. R., Samy P. M. A., Muneer S. (2021). Light emitting diodes (Leds) as agricultural lighting: impact and its potential on improving physiology, flowering, and secondary metabolites of crops. Sustainability 13 1–25. 10.3390/su13041985 - DOI
    1. Antonio A. S., Wiedemann L. S. M., Veiga Junior V. F. (2018). The genus: Capsicum: a phytochemical review of bioactive secondary metabolites. RSC Adv. 8 25767–25784. 10.1039/c8ra02067a - DOI - PMC - PubMed
    1. Claypool N. B., Lieth J. H. (2020). Physiological responses of pepper seedlings to various ratios of blue, green, and red light using LED lamps. Sci. Hortic. 268:109371. 10.1016/j.scienta.2020.109371 - DOI
    1. Darko E., Heydarizadeh P., Schoefs B., Sabzalian M. R. (2014). Photosynthesis under artificial light: the shift in primary and secondary metabolism. Philos. Trans. R. Soc. B Biol. Sci. 369:20130243. 10.1098/rstb.2013.0243 - DOI - PMC - PubMed

LinkOut - more resources