. 2022 Apr 22;7(4):1222-1234.
doi: 10.1021/acssensors.2c00394. Epub 2022 Apr 7.

Glucose-to-Resistor Transduction Integrated into a Radio-Frequency Antenna for Chip-less and Battery-less Wireless Sensing

Affiliations

Glucose-to-Resistor Transduction Integrated into a Radio-Frequency Antenna for Chip-less and Battery-less Wireless Sensing

Atefeh Shafaat et al. ACS Sens. .

Abstract

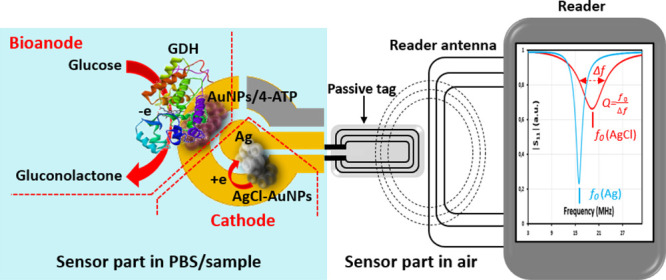
To maximize the potential of 5G infrastructure in healthcare, simple integration of biosensors with wireless tag antennas would be beneficial. This work introduces novel glucose-to-resistor transduction, which enables simple, wireless biosensor design. The biosensor was realized on a near-field communication tag antenna, where a sensing bioanode generated electrical current and electroreduced a nonconducting antenna material into an excellent conductor. For this, a part of the antenna was replaced by a Ag nanoparticle layer oxidized to high-resistance AgCl. The bioanode was based on Au nanoparticle-wired glucose dehydrogenase (GDH). The exposure of the cathode-bioanode to glucose solution resulted in GDH-catalyzed oxidation of glucose at the bioanode with a concomitant reduction of AgCl to highly conducting Ag on the cathode. The AgCl-to-Ag conversion strongly affected the impedance of the antenna circuit, allowing wireless detection of glucose. Mimicking the final application, the proposed wireless biosensor was ultimately evaluated through the measurement of glucose in whole blood, showing good agreement with the values obtained with a commercially available glucometer. This work, for the first time, demonstrates that making a part of the antenna from the AgCl layer allows achieving simple, chip-less, and battery-less wireless sensing of enzyme-catalyzed reduction reaction.

Keywords: Internet of Things; chip-less wireless sensing; direct electron transfer; glucose dehydrogenase; wireless detection of glucose.


Conflict of interest statement

The authors declare no competing financial interest.

Figures

Scheme 1
Scheme 1. Conceptual Illustration of a Battery-less and Chip-less Biosensor Tag for Wireless Measurement of Glucose in Solution
The design is comprised of (i) a bioanode, (ii) a cathode layer, and (iii) a passive tag antenna, with a 5 mm removed antenna line, allowing connection of two electrodes of SPE, bridged by the cathodic transduction layer. The bioanode is based on glucose dehydrogenase in direct electron transfer contact with one of SPE electrodes. The cathode layer contains AgNPs, which were electrooxidized to AgCl before measurements of glucose. The SPE-antenna coupling makes the cathode layer a part of the tag antenna circuit. The tag reader wirelessly reads the impedance characteristics of the antenna circuit, which are represented by the reflection spectrum, |S11|. This |S11| provides easy reading of the characteristic frequency, f0, and the corresponding Q-factor of the antenna circuit. Determining the change of the f0 and Q-factor makes it possible to monitor the resistance change of the transduction layer when the AgCl layer transforms to metallic Ag. This transformation happens when the SPE is exposed to glucose solution, since oxidation of glucose on the bioanode reduces AgCl to Ag on the cathode. The SPE-tag antenna connection thus allows wireless detection of glucose.
Figure 1
Figure 1
(A) Cyclic voltammograms of GE/AuNP/4-ATP/GDH- and GCE/PEI/AuNP/4-ATP/GDH-modified bioanode electrodes recorded in PBS, pH 7.4, in the absence and presence of glucose (50 mM). Potential scan rate of 1 mV s–1 starting at −0.3 V. (B) Open-circuit potential (OCP) recorded for the AuNP/4-ATP/GDH electrode before and after addition of 50 mM glucose. (C) Schematic presentation of connection of the bioanode (GDH-modified) and the cathode (SPE hosting the AgCl-containing transduction layer). (D) Amperometric curves (current vs time) obtained with the electrodes, connected as shown in panel (C) and immersed in PBS. Glucose addition gave a 50 mM glucose concentration in PBS. This allowed the electrons, generated at the bioanode, to convert AgCl to Ag on the cathode layer. The AgCl/Ag conversion is obvious from the increase in current through the cathodic transduction layer (red trace). The control experiment shows that the bioanode without GDH was not able to convert AgCl to Ag; the current through the transduction layer is the same after the addition of glucose (blue trace).
Figure 2
Figure 2
(A) Dependence of the reflection coefficient |S11| on frequency recorded with wireless biosensor configuration shown in Scheme 1. The curves are recorded for the biosensor setup where the transduction layer on the SPE was comprised of only AgNPs converted to AgCl (marked with AgCl) and after the AgCl reduction to metallic Ag (marked with Ag) by the bioanode. (B) Change of characteristic frequency of the wireless biosensor as a response to 4 mM glucose (time zero represent time when glucose was added into the measurement cell). Notes indicate the composition of the transduction layers and their resistances after the AgNP oxidation to AgCl. (C) |S11| vs frequency recorded for the biosensor where the transduction layer was comprised (marked with AgCl) of AuNP-AgNP mixture with the AgNPs converted to AgCl and (marked with Ag) after the AgCl reduction to metallic Ag. The reduction reactions were driven by the bioanode in the presence of 4 mM glucose in PBS. Different |S11| curves reflect monotonic |S11| transition in time. The corresponding f0 vs t trace is shown in panel (B), curve 2. (D) Calibration curve, i.e., the inverse response time of the biosensor tag vs glucose concentration in PBS. The transduction layer was comprised of AgNP-AuNP mixture where AgNPs were electrochemically oxidized to AgCl. The wireless biosensor configuration is depicted in Scheme 1, where only the SPE with the bioanode and cathode (the transduction layer) was in solution during the measurements of glucose.
Figure 3
Figure 3
(A) Responses of the biosensor to 6 mM glucose in phosphate buffer containing different concentrations of KCl. The response was recorded using amperometric measurement mode with the electrode connection shown in Figure 1C. The transduction layer was made by drop-casting AgNP-AuNP mixture and electrooxidation of AgNPs to AgCl in PBS. Inset: dependence of maximal current that flows through the transduction layer on the chloride concentration present in the solution during the AgCl reduction to Ag by the bioanode. (B) SEM image of the transduction layer comprised of AgNP-AuNP mixture after AgNP oxidation to AgCl. (C) |S11| curves recorded with the tag-SPE system, where the transduction layer was based on AgNPs. The oxidation state of Ag in the layer and the solution in the measurement cell are specified. (D) Equivalent circuit of the biosensor tag. L1, R1, and C1 represent the inductance, resistance, and capacitance of the original tag antenna circuit, respectively. R2 and C2 represent the resistance of the Ag/AgCl transduction layer (including adjacent PBS solution) and the parasitic capacitance of the antenna-SPE connections, respectively.
Figure 4
Figure 4
(A) Characteristic frequency (f0(Ag) and f0(AgCl)) and (B) Q-factor (Q(Ag) and Q(AgCl)) of the antenna with a coupled SPE exposed to air or immersed into solution of different ionic strengths. The SPE hosts a transduction layer comprised of Ag or AgCl. (C) Equivalent circuits representing the antenna circuit and its illustration (tag antenna and the SPE) when the transduction layer on the SPE is exposed to different environmental conditions: air, water, and concentrated or diluted PBS as indicated in the drawings.
Figure 5
Figure 5
(A) Calibration curve, i.e., the inverse response time of the biosensor tag vs glucose concentration in PBS. The transduction layer was comprised of Ag-AuNP mixture electrochemically oxidized to the MΩ level. (B) Result of comparison between the proposed wireless biosensor and the standard method (glucometer) for glucose analysis in the whole blood samples from three different donors. (C) Calibration curve of the wireless biosensor obtained by the standard addition method using whole blood samples. (D) Estimation of the current generated by the enzyme biosensor during successive addition of glucose to the whole blood samples.

References

    1. Bandodkar A. J.; Wang J. Non-invasive wearable electrochemical sensors: a review. Trends Biotechnol. 2014, 32, 363–371. 10.1016/j.tibtech.2014.04.005. - DOI - PubMed
    1. Falk M.; Psotta C.; Cirovic S.; Shleev S. Non-Invasive Electrochemical Biosensors Operating in Human Physiological Fluids. Sensors 2020, 20, 6352–6379. 10.3390/s20216352. - DOI - PMC - PubMed
    1. Boutry C. M.; Chandrahalim H.; Streit P.; Schinhammer M.; Hanzi A. C.; Hierold C. Towards biodegradable wireless implants. Philos. Trans. R. Soc., A 2012, 370, 2418–2432. 10.1098/rsta.2011.0439. - DOI - PubMed
    1. Arefin M. S.; Redoute J. M.; Yuce M. R. Wireless biosensors for POC medical applications. Woodhead Publ. Ser. Biomater. 2017, 118, 151–180.
    1. Mayer M.; Baeumner A. J. A Megatrend Challenging Analytical Chemistry: Biosensor and Chemosensor Concepts Ready for the Internet of Things. Chem. Rev. 2019, 119, 7996–8027. 10.1021/acs.chemrev.8b00719. - DOI - PubMed

Publication types