

Longitudinal profiling of circulating tumour DNA for tracking tumour dynamics in pancreatic cancer
- PMID: 35392854
- PMCID: PMC8991893
- DOI: 10.1186/s12885-022-09387-6
Longitudinal profiling of circulating tumour DNA for tracking tumour dynamics in pancreatic cancer
Abstract
Background: The utility of circulating tumour DNA (ctDNA) for longitudinal tumour monitoring in pancreatic ductal adenocarcinoma (PDAC) has not been explored beyond mutations in the KRAS proto-oncogene. Here, we aimed to characterise and track patient-specific somatic ctDNA variants, to assess longitudinal changes in disease burden and explore the landscape of actionable alterations.
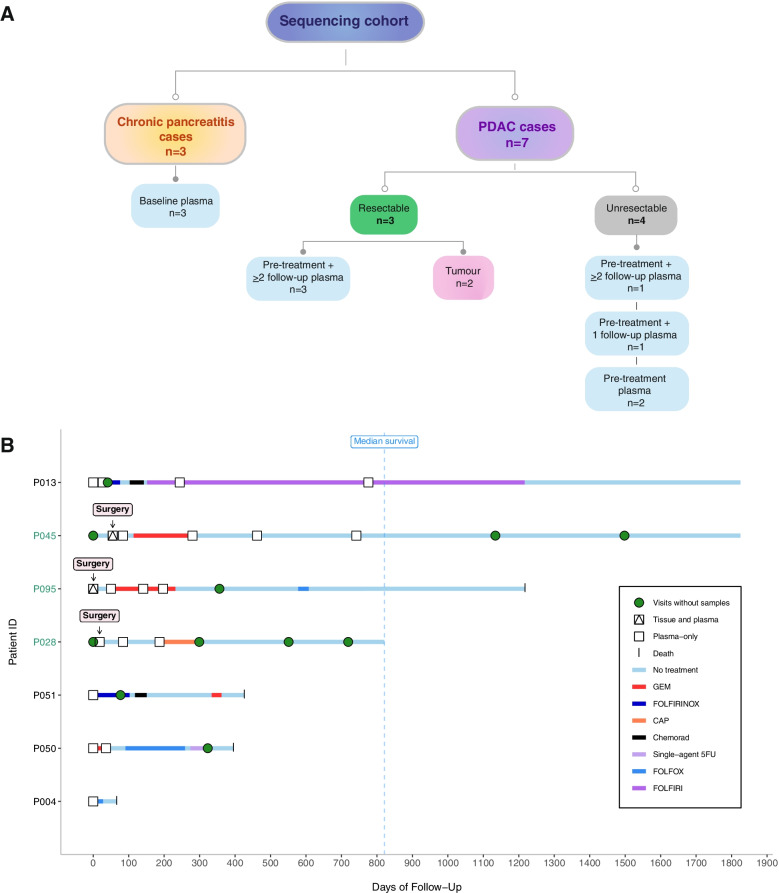
Methods: We followed 3 patients with resectable disease and 4 patients with unresectable disease, including 4 patients with ≥ 3 serial follow-up samples, of whom 2 were rare long survivors (> 5 years). We performed whole exome sequencing of tumour gDNA and plasma ctDNA (n = 20) collected over a ~ 2-year period from diagnosis through treatment to death or final follow-up. Plasma from 3 chronic pancreatitis cases was used as a comparison for analysis of ctDNA mutations.
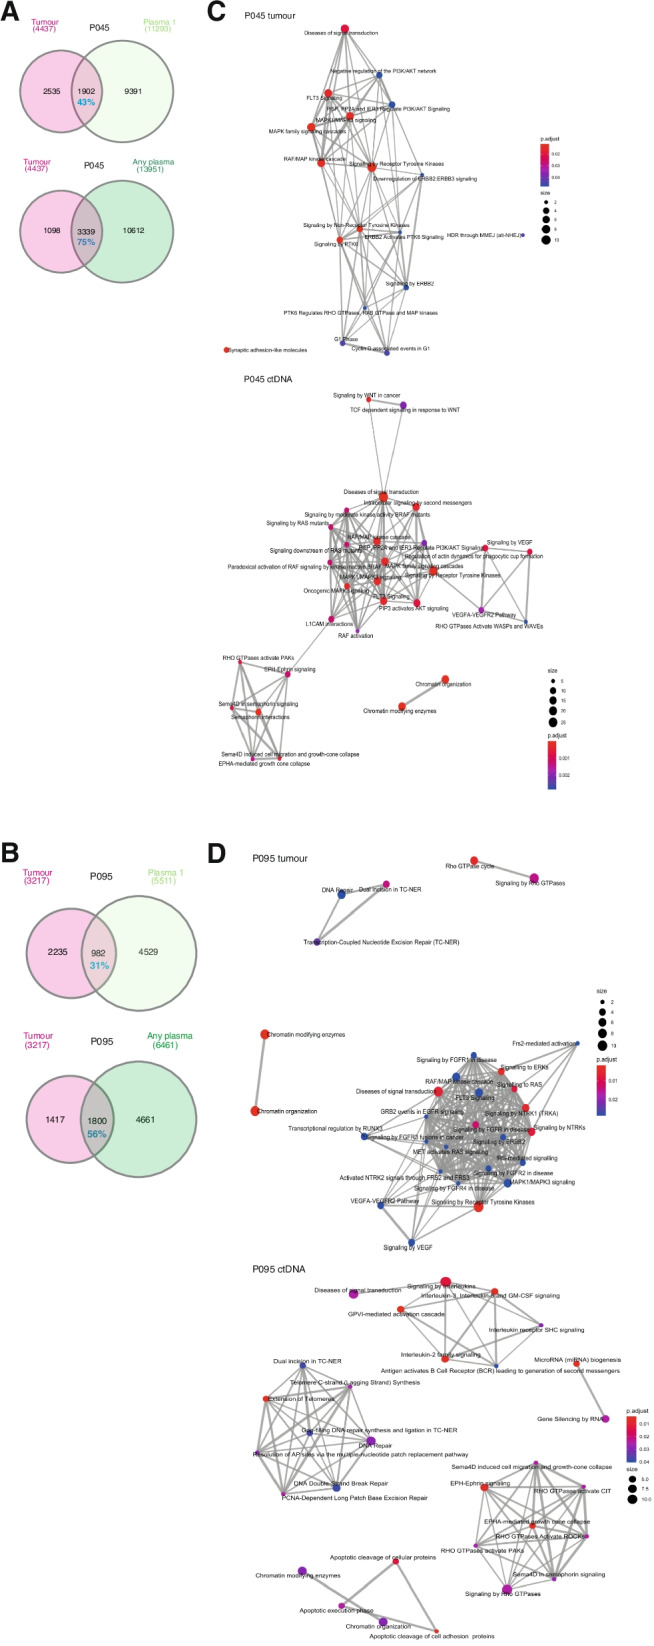
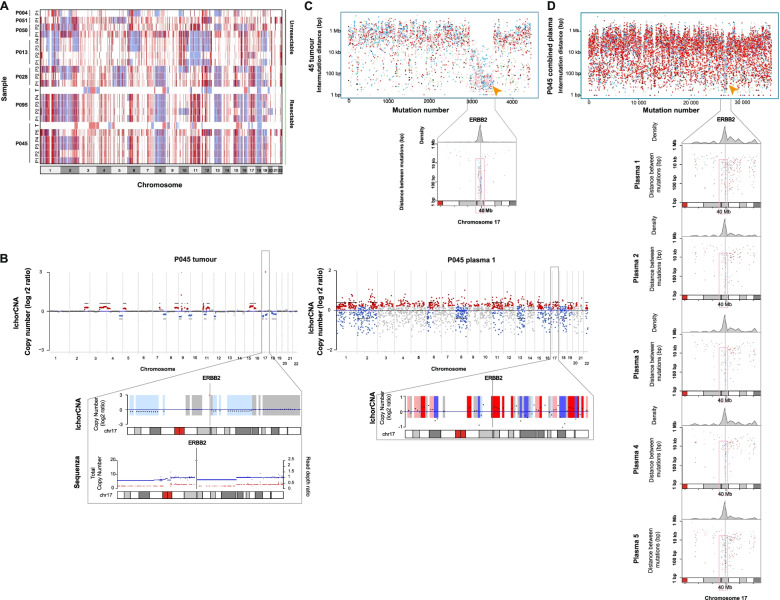
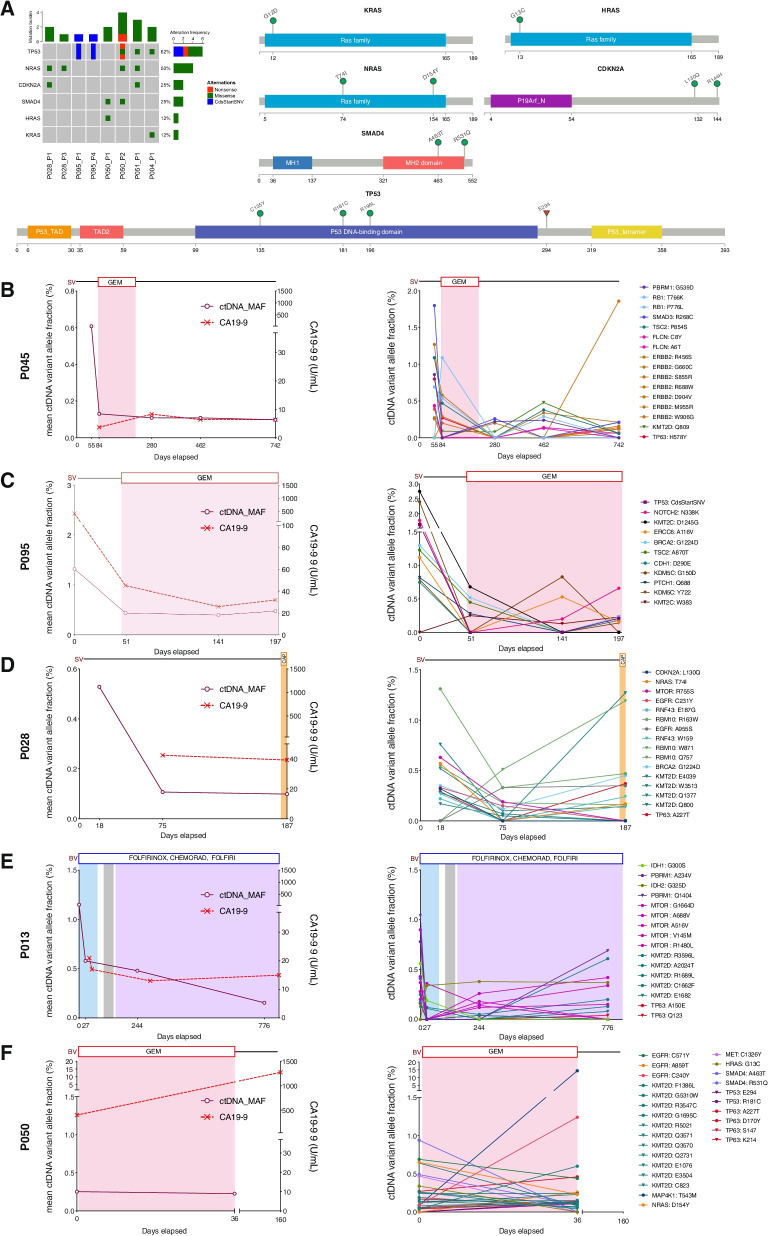
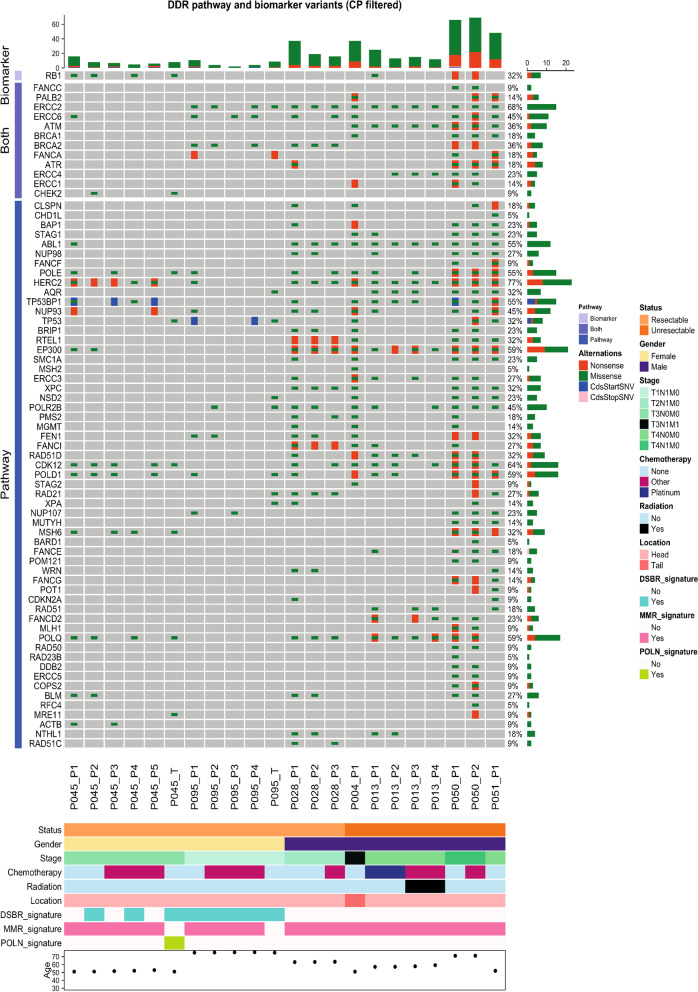
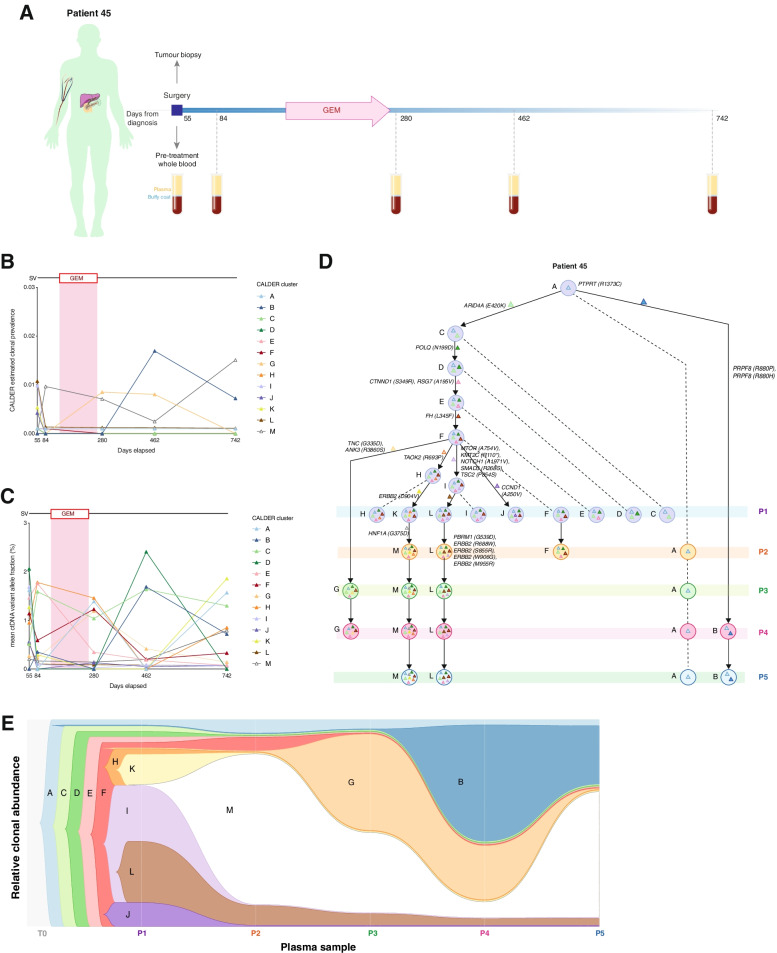
Results: We detected > 55% concordance between somatic mutations in tumour tissues and matched serial plasma. Mutations in ctDNA were detected within known PDAC driver genes (KRAS, TP53, SMAD4, CDKN2A), in addition to patient-specific variants within alternative cancer drivers (NRAS, HRAS, MTOR, ERBB2, EGFR, PBRM1), with a trend towards higher overall mutation loads in advanced disease. ctDNA alterations with potential for therapeutic actionability were identified in all 7 patients, including DNA damage response (DDR) variants co-occurring with hypermutation signatures predictive of response to platinum chemotherapy. Longitudinal tracking in 4 patients with follow-up > 2 years demonstrated that ctDNA mutant allele fractions and clonal trends were consistent with CA19-9 measurements and/or clinically reported disease burden. The estimated prevalence of 'stem clones' was highest in an unresectable patient where changes in ctDNA dynamics preceded CA19-9 levels. Longitudinal evolutionary trajectories revealed ongoing subclonal evolution following chemotherapy.
Conclusion: These results provide proof-of-concept for the use of exome sequencing of serial plasma to characterise patient-specific ctDNA profiles, and demonstrate the sensitivity of ctDNA in monitoring disease burden in PDAC even in unresectable cases without matched tumour genotyping. They reveal the value of tracking clonal evolution in serial ctDNA to monitor treatment response, establishing the potential of applied precision medicine to guide stratified care by identifying and evaluating actionable opportunities for intervention aimed at optimising patient outcomes for an otherwise intractable disease.
Keywords: Biomarkers; Circulating tumour DNA; Liquid biopsy; Monitoring.
© 2022. The Author(s).
Conflict of interest statement
The authors declare that they have no competing interests.
Figures
Similar articles
-
High somatic mutations in circulating tumor DNA predict response of metastatic pancreatic ductal adenocarcinoma to first-line nab-paclitaxel plus S-1: prospective study.J Transl Med. 2024 Feb 20;22(1):184. doi: 10.1186/s12967-024-04989-z. J Transl Med. 2024. PMID: 38378604 Free PMC article.
-
Mutant KRAS Circulating Tumor DNA Is an Accurate Tool for Pancreatic Cancer Monitoring.Oncologist. 2018 May;23(5):566-572. doi: 10.1634/theoncologist.2017-0467. Epub 2018 Jan 25. Oncologist. 2018. PMID: 29371474 Free PMC article.
-
Longitudinal monitoring of KRAS-mutated circulating tumor DNA enables the prediction of prognosis and therapeutic responses in patients with pancreatic cancer.PLoS One. 2019 Dec 31;14(12):e0227366. doi: 10.1371/journal.pone.0227366. eCollection 2019. PLoS One. 2019. PMID: 31891652 Free PMC article.
-
A Review of Circulating Tumor DNA (ctDNA) in Pancreatic Cancer: Ready for the Clinic?J Gastrointest Cancer. 2025 Jan 21;56(1):50. doi: 10.1007/s12029-024-01151-2. J Gastrointest Cancer. 2025. PMID: 39836305 Review.
-
Circulating tumor DNA tracking in patients with pancreatic cancer using next-generation sequencing.Gastroenterol Hepatol. 2022 Oct;45(8):637-644. doi: 10.1016/j.gastrohep.2021.12.011. Epub 2022 Jan 31. Gastroenterol Hepatol. 2022. PMID: 35092761 Review. English, Spanish.
Cited by
-
Advances in the application of extracellular vesicles in precise diagnosis of pancreatic cancer.Eur J Med Res. 2025 Jun 13;30(1):478. doi: 10.1186/s40001-025-02739-5. Eur J Med Res. 2025. PMID: 40514731 Free PMC article. Review.
-
High somatic mutations in circulating tumor DNA predict response of metastatic pancreatic ductal adenocarcinoma to first-line nab-paclitaxel plus S-1: prospective study.J Transl Med. 2024 Feb 20;22(1):184. doi: 10.1186/s12967-024-04989-z. J Transl Med. 2024. PMID: 38378604 Free PMC article.
-
Current Status of the Diagnosis of Early-Stage Pancreatic Ductal Adenocarcinoma.Diagnostics (Basel). 2023 Jan 6;13(2):215. doi: 10.3390/diagnostics13020215. Diagnostics (Basel). 2023. PMID: 36673023 Free PMC article. Review.
-
Clinical and biological markers predictive of treatment response associated with metastatic pancreatic adenocarcinoma.Br J Cancer. 2023 May;128(9):1672-1680. doi: 10.1038/s41416-023-02170-9. Epub 2023 Feb 22. Br J Cancer. 2023. PMID: 36813867 Free PMC article.
-
Liquid Biopsy in Pancreatic Ductal Adenocarcinoma: A Review of Methods and Applications.Int J Mol Sci. 2024 Oct 13;25(20):11013. doi: 10.3390/ijms252011013. Int J Mol Sci. 2024. PMID: 39456796 Free PMC article. Review.
References
-
- Watanabe F, Suzuki K, Tamaki S, Abe I, Endo Y, Takayama Y, et al. Longitudinal monitoring of KRAS-mutated circulating tumor DNA enables the prediction of prognosis and therapeutic responses in patients with pancreatic cancer. PLoS One. 2019;14:e0227366. doi: 10.1371/journal.pone.0227366. - DOI - PMC - PubMed
MeSH terms
Substances
LinkOut - more resources
Full Text Sources
Medical
Research Materials
Miscellaneous
