. 2022 Apr 7;41(1):131.
doi: 10.1186/s13046-022-02294-5.

HIF activation enhances FcγRIIb expression on mononuclear phagocytes impeding tumor targeting antibody immunotherapy

Affiliations

HIF activation enhances FcγRIIb expression on mononuclear phagocytes impeding tumor targeting antibody immunotherapy

Khiyam Hussain et al. J Exp Clin Cancer Res. .

Abstract

Background: Hypoxia is a hallmark of the tumor microenvironment (TME) and in addition to altering metabolism in cancer cells, it transforms tumor-associated stromal cells. Within the tumor stromal cell compartment, tumor-associated macrophages (TAMs) provide potent pro-tumoral support. However, TAMs can also be harnessed to destroy tumor cells by monoclonal antibody (mAb) immunotherapy, through antibody dependent cellular phagocytosis (ADCP). This is mediated via antibody-binding activating Fc gamma receptors (FcγR) and impaired by the single inhibitory FcγR, FcγRIIb.

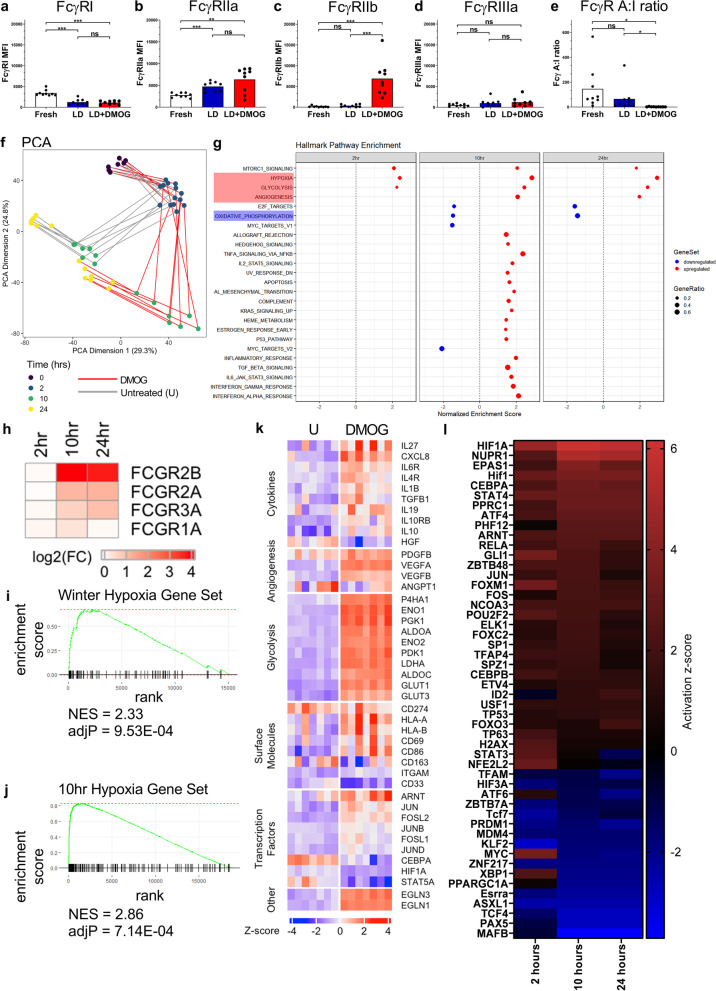
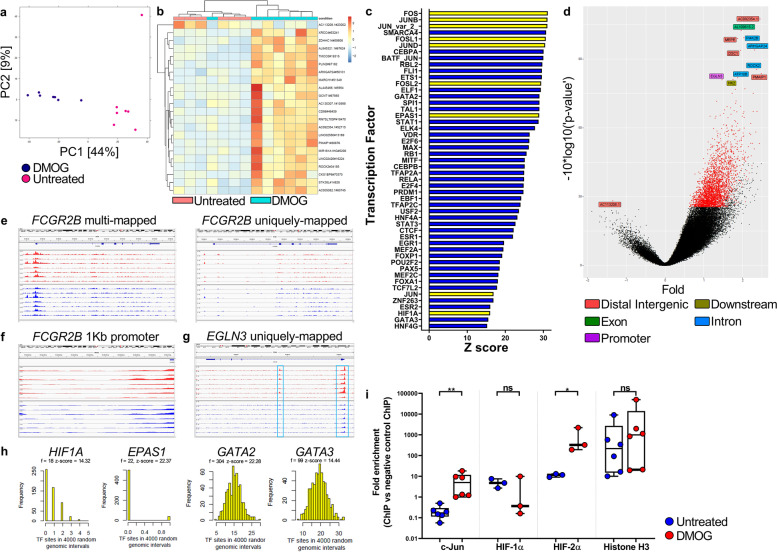
Methods: We applied a multi-OMIC approach coupled with in vitro functional assays and murine tumor models to assess the effects of hypoxia inducible factor (HIF) activation on mAb mediated depletion of human and murine cancer cells. For mechanistic assessments, siRNA-mediated gene silencing, Western blotting and chromatin immune precipitation were utilized to assess the impact of identified regulators on FCGR2B gene transcription.

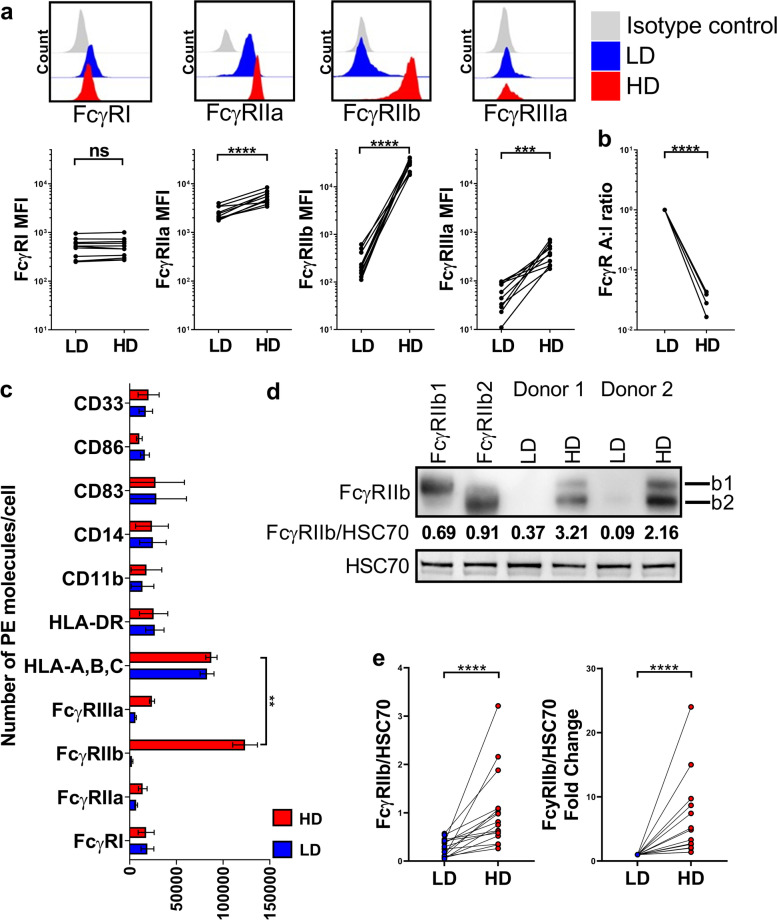
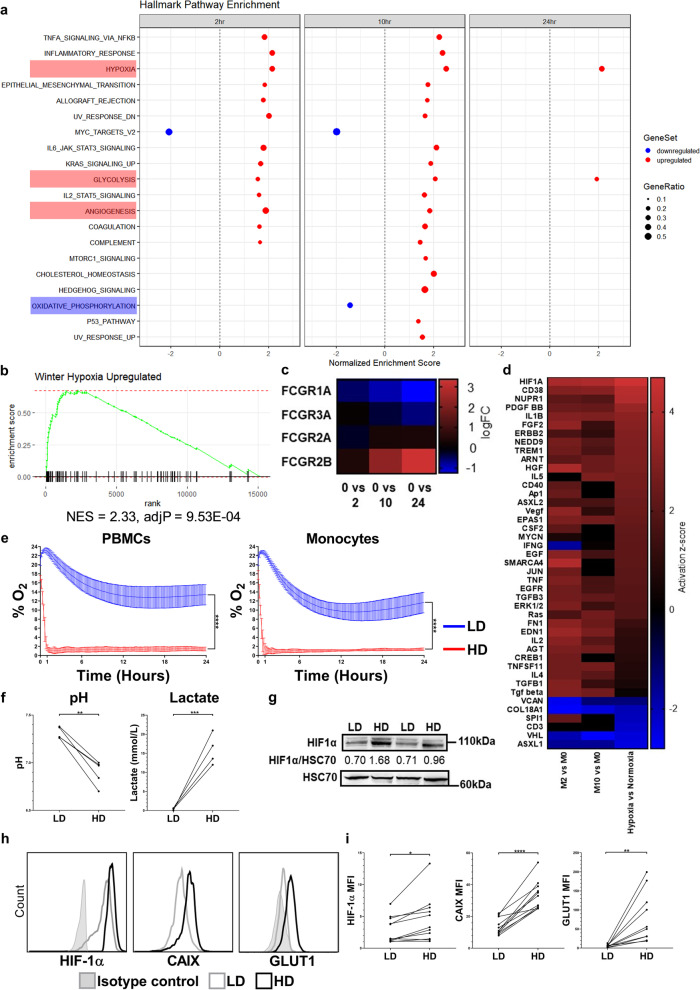
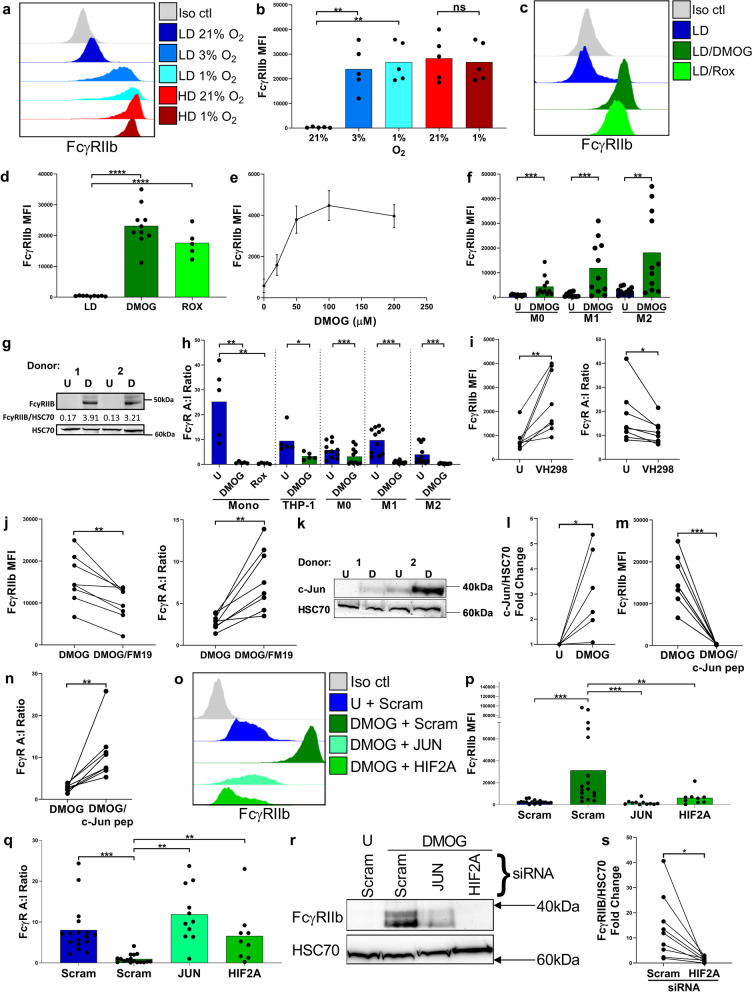
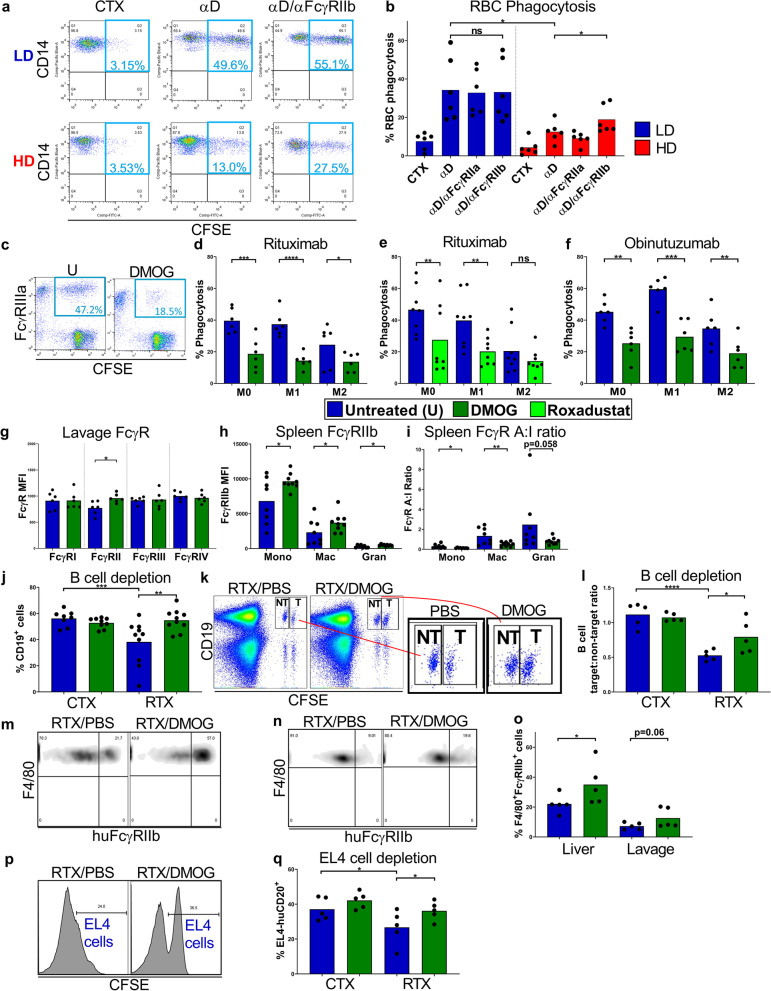
Results: We report that TAMs are FcγRIIbbright relative to healthy tissue counterparts and under hypoxic conditions, mononuclear phagocytes markedly upregulate FcγRIIb. This enhanced FcγRIIb expression is transcriptionally driven through HIFs and Activator protein 1 (AP-1). Importantly, this phenotype reduces the ability of macrophages to eliminate anti-CD20 monoclonal antibody (mAb) opsonized human chronic lymphocytic leukemia cells in vitro and EL4 lymphoma cells in vivo in human FcγRIIb+/+ transgenic mice. Furthermore, post-HIF activation, mAb mediated blockade of FcγRIIb can partially restore phagocytic function in human monocytes.

Conclusion: Our findings provide a detailed molecular and cellular basis for hypoxia driven resistance to antitumor mAb immunotherapy, unveiling a hitherto unexplored aspect of the TME. These findings provide a mechanistic rationale for the modulation of FcγRIIb expression or its blockade as a promising strategy to enhance approved and novel mAb immunotherapies.

Keywords: Cancer; Fc gamma receptors; FcγRIIb; Hypoxia; Hypoxia inducible factors; Monoclonal antibody; Monocytes; Resistance; Tumor microenvironment; Tumor-associated macrophages.


Conflict of interest statement

A.R. receives funding from BioInvent International. Research by R.I.C is supported by use of equipment to measure body composition provided by SECA through a model industry collaborative agreement (mICA) with University Hospital Southampton. M.J.G previously acted as a consultant to a number of biotech companies and receives institutional payments and royalties from antibody patents and licenses. J.C.S has received funding from Roche. S.A.B acts as a consultant for a number of biotech companies and has received institutional support for grants and patents from BioInvent. M.S.C. acts as a consultant for a number of biotech companies, being retained as a consultant for BioInvent International and has received research funding from BioInvent, GSK, UCB, iTeos, and Roche.

Figures

Fig. 1
Fig. 1
FcγR expression profiling of human PBMCs cultured at low or high density for 48 h. a, Expression of FcγR on primary human monocytes (FSChiCD14+ cells) in low density (LD) or high density (HD) PBMC cultures determined using flow cytometry. Representative histograms above and quantified for 11 independent healthy donors below. b, Comparison of FcγR activating:inhibitory (A:I) ratio between LD and HD monocytes, (n = 11 per group). c, Quantification of FcγR and myeloid cell surface markers on monocytes in LD and HD PBMC cultures determined using flow cytometry and PE fluorescence quantitation beads, group means ± SD are shown, (n = 5 per group). d, Assessment of FcγRIIb expression by Western blot in LD and HD monocytes using CHO cells transfected with FcγRIIb1, and FcγRIIb2 isoforms as controls. e, Combined Western blot data of FcγRIIb expression normalized to HSC70 loading control (left) and fold change of FcγRIIb expression relative to HSC70 in LD and HD monocytes (right), (n = 16 per group). Each data point represents a unique healthy adult donor. Statistical significance between groups was assessed using a paired two-tailed Wilcoxon test (***p < 0.001, ****p < 0.0001 and ns = non-significant). Also see Additional file 1: Fig. S1
Fig. 2
Fig. 2
Transcriptional and physiological profiling of HD human monocytes. The transcriptome of fresh and HD human monocytes cultured for 2, 10 or 24 h was investigated using microarray analysis. a, Pre-ranked GSEA; genes were ranked according to their differential expression between monocytes at 2, 10 or 24 h post-HD culture and fresh monocytes. Twenty Hallmark gene sets (v7.2) were significantly overrepresented (FDR < 0.05). Upregulated gene expression is signified in red and downregulation in blue. b, Enrichment plot of the Winter hypoxia gene set in monocytes post-HD culture. c, Heat map of FCGR gene expression. d, Microarray gene expression data was acquired using fresh monocytes (M0) and monocytes at 2 (M2),10 (M10) and 24 (M24) hours post-HD culture as well as monocytes cultured under hypoxic conditions (1% O2) for 24 h (Bosco et al., 2006). Heat map of activation z-scores for the top 50 genes and proteins determined to be the most activating or inhibiting. e, % O2 in LD and HD cultures of human PBMCs and isolated monocytes (n = 6 per group, thickness of lines for LD and HD represent SEMs for each time point). f, pH and Lactate in donor matched LD and HD PBMC culture supernatants (n = 5 per group). g, LD and HD monocyte cell lysates were generated and HIF-1α and HSC70 expression assessed using Western blotting. Representative Western blot staining for 2 donors is shown. h-i, Representative histograms and graphs showing expression of HIF-1α, CAIX and GLUT1 expression quantified using flow cytometry of LD and HD precultured monocytes (n = 11 per group). Each point on the graphs represents a unique healthy donor. Statistical significance between groups was assessed by using a paired two-tailed Wilcoxon test (*p < 0.05, **p < 0.001, ***p < 0.001 and ****p < 0.0001). Also see Additional file 2: Fig. S2
Fig. 3
Fig. 3
Transcriptional profiling and immunophenotyping of human monocytes during HIF-prolyl hydroxylase inhibition. a-e, FcγR expression levels and FcγR A:I (FcγR activating:inhibitory) ratio were quantified using flow cytometry (n = 7). Statistical significance between groups was assessed using a paired two-tailed Wilcoxon test (*p < 0.05, **p < 0.01 and ***p < 0.001). f-l, RNA-Seq analysis of the transcriptome of untreated and DMOG treated monocytes cultured for 0 (fresh), 2, 10, and 24 h. f, Monocyte gene expression time course trajectories in principal component space (dimensions 1 and 2). Principal Component Analysis (PCA) on 6198 differentially expressed genes for untreated versus DMOG-treated comparisons. g, Pre-ranked GSEA; genes were ranked according to their differential expression between monocytes at 10 h post-DMOG treatment and fresh monocytes. Twenty-five Hallmark gene sets (v7.2) were significantly overrepresented (FDR < 0.05), with gene sets of interest highlighted red, indicating upregulated gene expression across all time-points, and the oxidative phosphorylation gene set highlighted blue, showing downregulation of gene expression. h Expression fold changes (log2(FC)) for FCGR genes between untreated and DMOG-treated monocytes. i, Enrichment plot of Winter hypoxia gene set in monocytes at 10 h post-DMOG treatment vs fresh monocytes (NES = 2.33). j, Enrichment plot of the Hallmark hypoxia gene set in DMOG treated monocytes at 10 h vs fresh monocytes (NES = 2.86). k, Gene expression heat map for differentially expressed genes of interest in untreated (U) and DMOG-treated monocytes at 10 h post-culture. Columns represent monocyte samples from 7 donors. l, Upstream regulator analysis was performed using IPA. Heat map of activation z-scores indicates the top 50 transcription factor genes and proteins predicted to be activating or inhibiting when comparing untreated monocytes with DMOG treated monocytes (n = 7 per group). Also see Additional file 3: Fig. S3
Fig. 4
Fig. 4
Characterisation of gene openness and transcriptional regulation of FCGR2B gene in response to DMOG treatment. a, DNA from untreated and DMOG treated monocytes 24 h post-treatment was assessed to determine chromatin accessibility. PCA of gene accessibility in differentially open genes for untreated versus DMOG-treated samples, 24 h post-treatment. b, Hierarchical cluster analysis heat map of sample dissimilarity based on significantly opened or closed regions (n = 7 per group). c, Transcription factor DNA binding motifs identified in significantly opened regions in DMOG treated versus untreated samples. HIFs and AP-1 proteins are colored yellow. d, Volcano plot showing genes significantly opened or closed in DMOG-treated monocytes when compared to untreated donor matched monocytes. e, Gene coverage tracks of FCGR2B at the 10-h time point post-treatment. Gene tracks represent unique donors. DMOG-treated monocyte samples are coloured red and donor matched untreated samples are coloured blue (n = 7 per group). f, Gene coverage tracks of the 1 Kb region upstream of FCGR2B TSS for ATAC-seq alignments, 10 h post-treatment. g, Gene coverage track for the EGLN3 gene, 10 h post-treatment. h, Frequency (f) of TF binding sites in differentially open peaks between DMOG treated and untreated monocytes. Z-scores for this observed frequency in relation to the frequency distribution of TF binding occurrences in 4000 random genomic intervals, repeated 1000 times. Frequency distributions for the number of HIF-1α, HIF-2α, GATA2 and GATA3 binding sites are shown. Frequency (f) of TF binding sites. i, Box and whisker chart showing ChIP–quantitative PCR confirmation of TF binding to the 1 Kb region upstream of the FCGR2B TSS in the promotor region. Plots show all mAb binding and subsequent PCR amplification of the FCGR2B gene promotor region normalized to the signal achieved in the donor matched isotype control mAb ‘ChIPed’ DNA samples (n = 3–6 per group). Statistical significance was assessed using a paired two-tailed Wilcoxon test (*p < 0.05, **p < 0.01 and ns = non-significant). Also see Additional file 4: Fig. S4
Fig. 5
Fig. 5
Effects of hypoxia and hypoxia mimetics on FcγRIIb expression and its transcriptional regulation. a, Histograms showing expression of FcγRIIb on LD and HD monocytes cultured under 21% or 1% O2, b, and quantified using flow cytometry (n = 5 per group). c, Histograms showing expression of FcγRIIb on monocytes treated with DMOG or Roxadustat (Rox). d, and quantified using flow cytometry (n = 5–10 per group). e, FcγRIIb expression quantified using flow cytometry following dose titration of DMOG treatment of THP-1 cells (n = 3, bars show means ± SEM). f, FcγRIIb expression on untreated (U) and DMOG treated M0, M1 and M2 monocyte-derived macrophages (MDM), (n = 11 per group). g, Representative Western blot showing FcγRIIb expression in untreated or DMOG-treated (D) M1 macrophages for 2 donors. h, FcγR A:I ratio on monocytes, THP-1 cells and MDMs untreated or treated with DMOG or Roxadustat (Rox) (n = 5–11 per group). i, FcγRIIb expression (left) and FcγR A:I ratio (right) on monocytes following treatment with VH298 (n = 8). j, FcγRIIb expression (left) and FcγR A:I ratio (right) on DMOG-treated monocytes in the absence or presence of FM19G11 (FM19, n = 8). k, Representative Western blot showing c-Jun expression in Untreated (U) or DMOG-treated (D) monocytes l, combined Western blot data of fold change of c-Jun expression relative to HSC70 (n = 6). m, FcγRIIb expression and n, FcγR A:I ratio on DMOG-treated monocytes following c-Jun peptide treatment (c-Jun; n = 8). o, Representative histograms showing FcγRIIb expression on purified human untreated (U) monocytes transfected with scrambled control (Scram) siRNA, and DMOG-treated monocytes transfected with Scram, HIF2A or JUN siRNA, 24 h post-treatment. p, FcγRIIb expression and q, FcγR A:I ratio for 9–17 donors per group using flow cytometry following treatments stated in o. r, Representative Western blots showing FcγRIIb expression on untreated monocytes transfected with Scram siRNA, and DMOG-treated monocytes transfected with Scram, HIF2A or JUN siRNA. s, Combined Western blot data of fold change of FcγRIIb expression relative to HSC70 (n = 9). Each point on the graphs represents a unique donor and bars represent group means. Statistical significance was assessed using a paired two-tailed Wilcoxon test (*p < 0.05, **p < 0.01, ****p < 0.0001 and ns = non-significant). Also see Additional file 5: Fig. S5
Fig. 6
Fig. 6
FcγR expression on tumor associated mononuclear phagocytes. a, Representative histograms showing FcγR expression on fresh donor matched peripheral blood (PB) and pleural fluid (PF) monocytes from a single mesothelioma patient. b, FcγRIIb expression (left) and FcγR A:I ratio (right) were quantified for PB and PF monocytes (FSChiCD45+CD14+ cells) sourced from mesothelioma patients using flow cytometry (n = 6 per group). c, Representative histograms showing expression of FcγRIIb on fresh monocytes isolated from lymphocele taken from 3 breast cancer patients. d, Representative histograms showing FcγRIIb expression on fresh donor matched renal monocytes (FSChiCD45+CD14+ cells) and macrophages (FSChiCD45+CD163+ cells) in normal kidney tissue and tumor from a single renal cell carcinoma (RCC) patient. e, FcγRIIb expression (left) and FcγR A:I ratio (right) were quantified for monocytes and macrophages sourced from normal kidney tissue and donor matched RCC specimens using flow cytometry (n = 5 per group). f, Representative histograms showing FcγRIIb expression on splenic and MCA205, CT26 and EG7 tumor associated CD11b+F4/80+ macrophages. g, Comparison of murine FcγRII expression (left) and FcγR A:I ratio (right) on CD11b+Ly6C+ monocytes and h, CD11blo/F4/80+ macrophages in recipient matched spleen and subcutaneous MCA205, CT26 and EG7 tumors (n = 5–9 per group). Each point on the graphs represents a unique human subject or mouse and bars represent group means. Statistical significance between groups was assessed using a paired two-tailed Wilcoxon test (*p < 0.05, **p < 0.01, ***p < 0.001, ****p < 0.0001 and ns = non-significant). i, Immunofluorescence staining of hypoxic regions using hypoxyprobe (hypoxia probe) and anti-mouse FcγRII, on sections taken from a CT26 tumor. Localization of FcγRII expression in hypoxic regions is shown. Images representative of stained sections from 5 different mice. Scale bars 100 μm. Also see Additional file 6: Fig. S6
Fig. 7
Fig. 7
The impact of hypoxia-driven FcγRIIb upregulation on mAb mediated target cell depletion. a, Flow cytometry plots showing levels of uptake of CSFE+ red blood cells (RBCs) by LD and HD monocytes. RBCs sourced from Rhesus D+ individuals were opsonised with control cetuximab (CTX) or anti-Rhesus D antigen specific mAb (αD). RBCs used as targets for LD and HD pre-cultured monocytes pre-treated with or without anti-FcγRIIb (αFcγRIIb) blocking mAb. b, RBC phagocytosis quantified for 6 donors. c, Flow cytometry plots showing Rituximab mediated uptake of CLL cells by FcγRIIIa+ M1 macrophages generated with or without DMOG. d, CLL cells opsonised with Rituximab and cultured with M0, M1 or M2 MDMs generated in the absence or presence of DMOG or e, Roxadustat and the percentage of phagocytic MDMs were determined by flow cytometry (n = 6–8 per group). f, Phagocytosis of CLL cells mediated by Obinutuzumab (n = 6 per group). g, FcγR expression on F4/80+ macrophages in the peritoneal lavage of WT C57BL/6 mice treated with DMOG or PBS control. i.p., determined using flow cytometry (n = 6 per group). h, FcγRIIb expression levels and i, FcγR A:I ratio were determined by flow cytometry in splenic monocytes (Mono), macrophages (Mac) and granulocytes (Gran) of DMOG or PBS treated hFcγRIIb/mFcγRIIKO mice (n = 8 per group). j, hFcγRIIb/mFcγRIIKO/hCD20 mice were treated with DMOG or vehicle PBS control i.p. for 72 h prior to receiving Rituximab (RTX) or CTX isotype control. %CD19+ cells in the peripheral blood of each mouse were determined using flow cytometry (n = 8–10 per group). k, hFcγRIIb/mFcγRIIKO mice were treated with DMOG or PBS i.p. for 72 h prior to receiving CFSE labelled target splenocytes from hCD20/mFcγRIIKO mice and non-target splenocytes from WT C57BL/6 mice, i.v. These mice were treated with DMOG or PBS i.p. prior to receiving RTX or CTX 24 h later. Flow cytometry plots are shown for the depletion of target and non-target splenocytes, and l, data is presented as CD19+ cell target:non-target ratio (n = 5 per group). m, Flow cytometry plots showing hFcγRIIb expression on liver and n, peritoneal lavage F4/80+ macrophages 72 h post-treatment with DMOG or PBS control, i.p., in hFcγRIIb/mFcγRIIKO mice, and o, quantified for 5 mice per group. p, hFcγRIIb/mFcγRIIKO mice were treated with DMOG or PBS i.p. for 60 h prior to receiving CFSE labelled EL4-huCD20+ cells following treatment with RTX or CTX, and DMOG or PBS. Histograms showing depletion of target EL4-huCD20+ cells in the peritoneum by RTX in the absence and presence of DMOG and q, EL4-huCD20+ cell depletion in the peritoneal lavage quantified using flow cytometry. Bars represent group means. Statistical significance was assessed using an unpaired two-tailed t-test, a paired two-tailed Wilcoxon test, or a one-way ANOVA for the in vivo cell depletion experiments (*p < 0.05, **p < 0.01, ***p < 0.001, ****p < 0.0001 and ns = non- significant). Also see Additional file 7: Fig. S7

References

    1. Shay JE, Celeste SM. Hypoxia-inducible factors: crosstalk between inflammation and metabolism. Semin Cell Dev Biol. 2012;23(4):389–394. doi: 10.1016/j.semcdb.2012.04.004. - DOI - PubMed
    1. Arteel GE, Thurman RG, Yates JM, et al. Evidence that hypoxia markers detect oxygen gradients in liver: pimonidazole and retrograde perfusion of rat liver. Br J Cancer. 1995;72(4):889–895. doi: 10.1038/bjc.1995.429. - DOI - PMC - PubMed
    1. Awwad HK, El Merzabani MM, El Badawy S, et al. Misonidazole in the preoperative and radical radiotherapy of bladder cancer. Cancer Clin Trials. 1980;3(3):275–80. - PubMed
    1. Becker A, Hansgen G, Bloching M, et al. Oxygenation of squamous cell carcinoma of the head and neck: comparison of primary tumors, neck node metastases, and normal tissue. Int J Radiat Oncol Biol Phys. 1998;42(1):35–41. doi: 10.1016/s0360-3016(98)00182-5. - DOI - PubMed
    1. Koong AC, Mehta VK, Le QT, et al. Pancreatic tumors show high levels of hypoxia. Int J Radiat Oncol Biol Phys. 2000;48(4):919–922. doi: 10.1016/s0360-3016(00)00803-8. - DOI - PubMed