

Does socioeconomic inequality exist in minimum acceptable diet intake among children aged 6-23 months in sub-Saharan Africa? Evidence from 33 sub-Saharan African countries' demographic and health surveys from 2010 to 2020
- PMID: 35392989
- PMCID: PMC8991825
- DOI: 10.1186/s40795-022-00521-y
Does socioeconomic inequality exist in minimum acceptable diet intake among children aged 6-23 months in sub-Saharan Africa? Evidence from 33 sub-Saharan African countries' demographic and health surveys from 2010 to 2020
Abstract
Background: Child undernutrition is a major public health problem in many resource-poor communities in the world. More than two-thirds of malnutrition-related child deaths are associated with inappropriate feeding practices during the first 2 years of life. Socioeconomic inequalities are one of the most immediate determinants. Though sub-Saharan Africa (SSA) shares the huge burden of children undernutrition, as to our search of literature there is limited evidence on the pooled magnitude, socioeconomic inequalities of minimum acceptable diet intake and its contributing factors among children aged 6 to 23 months in the region. This study aimed to assess the level of socio-economic inequalities of minimum acceptable diet intake, and its contributor factors among children aged 6-23 months in SSA using recent 2010-2020 DHS data.
Methods: A total of 78,542 weighted samples from Demographic and Health Survey datasets of SSA countries were used for this study. The data were cleaned using MS excel and extracted and analyzed using STATA V.16 software. The concentration index and curve and wag staff type decomposition analysis were applied to examine wealth-related inequalities in the outcomes. P-value < 0.05 was taken to declare statistical significance.
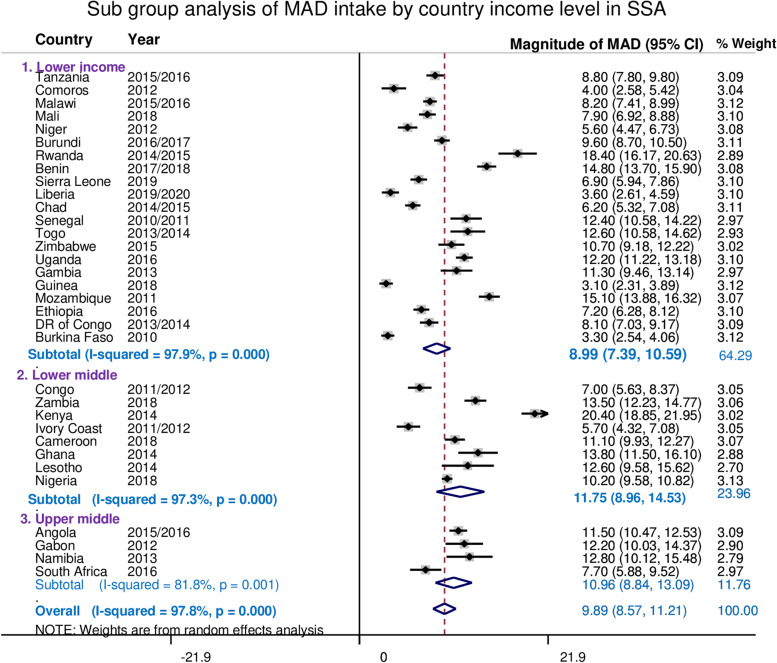
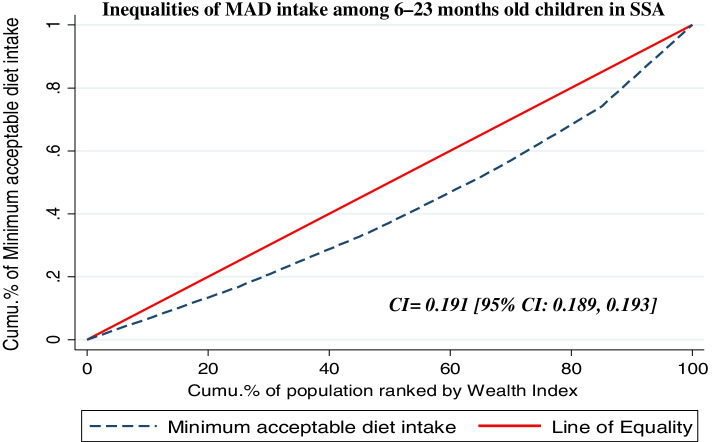
Results: The pooled magnitude of MAD intake among children age 6-23 months in SSA was 9.89% [95%CI: 8.57, 11.21%] ranging from 3.10% in Guinea to 20.40% in Kenya. MAD intake in SSA was disproportionately concentrated on the rich households (pro-rich) [C = 0.191; 95% CI: 0.189, 0.193]. Residence (36.17%), media exposure (23.93%), and women's education (11.63%) explained the pro-rich inequalities in MAD intake. The model explained 55.55% of the estimated socioeconomic inequality in MAD intake in SSA.
Conclusion and recommendations: Minimum acceptable diet intake in SSA is relatively low. There are moderate socioeconomic inequalities in MAD intake in SSA, mainly explained by residence, media exposure and women's education. The government of sub-Saharan African countries should plan and work in short terms through the program that endorses women empowerment such as income generation, cash assistance for mothers who have under 2 years of children and women employment using affirmative actions, and nutrition education such as media campaigns and promoting breast feedings. Long-term plans are also needed for those SSA countries with lower income status through programs to enhance their country's economy to the middle and higher economic level and to improve the wealth index of individual households to narrow the poor-rich gap in the minimum acceptable diet intake.
Keywords: And sub-saharan African; Minimum acceptable diet; Socioeconomic inequalities.
© 2022. The Author(s).
Conflict of interest statement
The authors declare that they have no competing interests.
Figures

References
-
- Black RE, et al. Maternal and child undernutrition and overweight in low-income and middle-income countries. Lancet. 2013;382(9890):427–451. - PubMed
-
- Organization, W.H. and P.A.H. Organization . Guiding principles for complementary feeding of the breastfed child. 2001.
-
- Ng CS, Dibley MJ, Agho KE. Complementary feeding indicators and determinants of poor feeding practices in Indonesia: a secondary analysis of 2007 demographic and health survey data. Public Health Nutr. 2012;15(5):827–839. - PubMed
-
- Gizaw G, Tesfaye G. Minimum acceptable diet and factor associated with it among infant and young children age 6-23 months in north Shoa, Oromia region, Ethiopia. Int J Homeopathy Nat Med. 2019;5(1):1.
-
- IYCF, W.h.o.W . Indicators for assessing infant and young child feeding practice. 2007.
LinkOut - more resources
Full Text Sources
Research Materials
Miscellaneous