

MiDAS 4: A global catalogue of full-length 16S rRNA gene sequences and taxonomy for studies of bacterial communities in wastewater treatment plants
- PMID: 35393411
- PMCID: PMC8989995
- DOI: 10.1038/s41467-022-29438-7
MiDAS 4: A global catalogue of full-length 16S rRNA gene sequences and taxonomy for studies of bacterial communities in wastewater treatment plants
Erratum in
-
Author Correction: MiDAS 4: A global catalogue of full-length 16S rRNA gene sequences and taxonomy for studies of bacterial communities in wastewater treatment plants.Nat Commun. 2022 Jul 11;13(1):4017. doi: 10.1038/s41467-022-31423-z. Nat Commun. 2022. PMID: 35821016 Free PMC article. No abstract available.
Abstract
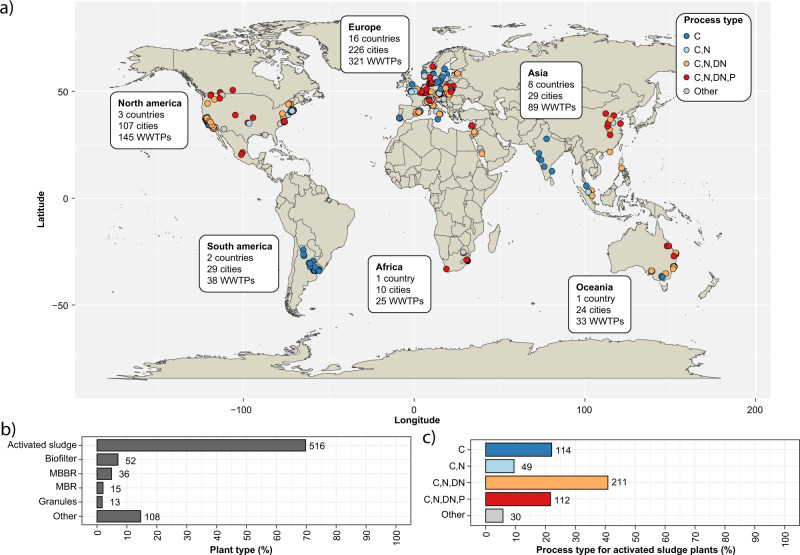
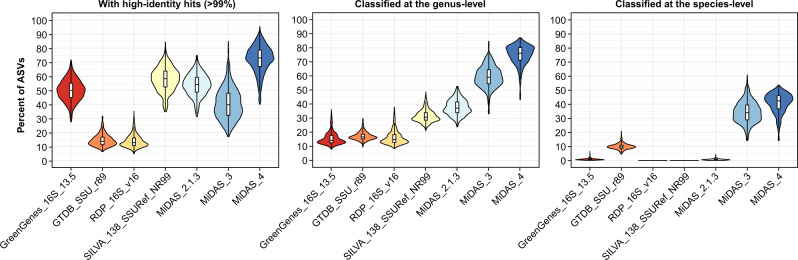
Microbial communities are responsible for biological wastewater treatment, but our knowledge of their diversity and function is still poor. Here, we sequence more than 5 million high-quality, full-length 16S rRNA gene sequences from 740 wastewater treatment plants (WWTPs) across the world and use the sequences to construct the 'MiDAS 4' database. MiDAS 4 is an amplicon sequence variant resolved, full-length 16S rRNA gene reference database with a comprehensive taxonomy from domain to species level for all sequences. We use an independent dataset (269 WWTPs) to show that MiDAS 4, compared to commonly used universal reference databases, provides a better coverage for WWTP bacteria and an improved rate of genus and species level classification. Taking advantage of MiDAS 4, we carry out an amplicon-based, global-scale microbial community profiling of activated sludge plants using two common sets of primers targeting regions of the 16S rRNA gene, revealing how environmental conditions and biogeography shape the activated sludge microbiota. We also identify core and conditionally rare or abundant taxa, encompassing 966 genera and 1530 species that represent approximately 80% and 50% of the accumulated read abundance, respectively. Finally, we show that for well-studied functional guilds, such as nitrifiers or polyphosphate-accumulating organisms, the same genera are prevalent worldwide, with only a few abundant species in each genus.
© 2022. The Author(s).
Conflict of interest statement
The authors declare no competing interests.
Figures


Similar articles
-
MiDAS 5: Global diversity of bacteria and archaea in anaerobic digesters.Nat Commun. 2024 Jun 25;15(1):5361. doi: 10.1038/s41467-024-49641-y. Nat Commun. 2024. PMID: 38918384 Free PMC article.
-
Global abundance patterns, diversity, and ecology of Patescibacteria in wastewater treatment plants.Microbiome. 2024 Mar 16;12(1):55. doi: 10.1186/s40168-024-01769-1. Microbiome. 2024. PMID: 38493180 Free PMC article.
-
MiDAS 3: An ecosystem-specific reference database, taxonomy and knowledge platform for activated sludge and anaerobic digesters reveals species-level microbiome composition of activated sludge.Water Res. 2020 Sep 1;182:115955. doi: 10.1016/j.watres.2020.115955. Epub 2020 May 28. Water Res. 2020. PMID: 32777640
-
Generation of Comprehensive Ecosystem-Specific Reference Databases with Species-Level Resolution by High-Throughput Full-Length 16S rRNA Gene Sequencing and Automated Taxonomy Assignment (AutoTax).mBio. 2020 Sep 22;11(5):e01557-20. doi: 10.1128/mBio.01557-20. mBio. 2020. PMID: 32963001 Free PMC article.
-
A comprehensive overview of the Chloroflexota community in wastewater treatment plants worldwide.mSystems. 2023 Dec 21;8(6):e0066723. doi: 10.1128/msystems.00667-23. Epub 2023 Nov 22. mSystems. 2023. PMID: 37992299 Free PMC article. Review.
Cited by
-
Long-Read Metagenome-Assembled Genomes Improve Identification of Novel Complete Biosynthetic Gene Clusters in a Complex Microbial Activated Sludge Ecosystem.mSystems. 2022 Dec 20;7(6):e0063222. doi: 10.1128/msystems.00632-22. Epub 2022 Nov 29. mSystems. 2022. PMID: 36445112 Free PMC article.
-
Microwave-assisted organic acids and green hydrogen production during mixed culture fermentation.Biotechnol Biofuels Bioprod. 2024 Sep 28;17(1):123. doi: 10.1186/s13068-024-02573-7. Biotechnol Biofuels Bioprod. 2024. PMID: 39342259 Free PMC article.
-
Disentangle genus microdiversity within a complex microbial community by using a multi-distance long-read binning method: example of Candidatus Accumulibacter.Environ Microbiol. 2022 Apr;24(4):2136-2156. doi: 10.1111/1462-2920.15947. Epub 2022 Mar 22. Environ Microbiol. 2022. PMID: 35315560 Free PMC article.
-
Insights into kinetic and regression models developed to estimate the abundance of antibiotic-resistant genes during biological digestion of wastewater sludge.J Water Health. 2025 Feb;23(2):238-259. doi: 10.2166/wh.2025.372. Epub 2025 Jan 22. J Water Health. 2025. PMID: 40018965 Review.
-
Forecasting the dynamics of a complex microbial community using integrated meta-omics.Nat Ecol Evol. 2024 Jan;8(1):32-44. doi: 10.1038/s41559-023-02241-3. Epub 2023 Nov 13. Nat Ecol Evol. 2024. PMID: 37957315 Free PMC article.
References
-
- Ardern E, Lockett WT. Experiments on the oxidation of sewage without the aid of filters. J. Soc. Chem. Ind. 1914;33:523–539. doi: 10.1002/jctb.5000331005. - DOI
-
- WWAP (United Nations World Water Assessment Programme). The United Nations World Water Development Report 2017: Wastewater, The Untapped Resource (2017).
Publication types
MeSH terms
Substances
Associated data
LinkOut - more resources
Full Text Sources
