Review
. 2022 Apr 7;7(1):23.
doi: 10.1038/s41536-022-00216-9.

Skeletal muscle differentiation of human iPSCs meets bioengineering strategies: perspectives and challenges

Affiliations
Review

Skeletal muscle differentiation of human iPSCs meets bioengineering strategies: perspectives and challenges

Federica Iberite et al. NPJ Regen Med. .

Abstract

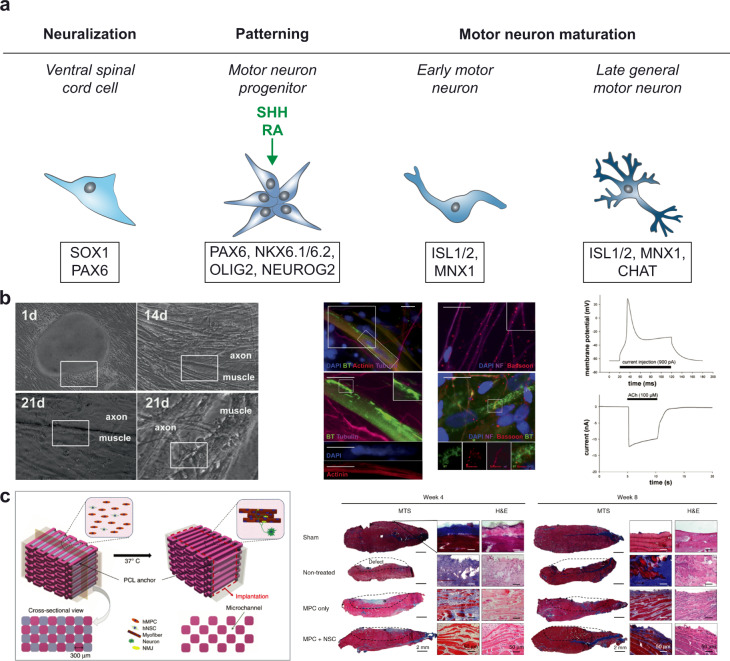
Although skeletal muscle repairs itself following small injuries, genetic diseases or severe damages may hamper its ability to do so. Induced pluripotent stem cells (iPSCs) can generate myogenic progenitors, but their use in combination with bioengineering strategies to modulate their phenotype has not been sufficiently investigated. This review highlights the potential of this combination aimed at pushing the boundaries of skeletal muscle tissue engineering. First, the overall organization and the key steps in the myogenic process occurring in vivo are described. Second, transgenic and non-transgenic approaches for the myogenic induction of human iPSCs are compared. Third, technologies to provide cells with biophysical stimuli, biomaterial cues, and biofabrication strategies are discussed in terms of recreating a biomimetic environment and thus helping to engineer a myogenic phenotype. The embryonic development process and the pro-myogenic role of the muscle-resident cell populations in co-cultures are also described, highlighting the possible clinical applications of iPSCs in the skeletal muscle tissue engineering field.


Conflict of interest statement

The authors declare no competing interests.

Figures

Fig. 1
Fig. 1. Skeletal muscle development.
a Scheme of the mesoderm patterning along the mediolateral axis by gradients of specific signaling molecules, as Noggin and BMP. D dorsal, L lateral, M medial, V ventral, R rostral, C caudal. b Color-coded scheme of the differentiating somites and the surrounding structures during gastrulation and neurulation. Signaling molecules are indicated in green if acting as pro-differentiative actors, in red if they inhibit the differentiation process; dashed lines show paths of cell migration. c Representation of the differentiation process of skeletal muscle cells of the axial and limb muscles, starting from the paraxial mesoderm (PM) progenitors. Marker genes are shown in the bottom boxes, while the main signaling molecules are indicated in green if acting as pro-differentiative actors, in red if they inhibit the differentiation process. PSM presomitic mesoderm, SM skeletal muscle. Schemes adapted and modified from,.
Fig. 2
Fig. 2. Skeletal muscle microenvironment and architecture.
a The skeletal muscle cell contractile unit (the sarcomere, at the bottom) and its interface with the extracellular matrix. Image reproduced and adapted with permission from. b Organization of the muscle tissue and the intramuscular connective tissue. Image reproduced and adapted with permission from.
Fig. 3
Fig. 3. Effects of mechanical stimuli on skeletal muscle cells.
a Representation of a possible mechanism responsible for myogenic differentiation due to tensile strain. ECM extracellular matrix, nNOS nitric oxide synthases, NO nitric oxide. Image reproduced and adapted with permission from. b Top left: the MagneTissue bioreactor system for static mechanical stimulation of a fibrin ring. Top right: quantification of the fusion index at day 9. **p < 0.01; ***p < 0.001. Bottom: unstrained and strained myofibers from the fibrin rings after static mechanical stimulation and 6 days of differentiation. Cells are stained for MYH fast (green) and nuclei (DAPI, blue). Scale bars: 50 μm. Images reproduced and adapted with permission from. c Mechanical cell stimulator based on a stepper motor (top left), moving one attachment site for each well (bottom left). Top right: construct stained for sarcomeric myosin (brown) after two weeks in culture. The black arrow indicates the axis of strain. Scale bar: 20 μm. Bottom right: cross-section of the 3D construct. Scale bar: 100 μm. Image reproduced with permission from. d Bioeffects triggered by HIFU on murine muscle precursors (C2C12 cells): top images show cells immunostained for COX-2 (green) and nuclei (blue) 24 h post-treatment. HIFU upregulated COX-2; upregulation was blocked when cells were loaded with 1,2-bis(o-aminophenoxy)ethane-N,N,N’,N’-tetraacetic acid tetra(acetoxymethyl) ester (BAPTA-AM), a cell-permeable Ca2+-specific chelator, before HIFU stimulation. Scale bars: 10 μm. Bottom: scheme of intracellular Ca2+ signaling generating ultrasound bioeffects. Through a series of steps, ultrasound determines the activation of nuclear factor κ B (NFκB) that generates molecular responses (including COX-2). TRPC1 transient receptor potential cation channel subfamily C member 1, VGCC voltage-gated Ca2+ channel, CIRC Ca2+-induced Ca2+-release, SOCE store-operated Ca2+ entry, RyR ryanodine receptor, STIM1 stromal interaction molecule 1, ORAI1 Ca2+ release-activated Ca2+modulator 1. Images reproduced with permission from. e Engineered ultrasonic set-up, provided with quantitative pressure maps for different transducers working at different frequencies (left) and results obtained on C2C12 cells for the different stimulation regimes in terms of myotube development (right). The optimal frequency and the optimal intensity guaranteeing the highest fusion indexes were identified. Scale bars: 500 μm. *p < 0.05, ****p < 0.0001. Images adapted and reproduced with permission from.
Fig. 4
Fig. 4. Biomaterial features and their effects on skeletal muscle cells.
a Scheme of biomaterial properties relevant for cell/tissue engineering, divided into intrinsic and extrinsic ones. b Scheme of the intracellular biochemical cascades triggered by the stiffness of the extracellular environment. Images reproduced with permission from. c Top: stress/strain curves for different soft tissues (skin, muscle, and brain) from which the slope E can be extracted, representing the Young’s elastic modulus. Dashed lines represent (i) polylactic acid; (ii) artery-derived acellularized matrix; (iii) Matrigel®. Bottom: influence of soft and stiff matrix on actin cytoskeleton assembly, cell spreading, and myotube differentiation. Images reproduced with permission from. d Left: immunofluorescence staining of iPSC-derived myotubes at two weeks of differentiation on different substrates. Right: evaluation of the fusion index and percentage of striated myotubes in the different conditions. (N = 10 fields). *p < .05 versus unpatterned rigid. #p < .05 versus unpatterned soft and micropatterned rigid, and **p < .05 versus unpatterned soft. Images adapted and reproduced with permission from.
Fig. 5
Fig. 5. 3D bioprinting for skeletal muscle tissue engineering.
a Left: the ITOP system and its major units, and illustration of the targeted 3D architecture. Right: staining for myosin heavy chain after 7 days of differentiation (top) and image of the construct and desmin staining after in vivo implantation (bottom). Images adapted from. b Construct based on a cell-laden bioink made of gelatin, fibrinogen, hyaluronic acid, and glycerol. MPCs muscle progenitor cells. Top: fabrication procedure based on an ITOP system. Bottom left: in vitro results of bioprinted and non-bioprinted (bulk) system. MHC myosin heavy chain. Bottom right: in vivo results after implantation in rat muscle defect models. Images adapted from. c Top: construct based on decellularized extracellular matrix-derived bioinks, laden with muscle cells and endothelial cells, organized in different patterns. Bottom left: results of in vitro differentiation, in terms of expression and organization of endothelial marker CD31 and of myosin heavy chain. Bottom right: results of the in vivo experiments. Scale bar: 100 µm. HuNu: human nuclei. Images adapted from.
Fig. 6
Fig. 6. Vasculogenesis, endothelial cell development, and co-culture with skeletal muscle cells: influence on myogenesis.
a Representation of the formation of primary vessels during vasculogenesis, with endothelial cell differentiation starting from the paraxial mesoderm (PM) progenitor. Marker genes are shown in the bottom boxes, while the main signaling molecules are indicated in green if acting as pro-differentiative actors, in red if they inhibit the differentiation process. b Fluorescence confocal images of a co-culture of HUVECs (50%, in green) and muscle cells (50%, in red) in a fibrin matrix (left image). Focus on the endothelial network formation of HUVEC alone (right image). Scale bars: 50 μm. Images adapted and reproduced with permission from. c Fluorescence image of HUVECs (von Willebrand factor, magenta) in co-culture with primary pericytes (GFP) showing the formation of a network. Nuclei were identified by DAPI staining (blue). The graphs show the quantification of the tubular structures, in terms of total segment length, total mesh area, and total branching length of HUVECs without (grey columns) or with pericytes (black columns). Images adapted and reproduced with permission from.
Fig. 7
Fig. 7. Fibroblast co-culture with skeletal muscle cells: influence on myogenesis.
a Fluorescence images of enhanced-GFP-expressing mouse embryonic fibroblasts (MEFs) evenly distributed in a co-culture with primary mouse myoblasts (PMM), stained for fast myosin heavy chain (red) and nuclei (blue). b 2D myotube monocultures degenerated after 18 days in culture (left), while the presence of fibroblasts in co-culture drastically enhanced their stability (right). c Left: MEF/PMM co-culture led to the assembly into a 3D fibrin construct with consequent fibrin degradation. MEF monoculture assembled in a 3D construct (middle), but PMM monoculture without MEFs did not show any 3D autoassembled construct or fibrin degradation (right). Images adapted and reproduced with permission from.
Fig. 8
Fig. 8. Tenocyte development and co-culture with skeletal muscle cells: influence on myogenesis.
a Representation of the differentiation process of tenocytes starting from the paraxial mesoderm (PM) progenitors. Marker genes are shown in the bottom boxes, while the main signaling molecules are indicated in green if acting as pro-differentiative actors, in red if they inhibit the differentiation process. PSM presomitic mesoderm. b Scheme of the myotendinous junction formation. Image adapted and reproduced with permission from. c Top left: 3D printed co-culture of myoblasts (red) and tenocytes (green) just after printing. Scale bar: 2 mm. Top middle: co-culture differentiated for seven days and stained for myosin heavy chain (green) and nuclei (red). Arrows indicate striated and multinucleated myofibers. Top right: focus on the tenocytes in the co-culture stained for type I collagen. Scale bar: 50 µm. Bottom: gene analysis expression of muscle and tendon monoculture in proliferation medium (PM = gray bars) or differentiation medium (DM = black bars). Relative expression is shown as mean ± standard error of the mean (SEM). Images adapted and reproduced with permission from.
Fig. 9
Fig. 9. Motor neuron development and co-culture with skeletal muscle cells: influence on myogenesis.
a Representation of the formation of motor neurons. Marker genes are shown in the bottom boxes, while the main signaling molecules are indicated in green if acting as pro-differentiative factors. b Left: representative phase-contrast images of a human iPSC-derived moto-neurosphere at different time points after plating. Small neurites were outgrowing from the moto-neurosphere. In the inserts are shown contacts between neurites and myotubes. Middle left: maturation of acetylcholine receptor clusters and neuromuscular junction formation. Co-culture between human iPSC-derived motor neurons with CD34-enrichment derived myotubes. α-Bungarotoxin (α-BT) labeling after 21 days indicates the formation of a mature neuromuscular junction. Middle right: Bassoon labeling after 21 days indicates presynaptic terminals along the axons (top figure). At the end plate region, a close apposition between presynaptic and postsynaptic markers could be detected, as shown by Bassoon and α-BT stainings (bottom figure). Scale bar: 20 μm. Right: electrophysiological properties of myotubes in culture after differentiation and representative traces of current-clamp measurements and the generation of an action potential following acetylcholine treatment. MP resting membrane potential, AP action potential. Images reproduced with permission from. c Left: scheme of a bioprinted construct with the cell-laden bioink, the acellular sacrificing bioink, and the supporting polycaprolactone pillar. Right: histological examination of skeletal muscle regeneration through the 3D bioprinted constructs at 4 and 8 weeks after implantation. Dashed lines: defected area; MTS: Masson’s trichome staining; H&E: hematoxylin and eosin. Images reproduced with permission from.

Similar articles

Cited by

References

    1. Fu X, Wang H, Hu P. Stem cell activation in skeletal muscle regeneration. Cell. Mol. Life Sci. 2015;72:1663–1677. - PMC - PubMed
    1. Nowak KJ, Davies KE. Duchenne muscular dystrophy and dystrophin: pathogenesis and opportunities for treatment. EMBO Rep. 2004;5:872–876. - PMC - PubMed
    1. Grogan BF, Hsu MAJJR. Volumetric Muscle Loss. J. Am. Acad. Orthop. Surg. 2011;19:35–37. - PubMed
    1. Osaki T, Uzel SGM, Kamm RD. On-chip 3D neuromuscular model for drug screening and precision medicine in neuromuscular disease. Nat. Protoc. 2020;15:421–449. - PubMed
    1. Takahashi K, Yamanaka S. Induction of pluripotent stem. Cells Mouse Embryonic Adult Fibroblast Cult. Defined Factors Cell. 2006;126:663–676. - PubMed