. 2022 Apr 7;13(4):313.
doi: 10.1038/s41419-022-04753-5.

SorCS3 promotes the internalization of p75NTR to inhibit GBM progression

Affiliations

SorCS3 promotes the internalization of p75NTR to inhibit GBM progression

Yanqiu Zhang et al. Cell Death Dis. .

Abstract

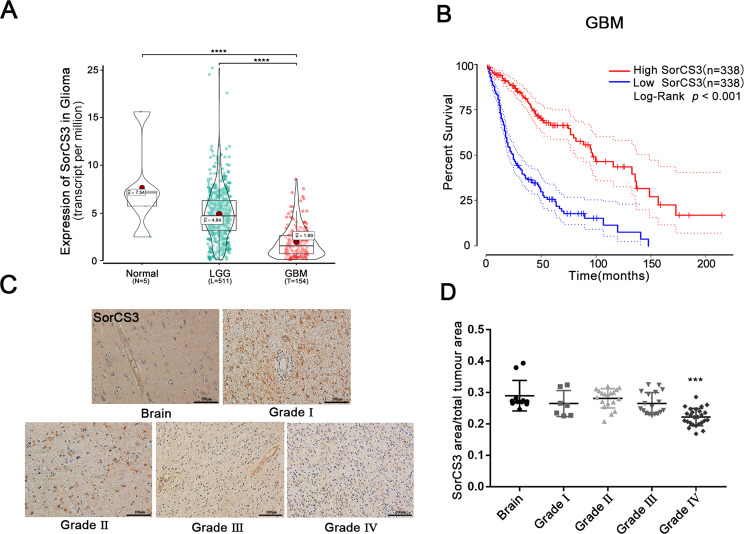
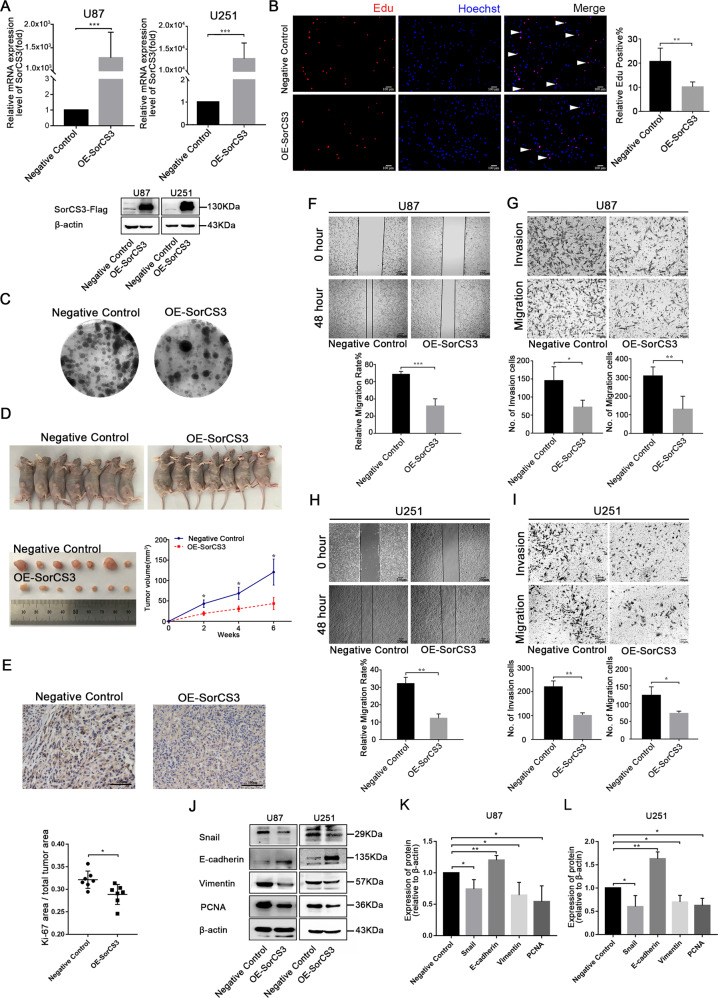
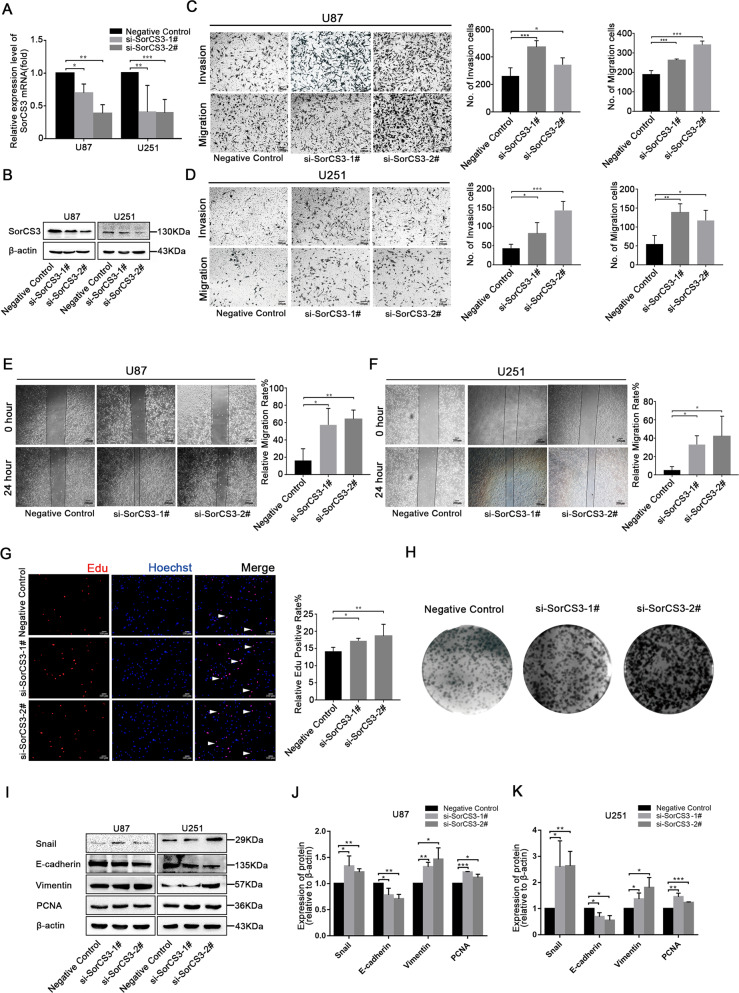
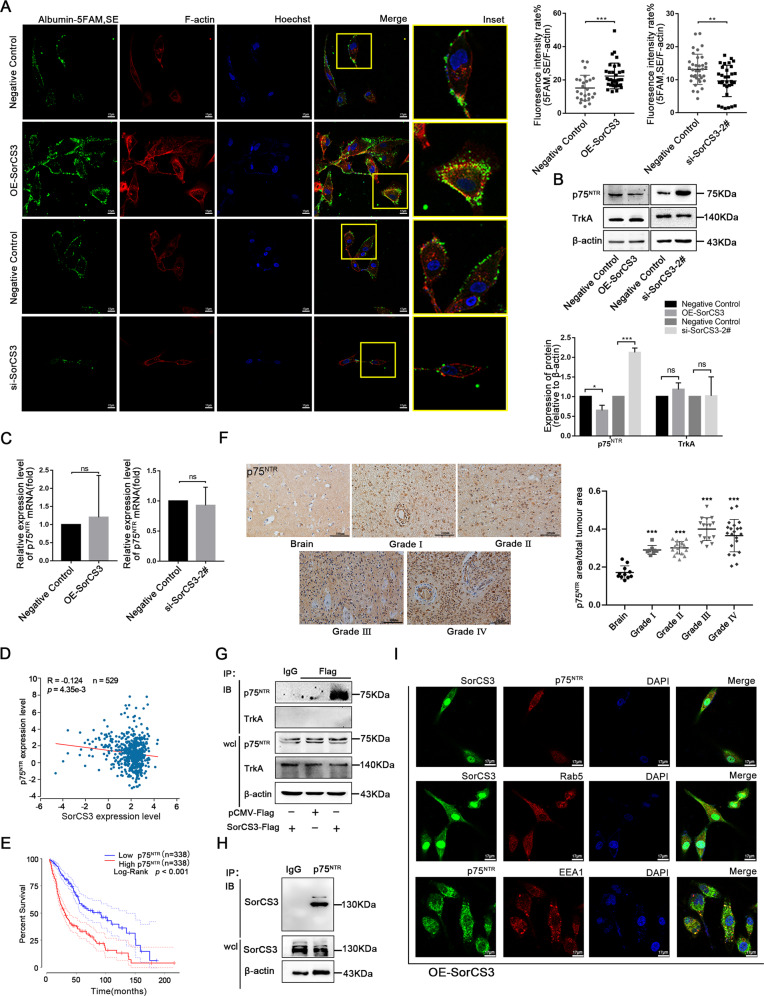
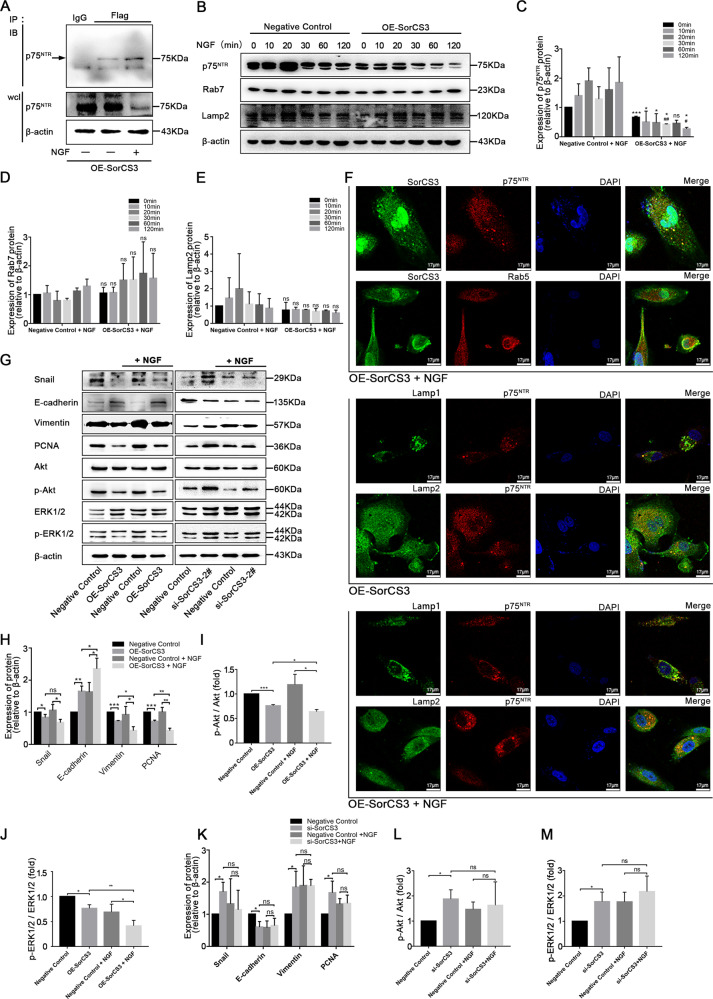
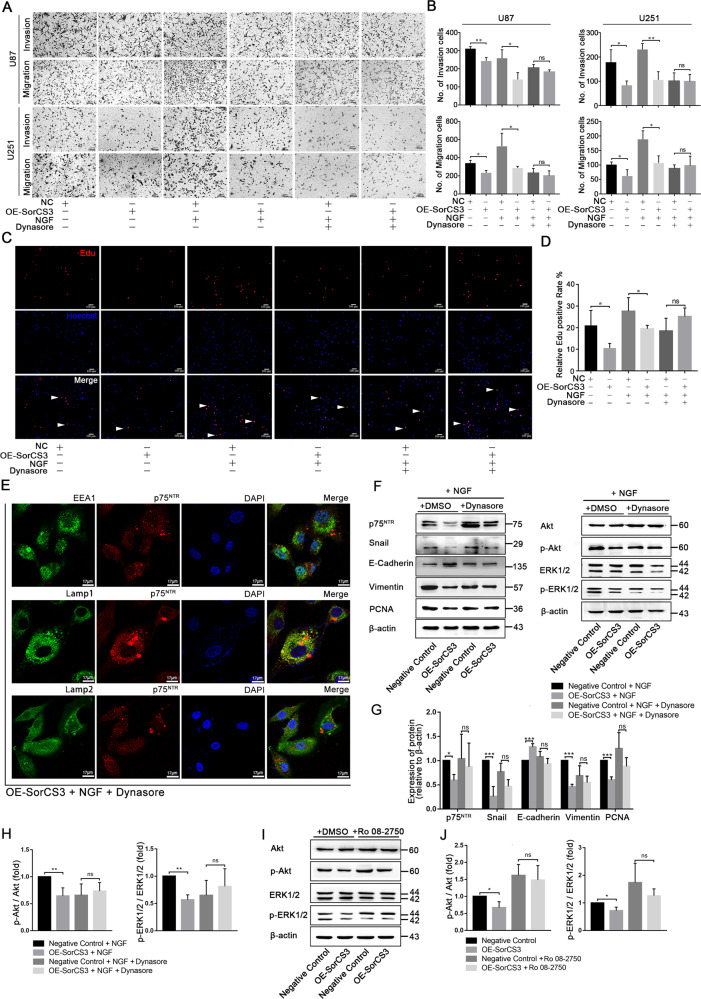
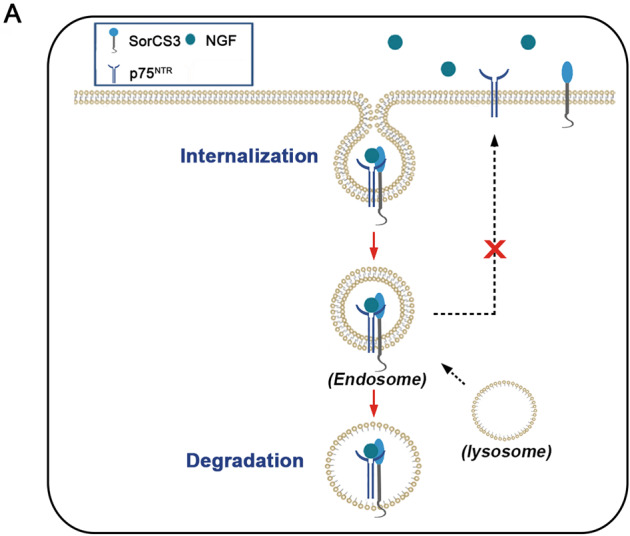
Glioblastoma (GBM) is a fatal malignancy caused by dysregulation of cellular signal transduction. Internalization plays a key role in maintaining signalling balance. Previous reports showed that Sortilin related VPS10 domain containing receptor 3 (SorCS3) has the ability to regulate internalization. However, the impacts of SorCS3 on the biological processes involved in GBM have not yet been reported. In this study, we investigated the bio-function of SorCS3 in GBM. We found that SorCS3 was significantly downregulated in GBM. In addition, low expression level of SorCS3 predicted poor prognoses in patients with GBM. Here, we proved that SorCS3 suppressed cell invasion and proliferation mainly via NGF/p75NTR pathway in GBM. We found that SorCS3 co-localized with p75NTR in GBM cells and regulated the p75NTR protein level by promoting trafficking of the endosomal to the lysosome. Immunofluorescence (IF) and Co-Immunoprecipitation (Co-IP) detection confirmed that SorCS3 bound to p75NTR, which subsequently increased the internalization of p75NTR, and then transported p75NTR to the lysosome for degradation, ultimately contributing to inhibit of glioma progression. Taken together, our work suggests that SorCS3 is a marker of promising prognosis in GBM patients and suggests that SorCS3 regulates internalization, which plays a pivotal role in inhibiting glioma progression.


Conflict of interest statement

The authors declare no competing interests.

Figures

Fig. 1
Fig. 1. Overview of SorCS3 expression in TCGA glioma database.
A SorCS3 expression level in adjacent normal tissues (n = 5), low grade glioma tissues (n = 511) and GBM (n = 154) in the glioma datasets from TCGA. B Kaplan-Meier Survival curves of different SorCS3 expression levels for GBM in TCGA dataset (High SorCS3, n = 338; Low SorCS3, n = 338; p < 0.001). C, D SorCS3 expression with different WHO grade glioma and normal brain tissues taken from 108 patients was assessed by IHC. Scale bar: 100 µm. *p < 0.05; **p < 0.01; ***p < 0.001, ns: not statistically significant.
Fig. 2
Fig. 2. Overexpression of SorCS3 inhibits the migration, invasion, and proliferation of the glioma cells.
A After transfection with the pCMV3-SorCS3-Flag plasmid, the expression levels of SorCS3 were examined through real-time PCR and Western blotting, using β-actin as an endogenous control. B Cell proliferation was determined by EdU staining and EdU incorporation was calculated as EdU+ cells/total cells, quantified by ImageJ. Red was stained for proliferation (EdU + ), blue was stained for nucleus. C Colony formation assay for assessing the cell proliferation of SorCS3 overexpression. D Image of tumours in nude mice bearing U87 cells treated with overexpression of SorCS3 and control. Tumour volume were measured (n = 7). E Immunohistochemical staining of Ki-67 expression in xenograft tumour tissues (n = 7). F, H Effect of SorCS3 overexpression on wound healing of U87and U251 cells. G, I Transwell assays used to determine the influence of SorCS3 overexpression on the migratory and invasive abilities of U87 and U251 cells. JL Western blot analysis of proliferation and EMT associated marker after SorCS3 overexpression. Data are shown as mean ± S.D. including three independent experiments. *p < 0.05; **p < 0.01; ***p < 0.001.
Fig. 3
Fig. 3. Knockdown of SorCS3 promotes the proliferation, migration and invasion of glioma cells in vitro.
A, B After siRNA-SorCS3-1# and 2# transfection, the expression levels of SorCS3 were examined through real-time PCR and western blotting, using β-actin as an endogenous control. C, D Transwell assays used to determine the influence of transfection with si-SorCS3-1# and 2# on the migratory and invasive abilities of U87 and U251 cells. E, F Effect of SorCS3 knockdown on wound healing of U87 and U251 cells. G Cell proliferation was determined by EdU staining in SorCS3 knockdown condition and EdU incorporation was calculated as EdU+ cells/total cells, quantified by ImageJ. Red was stained for proliferation (EdU + ), blue was stained for nucleus. H Colony formation assay for assessing the cell proliferation of knockdown SorCS3. IK Western blot analysis of proliferation- and EMT-associated marker after transfection with SorCS3 siRNA. Data are shown as mean ± S.D. including three independent experiments. *p < 0.05; **p < 0.01; ***p < 0.001.
Fig. 4
Fig. 4. SorCS3 regulates p75NTR expression and internalization.
A Confocal microscopy images of live cells were treated with Albumin-labeled 5-FAM,SE in altered SorCS3 expression condition. Scale bar: 17 µm. B, C qPCR and Western blot analysis of p75NTR and TrkA levels after altering the expression of SorCS3 in U87 cells. D Correlation between SorCS3 and p75NTR mRNA expression levels were analyzed using starBase v2.0 (n = 529, R = −0.124, p = 4.35e-3). E Kaplan-Meier survival curves of glioma from TCGA with different p75NTR expression levels (High SorCS3, n = 338; Low SorCS3, n = 338; p < 0.001). F p75NTR expression with different WHO grade glioma and normal brain tissues taken from 108 patients was assessed by IHC. Scale bar: 100 µm. Immunoprecipitations were performed using anti-Flag (G) or p75NTR (H) antibody, and the immunocomplexes were immunoblotted (IB) using anti-SorCS3, p75NTR and TrkA antibody in transfected SorCS3-Flag plasmid. In parallel, immunoblots for SorCS3, p75NTR and TrkA were performed on whole-cell lysates (wcl); the isotypic lane Immunoglobulin G (IgG) represents the IP control. I U87 cells were transfected with SorCS3-Flag plasmid, and then immunolabeled for SorCS3 and markers of the early endosome (Rab5、EEA1) and the p75NTR. Scale bar: 17 µm.
Fig. 5
Fig. 5. NGF promotes the SorCS3 and p75NTR interaction.
A U87 cells were transfected SorCS3-Flag plasmid, and then stimulated or not with NGF (100 ng/mL) for 60 min. IP were performed using anti-Flag antibody, and the immunocomplexes were immunoblotted (IB) using anti-p75NTR antibody. In parallel, immunoblots for p75NTR were performed on whole-cell lysates (wcl); the isotypic lane Immunoglobulin G (IgG) represents the IP control. BE U87 overexpression of SorCS3 and control were stimulated with NGF (100 ng/mL) over 0–120 min time course. Cell lysates were analyzed by western blotting for components of the canonical internalization signaling pathway using the indicated antibodies. *p vs. the control group, #p vs. the OE-SorCS3 (NGF, 0 min) group. ns: not statistically significant. F Process of internalization was visualized by immunofluorescence staining of the endosome and the lysosomal marker. U87 cells were stimulated with NGF (100 ng/mL) for 60 min, and then immunofluorescence for SorCS3-Flag, p75NTR, early endosome markers (Rab5) and lysosome markers (Lamp1 and Lamp2). Scale bar: 17 µm. GM U87 were transfected with SorCS3-Flag plasmid or siRNA (si-SorCS3-2#) and the corresponding control, and then stimulated with NGF (100 ng/mL) for 60 min. Cell lysates were analyzed by western blotting with the indicated antibodies, using β-actin as an endogenous control. Data are shown as mean ± S.D. including three independent experiments. *p < 0.05; **p < 0.01; ***p < 0.001.
Fig. 6
Fig. 6. Inhibition of internalize abolishes the tumour suppressor effects of SorCS3.
A, B Transwell assays were used to determine the influence of U87 and U251 cells pretreated with or without the cell-permeable dynamin inhibitor Dynasore (40 µM) for 2 h and then stimulated with NGF (100 ng/mL) for 60 min in overexpression of SorCS3 condition. C, D EdU staining to determine the influence of SorCS3 overexpression pretreated with or without the cell-permeable dynamin inhibitor Dynasore (40 µM) for 2 h and then stimulated with NGF (100 ng/mL) for 60 min, and EdU incorporation was calculated as EdU+ cells/total cells, quantified by ImageJ. Red was stained for proliferation (EdU + ), blue was stained for nucleus. E U87 cells were stimulated with Dynasore (40 µM) for 2 h and then stimulated with NGF (100 ng/mL) for 60 min, and then immunofluorescence for p75NTR, early endosome markers (EEA1) and lysosome markers (Lamp1 and Lamp2). Scale bar: 17 µm. FH U87 were pretreated with the cell-permeable dynamin inhibitor Dynasore (40 µM) for 2 h and then stimulated with NGF (100 ng/mL) for 60 min in overexpression of SorCS3 condition. Cell lysates were analyzed by western blotting with the indicated antibodies, using β-actin as an endogenous control. I, J U87 were pretreated with the Ro 08-2750 (1 µM, Ro 08-2750 is a reversible NGF inhibitor which inhibits NGF binding to p75NTR selectively) for 8 h in overexpression of SorCS3 condition. Cell lysates were analyzed by western blotting with the indicated antibodies, using β-actin as an endogenous control. Data are shown as mean ± S.D. including three independent experiments. ns: not statistically significant.
Fig. 7
Fig. 7. SorCS3 expression decreased with the tumour aggressiveness.
A SorCS3 exerts tumour suppressor effect by enhance p75NTR internalization and transport to lysosome degradation in glioma.

Similar articles

Cited by

References

    1. Ostrom QT, Patil N, Cioffi G, Waite K, Kruchko C, Barnholtz-Sloan JS. CBTRUS Statistical report: Primary brain and other central nervous system tumors diagnosed in the United States in 2013–2017. Neuro Oncol. 2020;22:iv1–iv96. doi: 10.1093/neuonc/noaa200. - DOI - PMC - PubMed
    1. Subkhangulova A, Malik AR, Hermey G, Popp O, Dittmar G, Rathjen T, et al. SORCS1 and SORCS3 control energy balance and orexigenic peptide production. EMBO Rep. 2018;19:e44810. doi: 10.15252/embr.201744810. - DOI - PMC - PubMed
    1. Reitz C. The role of intracellular trafficking and the VPS10d receptors in Alzheimer’s disease. Future Neurol. 2012;7:423–31. doi: 10.2217/fnl.12.31. - DOI - PMC - PubMed
    1. Hermey G, Riedel IB, Hampe W, Schaller HC, Hermans-Borgmeyer I. Identification and characterization of SorCS, a third member of a novel receptor family. Biochem Biophys Res Commun. 1999;266:347–51. doi: 10.1006/bbrc.1999.1822. - DOI - PubMed
    1. Khailaie S, Rowshanravan B, Robert PA, Waters E, Halliday N, Badillo Herrera JD, et al. Characterization of CTLA4 Trafficking and Implications for Its Function. Biophys J. 2018;115:1330–43. doi: 10.1016/j.bpj.2018.08.020. - DOI - PMC - PubMed

Publication types

MeSH terms

Substances