. 2022 Apr 7;13(1):1910.
doi: 10.1038/s41467-022-29574-0.

A genetic toolkit and gene switches to limit Mycoplasma growth for biosafety applications

Affiliations

A genetic toolkit and gene switches to limit Mycoplasma growth for biosafety applications

Alicia Broto et al. Nat Commun. .

Abstract

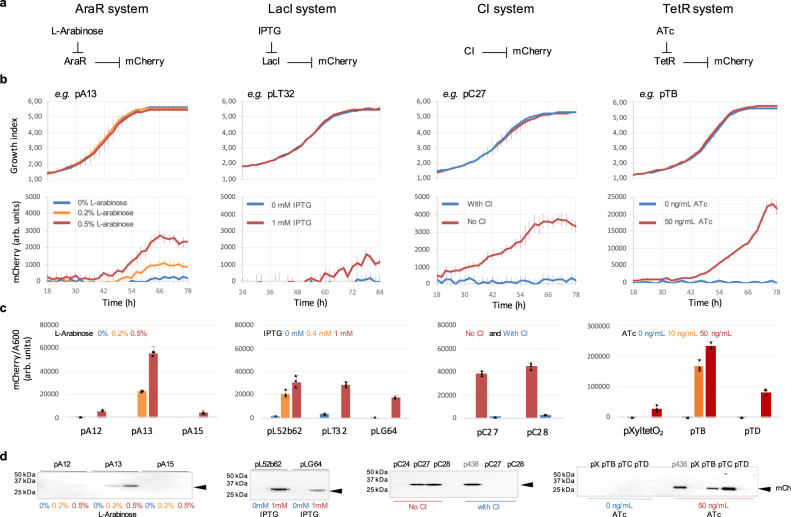
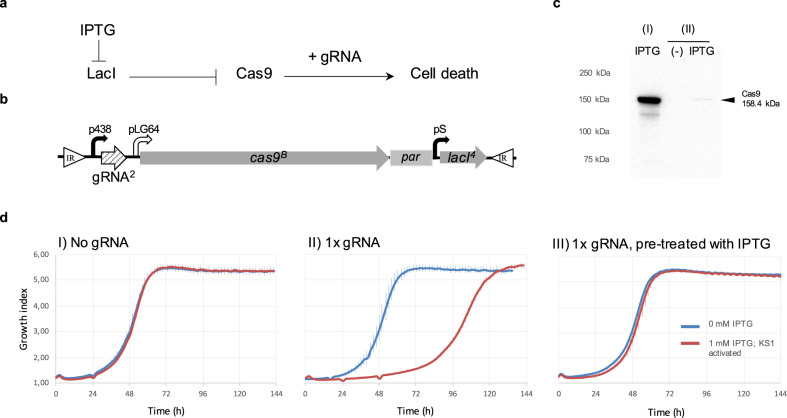
Mycoplasmas have exceptionally streamlined genomes and are strongly adapted to their many hosts, which provide them with essential nutrients. Owing to their relative genomic simplicity, Mycoplasmas have been used to develop chassis for biotechnological applications. However, the dearth of robust and precise toolkits for genomic manipulation and tight regulation has hindered any substantial advance. Herein we describe the construction of a robust genetic toolkit for M. pneumoniae, and its successful deployment to engineer synthetic gene switches that control and limit Mycoplasma growth, for biosafety containment applications. We found these synthetic gene circuits to be stable and robust in the long-term, in the context of a minimal cell. With this work, we lay a foundation to develop viable and robust biosafety systems to exploit a synthetic Mycoplasma chassis for live attenuated vectors for therapeutic applications.


Conflict of interest statement

A.B and M.I declare that have filed a patent on this technology, as PCT Application Number PCT/GB2021/050184 (International Publication Number WO 2021/152301 A1, 5 August 2021). E.G. is currently employed as Project Officer at the European & Developing Countries Clinical Trials Partnership (EDCTP). E.G. declares no Horizon 2020 funding distributed by EDCTP has been deployed in this project and that the object of this manuscript is not involved in EDCTP scopes or funded grants. The remaining authors declare no competing interests.

Figures

Fig. 1
Fig. 1. First genetic toolkit for Mycoplasma.
a Schematic representation of the inducible systems based on the AraR repressor (l-arabinose inducer), LacI repressor (IPTG inducer), CI repressor, TetR repressor (ATc inducer). Blunt arrows indicate repression. b Induction time-course results for one synthetic promoter selected for each repressor system. The upper graphs show synchronised growth (growth index as the ratio Abs430 nm/Abs560 nm) between uninduced (blue) or induced (red and orange) cultures with the corresponding inducer for each repressor. The lower graphs show the corresponding mCherry kinetics (fluorescence in arbitrary units; background subtracted for autofluorescence—see Methods). The mCherry expression depending on the inducer concentration was confirmed by Fluorimetry (c) and western blot (d) in the exponential phase (two days after induction) for several synthetic promoters in each repressor system. All results from mean values from three bio-replicates (black triangles show the values of each bio-replicates). Error bars indicate standard deviation. Source data are provided as a Source Data file.
Fig. 2
Fig. 2. Design and characterisation of the kill-switch KS1.
a Schematic representation of the kill-switch KS1. Blunt arrows indicate repression and pointy arrow activation. b Schematic representation of relevant DNA segments of the MTnpar with the KS1 used to generate a polyclonal strain (puromycin used for selection). White triangles represent the inverted repeats flanking the fragment of the MTn inserted in the genome of Mycoplasma (IR); Bend-arrows for constitutive promoters (black) and IPTG-inducible (white) promoters. Arrows for genes (grey), gRNA (stripped; gRNA2 has eight targets in the genome of M. pneumoniae); par, selection cassette. c Western blot results showing Cas9 expression in strains with the KS1 kill-switch with the cas9 gene with the canonical initiation codon ATG (I) or a CTG codon instead (II). Protein expression was analysed using 10 μg of total protein extract from pre-induced (−) and 1 mM IPTG-induced (IPTG) samples. d Growth kinetics of polyclonal strains with KS1 without any gRNA (I), with a single gRNA copy (II) and same but pre-treated with IPTG in the previous passage (III). Graphs show growth kinetics (growth index corresponding to the ratio Abs430nm/Abs560nm) when KS1 is uninduced (0 mM IPTG, blue lines) or IPTG-induced (kill-switch activated with 1 mM IPTG, red lines). Mean values from three bio-replicates. Error bars indicate standard deviation. Source data are provided as a Source Data file.
Fig. 3
Fig. 3. Design and characterisation of circuit TKS2.
a Schematic representation of the circuit TKS2. Blunt arrows indicate repression and pointy arrow activation. b Schematic representation of relevant DNA segments of the MTncat with TKS2 used to generate a polyclonal strain (chloramphenicol used for selection). White triangles for the inverted repeats (IR); Bend-arrows for constitutive promoters (black) and ATc-inducible (white) promoters. Arrows for genes (grey); Black semicircles show the RBSs; A white square for the riboswitch (RS); Black triangles indicate the position and orientation of the lox sites (lox66 and lox71); cat, selection cassette. Blue brackets indicate the segment that is duplicated in the analysis of the circuit with 2xTetR cassette. c DNA gel showing the results from the PCR analysis of Cre/lox recombination in the TKS2 from genomic DNA samples from passages 1 and 2 in theophylline medium with Cre basal expression (p1+ and p2+) and passage 2 in theophylline-free medium and Cre induction (p2-). PCR product size is expected for the full fragment, before Cre/lox recombination, and the distance between lox sites are indicated in (b) between the small head arrows S5 and S17, showing the position of the primers pair used in the assay (in blue for 2xTetR). d Western blot results showing TetR, CI and Cas9 expression in strains with the circuit TKS2. Expression of the proteins was analysed using 10 µg of total protein extracts from incubations of the strains in the growth permissive condition of 0.5 mM theophylline (+); after a single passage in theophylline-free medium producing slow activation of the TKS2 (−); after two passages in theophylline-free medium (2−) or in 50 ng/mL of ATc to trigger the kill-switch (ATc). Results presented from the circuit engineered with one or two copies of the pSpi-riboswitch-tetR cassette between the lox pair sites in the circuit (1xTetR or 2xTerR, respectively). DNA gel and western blot results are representative of two independent experiments in each case.
Fig. 4
Fig. 4. Study of the long-term performance of the three biosafety systems in clonal M. pneumoniae strains.
a Growth kinetics (growth index corresponding to the ratio Abs430 nm/Abs560 nm) of the clonal strains C5 (I), C20 (II) and C26 (III) analysed at an early (p2) and late passage (p15) at different induction conditions. We compare the growth of strains C5 and C20 (with one and two copies of the kill-switch KS1, respectively) when uninduced at the early passage p2 (0 mM IPTG, blue lines) or IPTG-induced that triggers the kill-switch at the passage 2 (1 mM IPTG; p2, red lines) or passage 15 (1 mM IPTG; p15, orange line). We analysed the growth of strain C26 (with KS1 and TKS2) in theophylline-medium (0.5 mM Theophylline, permissive growth conditions with both circuits inactive, blue line), or theophylline-free medium (0 mM Theophylline, slow activation of TKS2, light brown line) in the early passage p2. The growth is also analysed when both circuits are activated simultaneously in ATc and IPTG medium at passage 2 (1 mM IPTG and 50 ng/mL ATc; p2, red line) or passage 15 (1 mM IPTG and 50 ng/mL ATc; p15, orange line). The black line is a negative control of the growth index reads from an empty medium and shows the baseline of these long experiments, as the Abs560 reads have a drift (SP4, black line). Mean values from three bio-replicates. Error bars indicate standard deviation. b Escape frequency (EF) for strain C5 at several strain passages, determined as the ratio between IPTG-resistant CFUs and the total CFUs. The dashed line shows the detection limit calculated in the analysis, considering the total CFUs plated. Source data are provided as a Source Data file.

References

    1. Fraser CM, et al. The minimal gene complement of Mycoplasma genitalium. Science. 1995;270:397–399. - PubMed
    1. Himmelreich R, et al. Complete sequence analysis of the genome of the bacterium Mycoplasma pneumoniae. Nucleic Acids Res. 1996;24:4420–4449. - PMC - PubMed
    1. Karr JR, et al. A whole-cell computational model predicts phenotype from genotype. Cell. 2012;150:389–401. - PMC - PubMed
    1. Lartigue C, et al. Genome transplantation in bacteria: changing one species to another. Science. 2007;317:632–638. - PubMed
    1. Gibson DG, et al. Creation of a bacterial cell controlled by a chemically synthesized genome. Science. 2010;329:52–56. - PubMed

Publication types