. 2022 Apr 7;12(1):5848.
doi: 10.1038/s41598-022-09775-9.

Individual treatment effect estimation in the presence of unobserved confounding using proxies: a cohort study in stage III non-small cell lung cancer

Affiliations

Individual treatment effect estimation in the presence of unobserved confounding using proxies: a cohort study in stage III non-small cell lung cancer

Wouter A C van Amsterdam et al. Sci Rep. .

Abstract

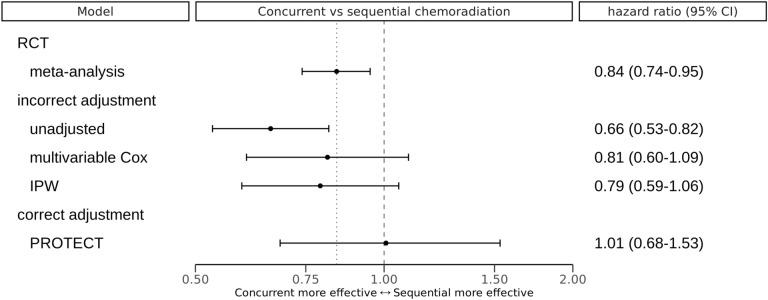
Randomized Controlled Trials (RCT) are the gold standard for estimating treatment effects but some important situations in cancer care require treatment effect estimates from observational data. We developed "Proxy based individual treatment effect modeling in cancer" (PROTECT) to estimate treatment effects from observational data when there are unobserved confounders, but proxy measurements of these confounders exist. We identified an unobserved confounder in observational cancer research: overall fitness. Proxy measurements of overall fitness exist like performance score, but the fitness as observed by the treating physician is unavailable for research. PROTECT reconstructs the distribution of the unobserved confounder based on these proxy measurements to estimate the treatment effect. PROTECT was applied to an observational cohort of 504 stage III non-small cell lung cancer (NSCLC) patients, treated with concurrent chemoradiation or sequential chemoradiation. Whereas conventional confounding adjustment methods seemed to overestimate the treatment effect, PROTECT provided credible treatment effect estimates.


Conflict of interest statement

All authors have completed the ICMJE uniform disclosure form at www.icmje.org/coi_disclosure.pdf and declare: no support from any organization for the submitted work; no financial relationships with any organizations that might have an interest in the submitted work in the previous three years; no other relationships or activities that could appear to have influenced the submitted work; PJ received consulting fees from Sanfit and Inozyme. TL is co-founder and shareholder of Quantib-U B.V. The department of radiology at the University Medical Center Utrecht has a research collaboration with Philips Healthcare. WA was a PhD student at the University Medical Center Utrecht during this work and now works at Babylon Health Inc. London United Kingdom.

Figures

Figure 1
Figure 1
The behavior-fitness causal Directed Acyclic Graph (DAG) scaffold for cancer treatment decisions. Circles indicate variables, grey-shaded variables are unobserved. Arrows point from a cause variable to an effect variable. Tumor behavior and patient fitness are unobserved variables that induce correlations between the observed variables. The definition of the treatment variable and potentially the outcome variable vary per cancer setting. Depending on the specific situation, relevant additional cause variables and effect variables for tumor behavior and patient fitness should be selected. Estimating the effect of the treatment on the outcome (potentially conditional on the other variables in the DAG) is the target application of PROTECT. The presence of the unobserved confounder fitness implies that conventional confounding adjustment methods cannot be used to estimate treatment effects from observational data, whereas the proposed method PROTECT can. Filling in additional proxies and causes of tumor behavior and patient fitness in this DAG is the first step of PROTECT. PROTECT proxy based individual treatment effect modeling in cancer.
Figure 2
Figure 2
Causal Directed Acyclic Graph (DAG) with the variables involved in the treatment selection process and overall survival for stage III non-small cell lung cancer patients. Circles indicate variables, shaded variables are unobserved. Arrows point from a cause variable to an effect variable. This DAG is a direct extension of the behavior-fitness DAG scaffold from the PROTECT method in Fig. 1. PROTECT proxy based individual treatment effect modeling in cancer, eGFR estimated glomerular filtration rate.
Figure 3
Figure 3
Overview of treatment effects estimated with different methods. The dashed vertical reference line indicates the null effect (hazard ratio of 1), the dotted reference line indicates the point estimate of the meta-analysis of RCTs by Aupérin et al.. IPW inverse-probability of treatment weighted Cox-proportional hazards model. PROTECT proxy based individual treatment effect modeling in cancer, CI confidence interval, for PROTECT credible interval; RCT randomized controlled trial.
Figure 4
Figure 4
Differences in estimated treatment effect compared to the average treatment effect for a one unit increase per variable. A unit increase means switching from ‘no’ to ‘yes’ for binary variables, and a 1 standard deviation increase from the mean for continuous variables (age). These are step-function versions of the partial dependence functions as described by Friedman. ‘other vs adeno’ indicates the effect modification of other histology type compared to adenocarcinoma. ‘squamous vs adeno’ indicates the effect modification of squamous cell carcinoma compared to adenocarcinoma. CI credible interval, eGFR estimated glomerular filtration rate, ECOG Eastern Cooperative Oncology Group performance score, IIIB clinical stage IIIB or IIIC, IIIA clinical stage IIIA, weight loss is defined as weight loss over 3% of the original weight over the six months preceding the start of follow-up.
Figure 5
Figure 5
Predicted individual treatment effects for all 504 included patients. Each patient is represented by a horizontal line indicating the 95% credible interval of the predicted hazard ratio for overall survival of concurrent chemoradiation versus sequential chemoradiation, and the point estimate. Colors are added to indicate the actually received treatment. The reference line indicates the null effect: both treatments are equally effective.

References

    1. Booth CM, Tannock IF. Randomised controlled trials and population-based observational research: Partners in the evolution of medical evidence. Br. J. Cancer. 2014;110:551–555. doi: 10.1038/bjc.2013.725. - DOI - PMC - PubMed
    1. Lewis JH, Kilgore ML, Goldman DP, Trimble EL, Kaplan R, Montello MJ, Housman MG, Escarce JJ. participation of patients 65 years of age or older in cancer clinical trials. JCO. 2003;21:1383–1389. doi: 10.1200/JCO.2003.08.010. - DOI - PubMed
    1. Vinod SK. Decision making in lung cancer—how applicable are the guidelines? Clin. Oncol. (R. Coll. Radiol.) 2015;27:125–131. doi: 10.1016/j.clon.2014.10.008. - DOI - PubMed
    1. FDA-NIH Biomarker Working Group, Predictive Biomarker (Food and Drug Administration (US), 2016; https://www.ncbi.nlm.nih.gov/books/NBK402283/). - PubMed
    1. Ettinger, D.S. NCCN Non-small cell lung cancer guideline, Version 1.2021 (2020) (available at https://www.nccn.org/professionals/physician_gls/pdf/nscl.pdf).

Publication types