. 2022 Apr 7;12(1):5888.
doi: 10.1038/s41598-022-09783-9.

The determinants of COVID-19 morbidity and mortality across countries

Affiliations

The determinants of COVID-19 morbidity and mortality across countries

Dianna Chang et al. Sci Rep. .

Abstract

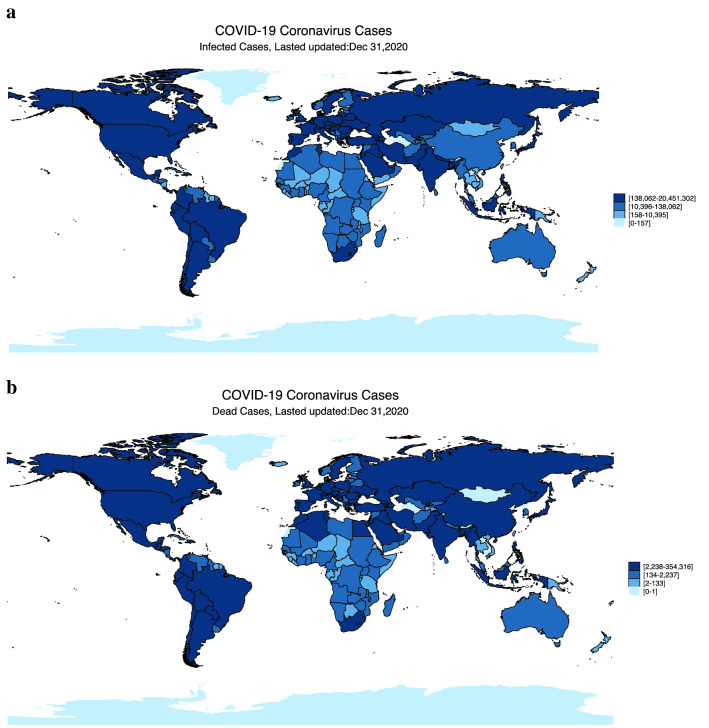
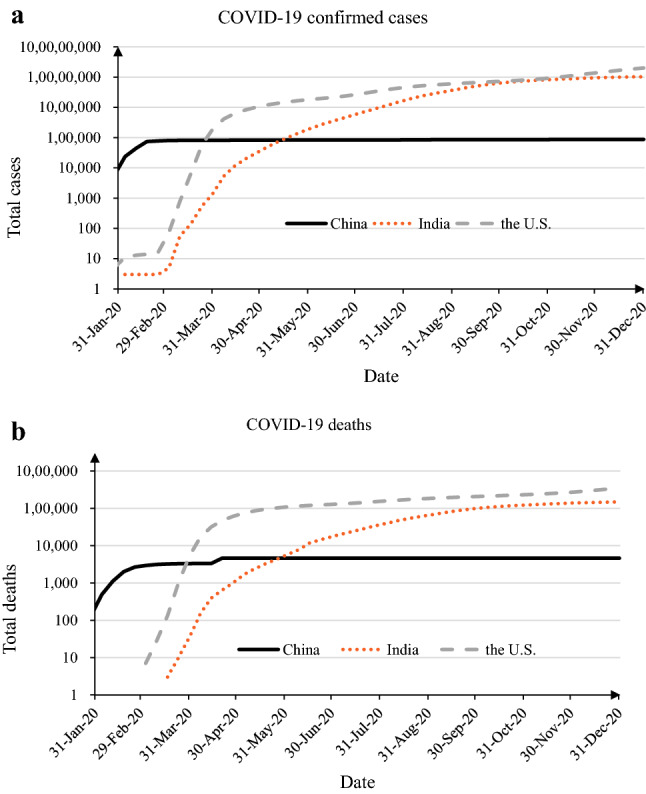
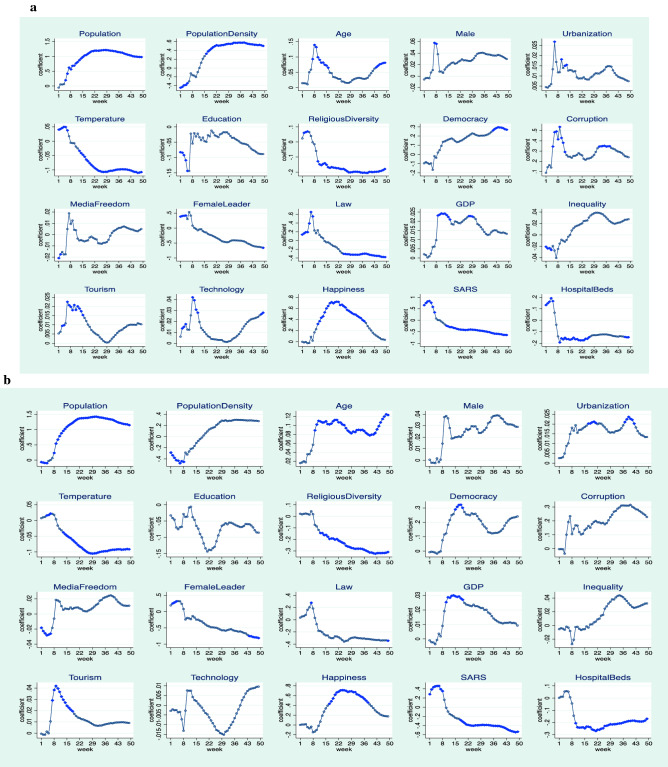
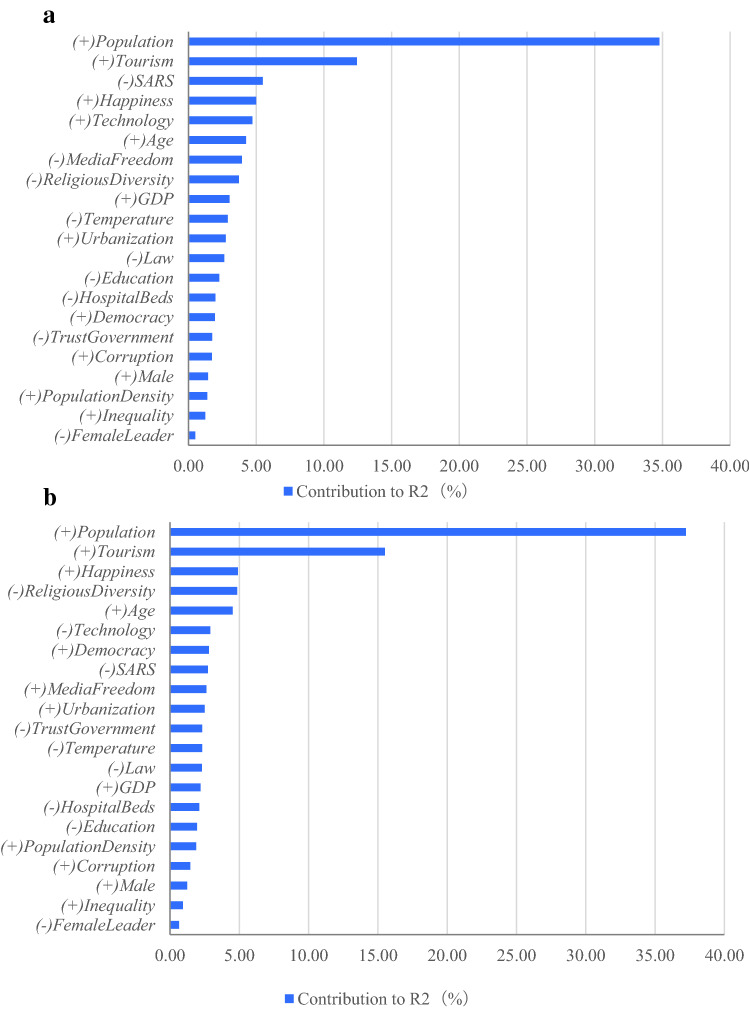
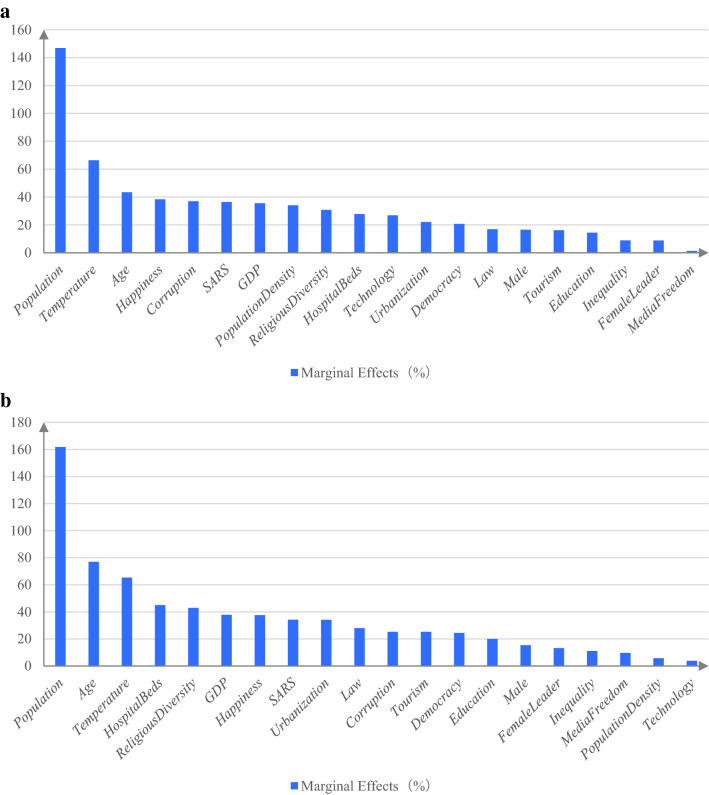
We identify 21 predetermined country-level factors that explain marked variations in weekly COVID-19 morbidity and mortality across 91 countries between January and the end of 2020. Besides factors commonly associated with infectious diseases (e.g., population and tourism activities), we discover a list of country characteristics that shape COVID-19 outcomes. Among demographic-geographic factors, the male-to-female ratio, population density, and urbanization aggravate the severity of COVID-19, while education, temperature, and religious diversity mitigate the impact of the pandemic on morbidity and mortality. For the political-legal dimension, democracy and political corruption are aggravating factors. In contrast, female leadership, the strength of legal systems, and public trust in government significantly reduce infections and deaths. In terms of socio-economic aspects, GDP per capita, income inequality, and happiness (i.e., life satisfaction) lead to worse COVID-19 outcomes. Interestingly, technology advancement increases morbidity but reduces mortality. For healthcare factors, SARS (severe acute respiratory syndrome) experience and healthcare infrastructure help countries perform better in combating the pandemic.


Conflict of interest statement

The authors declare no competing interests.

Figures

Figure 1
Figure 1
The number of confirmed COVID-19 cases and deaths across the globe. (a) Shows the distribution of the number of confirmed COVID-19 cases across the globe based on the four quintiles of total confirmed infected cases as of December 31, 2020: (1) 0 to 157, (2) 158 to 10,395, (3) 10,396 to 138,062, and (4) 138,062 to 20,451,302. The darker the color, the higher the number of confirmed COVID-19 cases in the country. For more details, please see Supplementary Information D. (b) Shows the distribution of the number of deaths across the globe based on the four quintiles of total deaths as of December 31, 2020: (1) 0 to 1, (2) 2 to 133, (3) 134 to 2237, and (4) 2238 to 354,316. The darker the color, the higher the number of COVID-19 deaths in that country.
Figure 2
Figure 2
Cumulative COVID-19 cases and deaths in China, India, and the U.S. (a) Shows the cumulative confirmed COVID-19 cases in China, India, and the U.S. between January 22, 2020 and December 31, 2020. The y-axis is on a logarithmic scale. (b) Shows the cumulative COVID-19 deaths in China, India, and the U.S. between January 22, 2020 and December 31, 2020. The y-axis is on a logarithmic scale.
Figure 3
Figure 3
The coefficients of country-level determinants by week. (a) Shows the weekly coefficients of country-level determinants over time, with the dependent variable being Ln(1 + Confirmed). The blue solid points represent coefficients significant at the 10% level, while the hollow points represent statistically insignificant coefficients. (b) shows the weekly coefficients of country-level determinants over time, with the dependent variable being Ln(1 + Death). The blue solid points represent coefficients significant at the 10% level, while the hollow points represent statistically insignificant coefficients.
Figure 4
Figure 4
Dominance analysis. (a) Shows the Shapley–Owen R2 decomposition analysis for confirmed COVID-19 cases using 21 determinants as the independent variables. The figure ranks determinants based on their contributions to R2. The sum of the contributions is 100%. A positive (negative) sign indicates whether the determinant increases (decreases) confirmed COVID-19 cases. (b) Shows the Shapley–Owen R2 decomposition analysis on COVID-19 deaths using 21 determinants as the independent variables. The figure ranks determinants based on their contributions to R2. The sum of the contributions is 100%. A positive (negative) sign indicates whether the determinant increases (decreases) deaths.
Figure 5
Figure 5
Marginal effects of a one-standard-deviation change in determinants. (a) Summarizes the marginal effects of a one-standard-deviation change for each of the determinants of confirmed COVID-19 cases. After varying each determinant by one standard deviation, the percentage change in the number of confirmed cases from the mean value is computed using the coefficients reported in Table 2. The marginal effects of all determinants are ranked in descending order based on their absolute values. (b) Summarizes the marginal effects of a one-standard-deviation change for all determinants of COVID-19 deaths. After varying each determinant by one standard deviation, the percentage change in the number of deaths from the mean value is computed using the coefficients reported in Table 2. The marginal effects of all determinants are ranked in descending order based on their absolute values.

Similar articles

Cited by

References

    1. Balmford B, Annan JD, Hargreaves JC, Altoè M, Bateman IJ. Cross-country comparisons of COVID-19: Policy, politics and the price of life. Environ. Resour. Econ. 2020;7(4):525–551. doi: 10.1007/s10640-020-00466-5. - DOI - PMC - PubMed
    1. Rocklöv J, Sjödin H. High population densities catalyze the spread of COVID-19. J. Travel Med. 2020;27(3):038. doi: 10.1093/jtm/taaa038. - DOI - PMC - PubMed
    1. Fama EF, MacBeth JD. Risk, return, and equilibrium: Empirical tests. J. Polit. Econ. 1973;81(3):607–636. doi: 10.1086/260061. - DOI
    1. Borysiewicz LK. Prevention is better than cure. The Lancet. 2010;375(9713):513–523. doi: 10.1016/S0140-6736(09)61757-8. - DOI - PubMed
    1. Nace, T. Population adjusted coronavirus cases: Top 10 countries compared. Forbes (2021). https://www.forbes.com/sites/trevornace/2020/03/22/population-adjusted-c... (Accessed 22 March 2021).

Publication types