

Systematic evaluating and modeling of SARS-CoV-2 UVC disinfection
- PMID: 35393480
- PMCID: PMC8988105
- DOI: 10.1038/s41598-022-09930-2
Systematic evaluating and modeling of SARS-CoV-2 UVC disinfection
Abstract
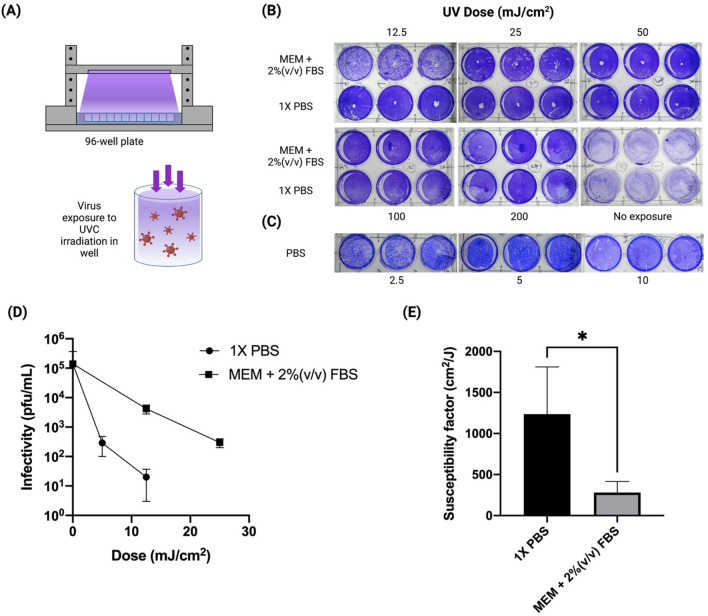
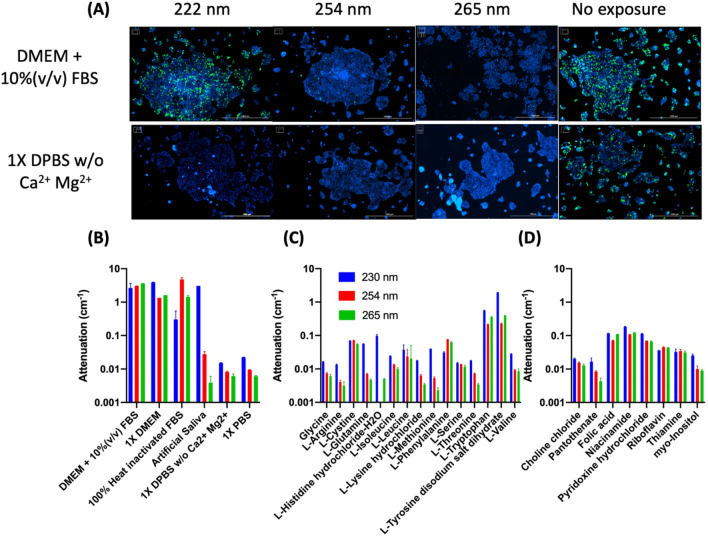
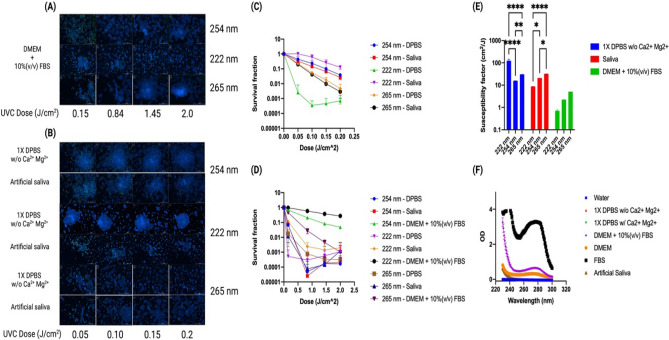
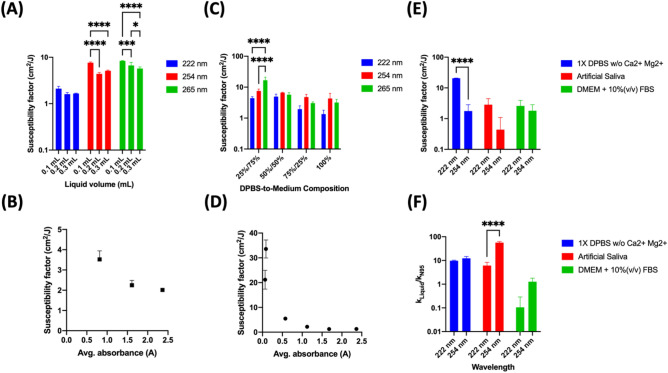
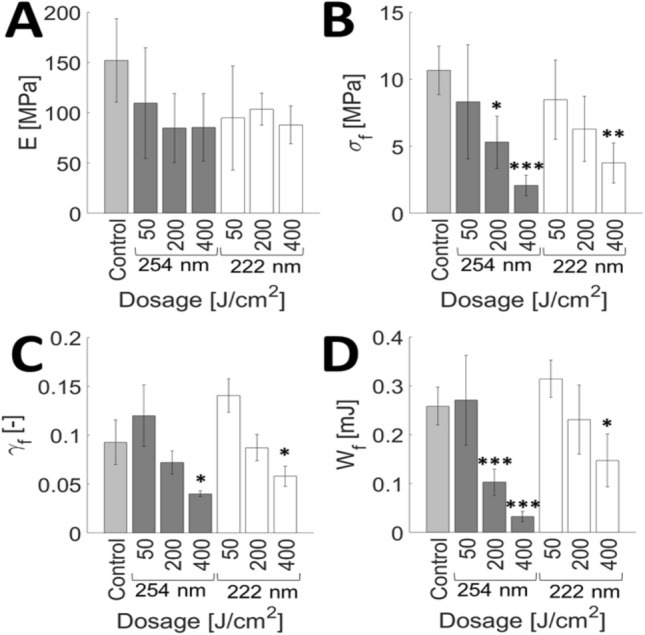
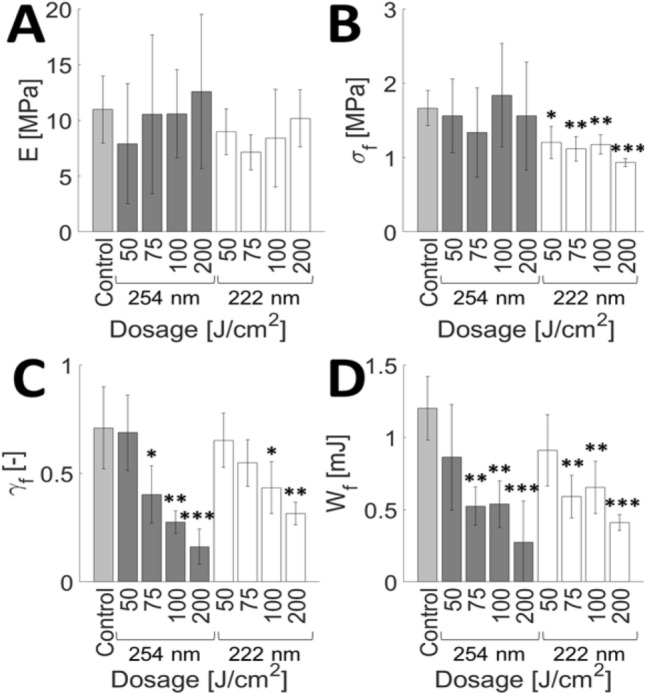
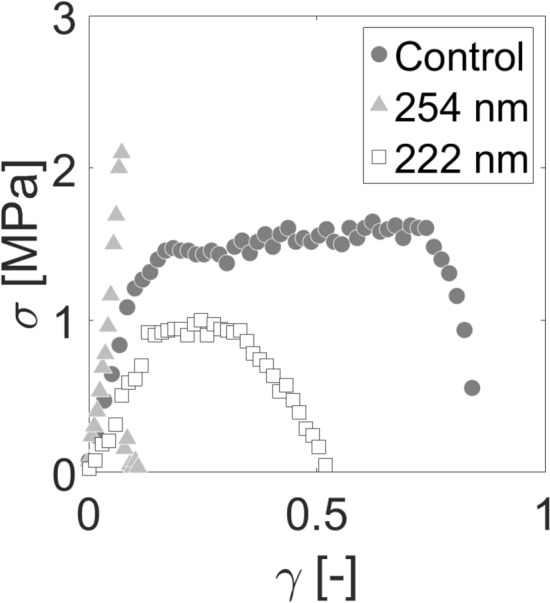
The ongoing COVID-19 global pandemic has necessitated evaluating various disinfection technologies for reducing viral transmission in public settings. Ultraviolet (UV) radiation can inactivate pathogens and viruses but more insight is needed into the performance of different UV wavelengths and their applications. We observed greater than a 3-log reduction of SARS-CoV-2 infectivity with a dose of 12.5 mJ/cm2 of 254 nm UV light when the viruses were suspended in PBS, while a dose of 25 mJ/cm2 was necessary to achieve a similar reduction when they were in an EMEM culture medium containing 2%(v/v) FBS, highlighting the critical effect of media in which the virus is suspended, given that SARS-CoV-2 is always aerosolized when airborne or deposited on a surface. It was found that SARS-CoV-2 susceptibility (a measure of the effectiveness of the UV light) in a buffer such as PBS was 4.4-fold greater than that in a cell culture medium. Furthermore, we discovered the attenuation of UVC disinfection by amino acids, vitamins, and niacinamide, highlighting the importance of determining UVC dosages under a condition close to aerosols that wrap the viruses. We developed a disinfection model to determine the effect of the environment on UVC effectiveness with three different wavelengths, 222 nm, 254 nm, and 265 nm. An inverse correlation between the liquid absorbance and the viral susceptibility was observed. We found that 222 nm light was most effective at reducing viral infectivity in low absorbing liquids such as PBS, whereas 265 nm light was most effective in high absorbing liquids such as cell culture medium. Viral susceptibility was further decreased in N95 masks with 222 nm light being the most effective. The safety of 222 nm was also studied. We detected changes to the mechanical properties of the stratum corneum of human skins when the 222 nm accumulative exposure exceeded 50 J/cm2.The findings highlight the need to evaluate each UV for a given application, as well as limiting the dose to the lowest dose necessary to avoid unnecessary exposure to the public.
© 2022. The Author(s).
Conflict of interest statement
The authors declare no competing interests.
Figures
Similar articles
-
UV Inactivation of SARS-CoV-2 across the UVC Spectrum: KrCl* Excimer, Mercury-Vapor, and Light-Emitting-Diode (LED) Sources.Appl Environ Microbiol. 2021 Oct 28;87(22):e0153221. doi: 10.1128/AEM.01532-21. Epub 2021 Sep 8. Appl Environ Microbiol. 2021. PMID: 34495736 Free PMC article.
-
UVC LED Irradiation Effectively Inactivates Aerosolized Viruses, Bacteria, and Fungi in a Chamber-Type Air Disinfection System.Appl Environ Microbiol. 2018 Aug 17;84(17):e00944-18. doi: 10.1128/AEM.00944-18. Print 2018 Sep 1. Appl Environ Microbiol. 2018. PMID: 29959245 Free PMC article.
-
SARS-CoV-2 inactivation by ultraviolet radiation and visible light is dependent on wavelength and sample matrix.J Photochem Photobiol B. 2022 Aug;233:112503. doi: 10.1016/j.jphotobiol.2022.112503. Epub 2022 Jun 23. J Photochem Photobiol B. 2022. PMID: 35779426 Free PMC article.
-
COVID-19 pandemic lesson learned- critical parameters and research needs for UVC inactivation of viral aerosols.J Hazard Mater Adv. 2022 Nov;8:100183. doi: 10.1016/j.hazadv.2022.100183. Epub 2022 Oct 12. J Hazard Mater Adv. 2022. PMID: 36619826 Free PMC article. Review.
-
Far-UVC Light at 222 nm is Showing Significant Potential to Safely and Efficiently Inactivate Airborne Pathogens in Occupied Indoor Locations.Photochem Photobiol. 2023 May-Jun;99(3):1047-1050. doi: 10.1111/php.13739. Epub 2022 Nov 21. Photochem Photobiol. 2023. PMID: 36330967 Review.
Cited by
-
Methods for SARS-CoV-2 hospital disinfection, in vitro observations.Infect Prev Pract. 2024 Jan 12;6(1):100339. doi: 10.1016/j.infpip.2024.100339. eCollection 2024 Mar. Infect Prev Pract. 2024. PMID: 38317676 Free PMC article.
-
Surface Environment and Energy Density Effects on the Detection and Disinfection of Microorganisms Using a Portable Instrument.Sensors (Basel). 2023 Feb 14;23(4):2135. doi: 10.3390/s23042135. Sensors (Basel). 2023. PMID: 36850732 Free PMC article.
-
Evaluation of the killing effects of UV254 light on common airborne porcine viruses.Front Vet Sci. 2025 Jan 31;12:1512387. doi: 10.3389/fvets.2025.1512387. eCollection 2025. Front Vet Sci. 2025. PMID: 39958803 Free PMC article.
-
Portable and Air Conditioner-Based Bio-Protection Devices to Prevent Airborne Infections in Acute and Long-Term Healthcare Facilities, Public Gathering Places, Public Transportation, and Similar Entities.Cureus. 2024 Mar 11;16(3):e55950. doi: 10.7759/cureus.55950. eCollection 2024 Mar. Cureus. 2024. PMID: 38469370 Free PMC article.
-
UVC-Based Air Disinfection Systems for Rapid Inactivation of SARS-CoV-2 Present in the Air.Pathogens. 2023 Mar 7;12(3):419. doi: 10.3390/pathogens12030419. Pathogens. 2023. PMID: 36986341 Free PMC article.
References
-
- CDC. Emerging Variants. https://www.cdc.gov/coronavirus/2019-ncov/more/science-and-research/scie... (2020).
Publication types
MeSH terms
LinkOut - more resources
Full Text Sources
Medical
Miscellaneous
