

The CMS19 disease model specifies a pivotal role for collagen XIII in bone homeostasis
- PMID: 35393492
- PMCID: PMC8990013
- DOI: 10.1038/s41598-022-09653-4
The CMS19 disease model specifies a pivotal role for collagen XIII in bone homeostasis
Abstract
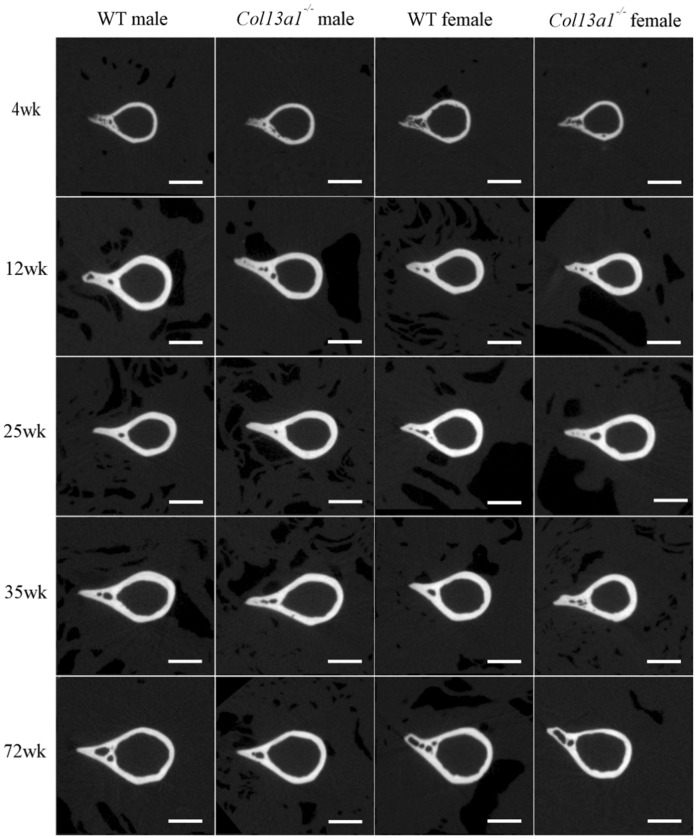
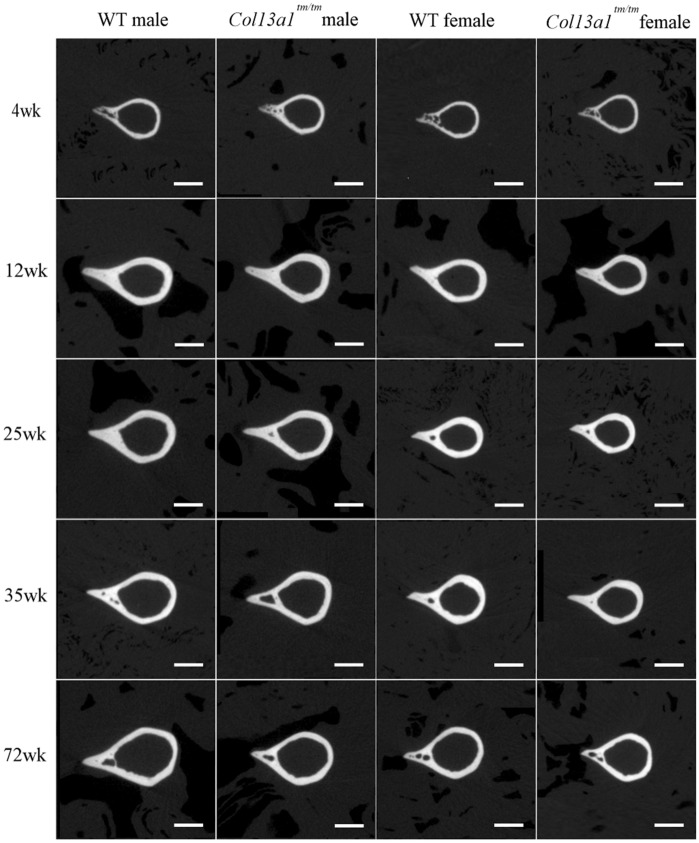
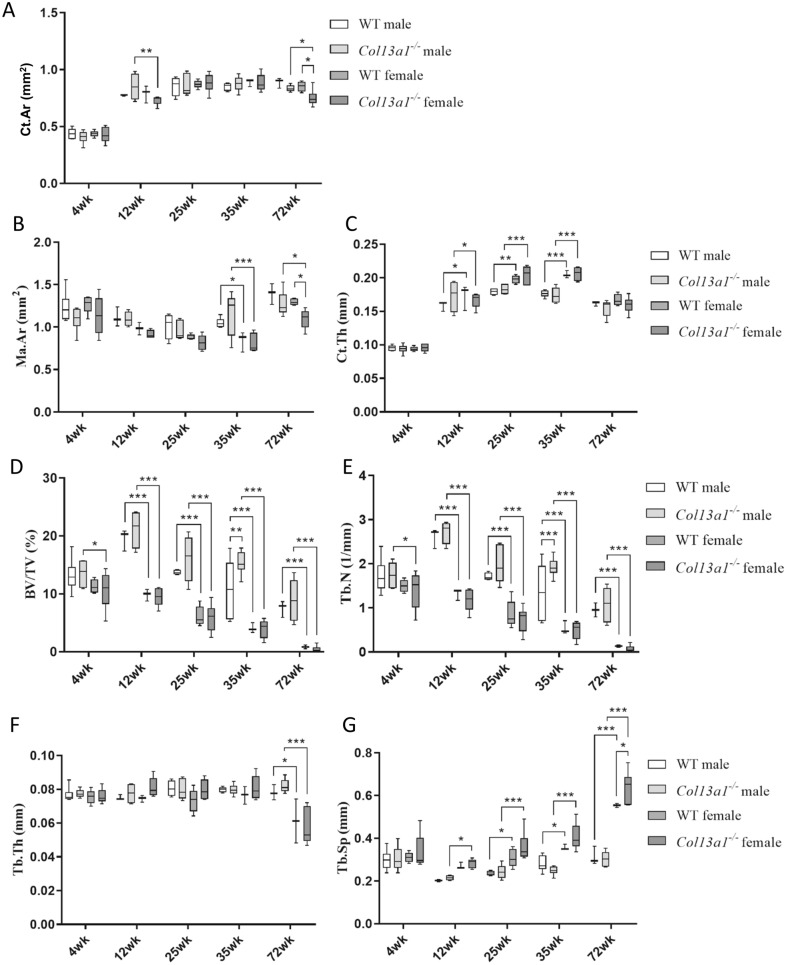
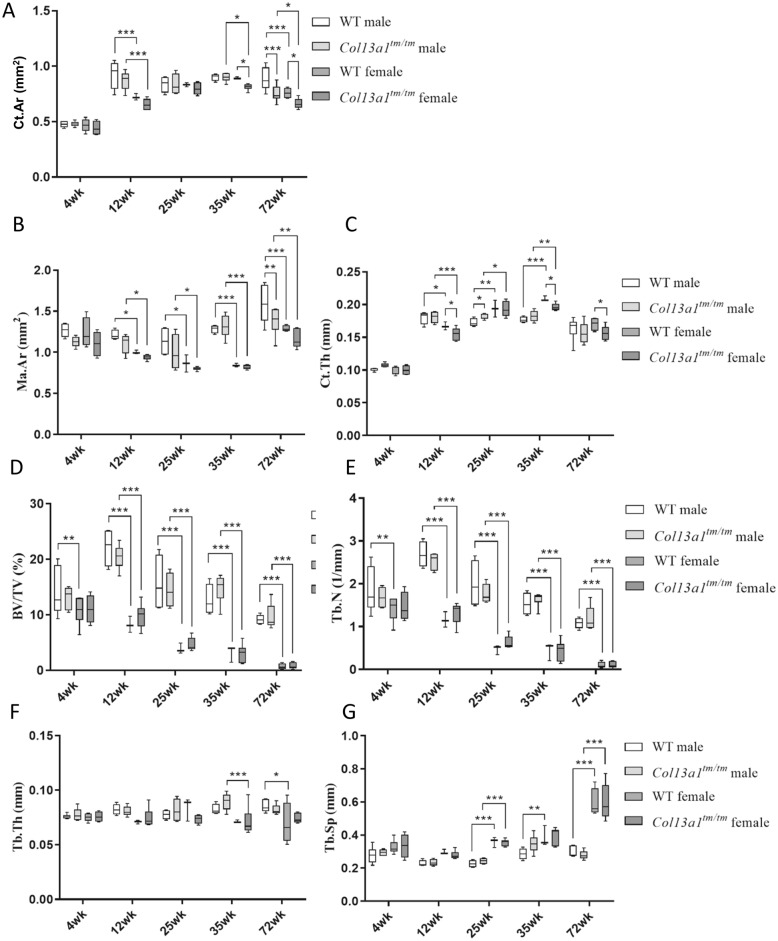
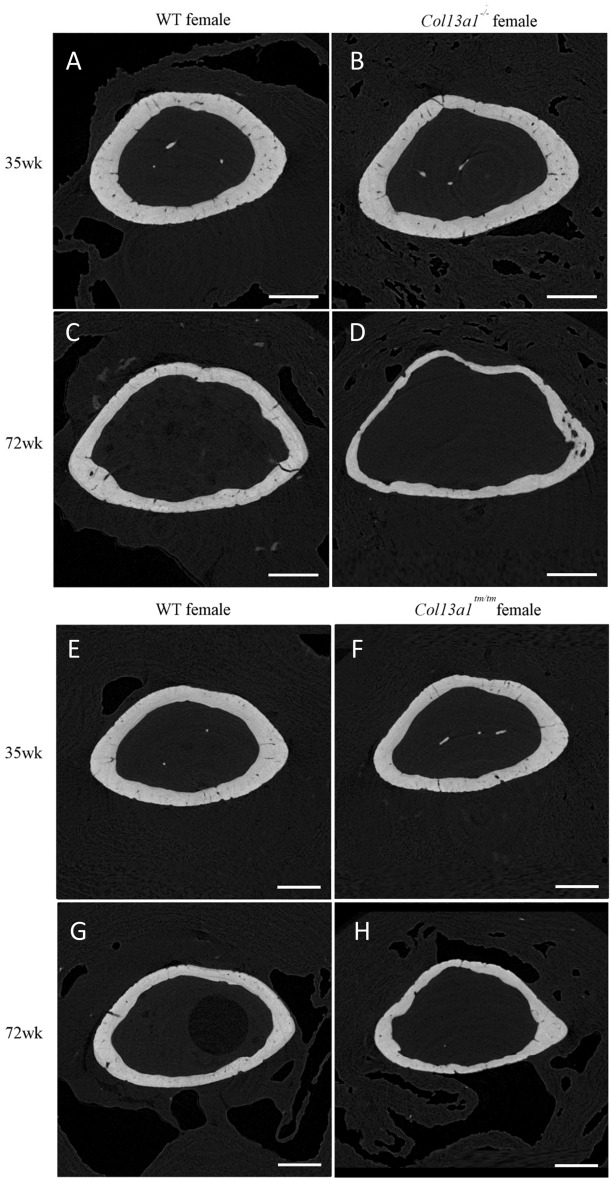
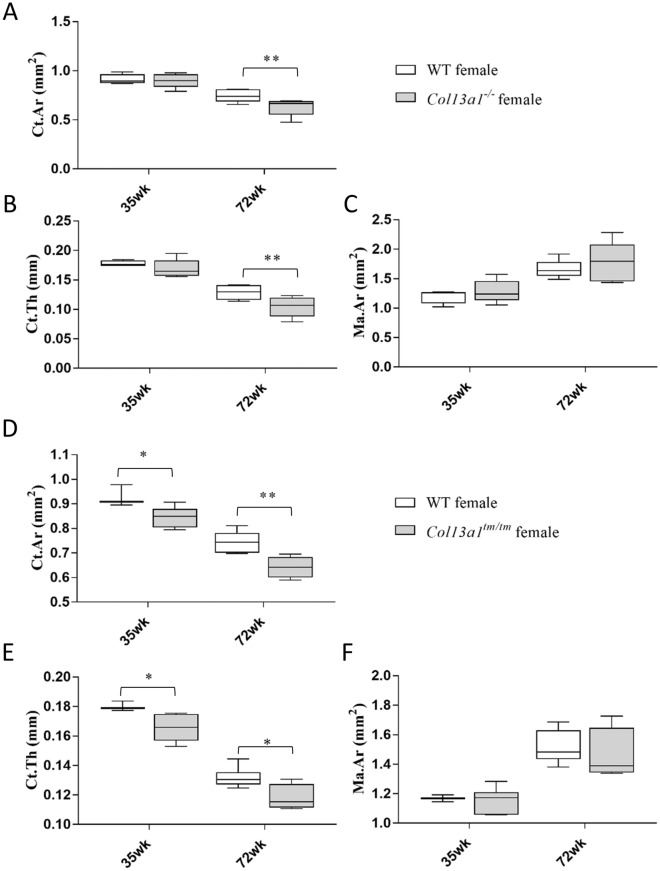
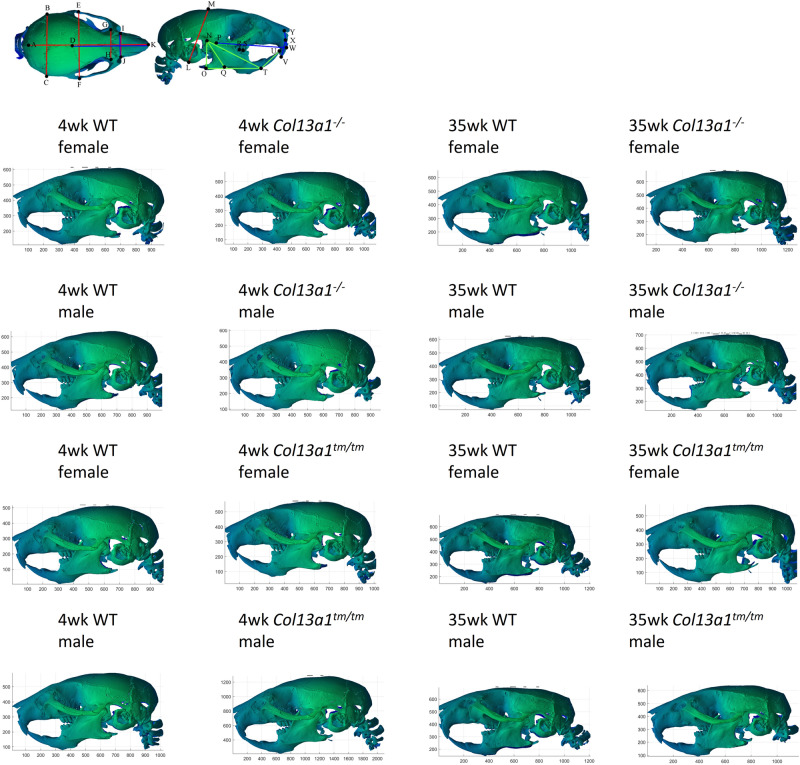
Mutations in the COL13A1 gene result in congenital myasthenic syndrome type 19 (CMS19), a disease of neuromuscular synapses and including various skeletal manifestations, particularly facial dysmorphisms. The phenotypic consequences in Col13a1 null mice (Col13a1-/-) recapitulate the muscle findings of the CMS19 patients. Collagen XIII (ColXIII) is exists as two forms, a transmembrane protein and a soluble molecule. While the Col13a1-/- mice have poorly formed neuromuscular junctions, the prevention of shedding of the ColXIII ectodomain in the Col13a1tm/tm mice results in acetylcholine receptor clusters of increased size and complexity. In view of the bone abnormalities in CMS19, we here studied the tubular and calvarial bone morphology of the Col13a1-/- mice. We discovered several craniofacial malformations, albeit less pronounced ones than in the human disease, and a reduction of cortical bone mass in aged mice. In the Col13a1tm/tm mice, where ColXIII is synthesized but the ectodomain shedding is prevented due to a mutation in a protease recognition sequence, the cortical bone mass decreased as well with age and the cephalometric analyses revealed significant craniofacial abnormalities but no clear phenotypical pattern. To conclude, our data indicates an intrinsic role for ColXIII, particularly the soluble form, in the upkeep of bone with aging and suggests the possibility of previously undiscovered bone pathologies in patients with CMS19.
© 2022. The Author(s).
Conflict of interest statement
The authors declare no competing interests.
Figures
Similar articles
-
Congenital Myasthenic Syndrome Type 19 Is Caused by Mutations in COL13A1, Encoding the Atypical Non-fibrillar Collagen Type XIII α1 Chain.Am J Hum Genet. 2015 Dec 3;97(6):878-85. doi: 10.1016/j.ajhg.2015.10.017. Epub 2015 Nov 25. Am J Hum Genet. 2015. PMID: 26626625 Free PMC article.
-
Collagen XIII secures pre- and postsynaptic integrity of the neuromuscular synapse.Hum Mol Genet. 2017 Jun 1;26(11):2076-2090. doi: 10.1093/hmg/ddx101. Hum Mol Genet. 2017. PMID: 28369367
-
Correct expression and localization of collagen XIII are crucial for the normal formation and function of the neuromuscular system.Eur J Neurosci. 2019 Jun;49(11):1491-1511. doi: 10.1111/ejn.14346. Epub 2019 Feb 8. Eur J Neurosci. 2019. PMID: 30667565
-
Synaptic basal lamina-associated congenital myasthenic syndromes.Ann N Y Acad Sci. 2012 Dec;1275:36-48. doi: 10.1111/j.1749-6632.2012.06807.x. Ann N Y Acad Sci. 2012. PMID: 23278576 Review.
-
Collagen XIII: a type II transmembrane protein with relevance to musculoskeletal tissues, microvessels and inflammation.Int J Biochem Cell Biol. 2012 May;44(5):714-7. doi: 10.1016/j.biocel.2012.01.024. Epub 2012 Feb 8. Int J Biochem Cell Biol. 2012. PMID: 22342189 Review.
Cited by
-
Understanding bladder cancer by genome-wide association studies.Transl Androl Urol. 2024 Feb 29;13(2):363-365. doi: 10.21037/tau-23-507. Epub 2024 Feb 20. Transl Androl Urol. 2024. PMID: 38481859 Free PMC article. No abstract available.
-
Transcriptome landscape comparison of periodontium in developmental and renewal stages.Front Endocrinol (Lausanne). 2023 Mar 15;14:1154931. doi: 10.3389/fendo.2023.1154931. eCollection 2023. Front Endocrinol (Lausanne). 2023. PMID: 37008900 Free PMC article.
-
The Caenorhabditis elegans cuticle and precuticle: a model for studying dynamic apical extracellular matrices in vivo.Genetics. 2024 Aug 7;227(4):iyae072. doi: 10.1093/genetics/iyae072. Genetics. 2024. PMID: 38995735 Free PMC article. Review.
-
Clinical and Pathologic Features of Congenital Myasthenic Syndromes Caused by 35 Genes-A Comprehensive Review.Int J Mol Sci. 2023 Feb 13;24(4):3730. doi: 10.3390/ijms24043730. Int J Mol Sci. 2023. PMID: 36835142 Free PMC article. Review.
-
Contribution of collagen XIII to lung function and development of pulmonary fibrosis.BMJ Open Respir Res. 2023 Dec 12;10(1):e001850. doi: 10.1136/bmjresp-2023-001850. BMJ Open Respir Res. 2023. PMID: 38568728 Free PMC article.
References
-
- Bateman JF, Boot-Handford RP, Lamande SR. Genetic diseases of connective tissues: Cellular and extracellular effects of ECM mutations. Nat. Rev. Genet. 2009;10:173–183. - PubMed
-
- Sainio A, Jarvelainen H. Extracellular matrix macromolecules as potential targets of cardiovascular pharmacotherapy. Adv. Pharmacol. 2018;81:209–240. - PubMed
-
- Heikkinen A, Tu H, Pihlajaniemi T. Collagen XIII: A type II transmembrane protein with relevance to musculoskeletal tissues, microvessels and inflammation. Int. J. Biochem. Cell Biol. 2012;44:714–717. - PubMed
-
- Izzi V, et al. Exploring the roles of MACIT and multiplexin collagens in stem cells and cancer. Semin. Cancer Biol. 2019;62:134–148. - PubMed
MeSH terms
Substances
Grants and funding
LinkOut - more resources
Full Text Sources
Molecular Biology Databases
