. 2022 Apr 7;12(1):5863.
doi: 10.1038/s41598-022-09676-x.

Detection and discrimination of neutron capture events for NCEPT dose quantification

Affiliations

Detection and discrimination of neutron capture events for NCEPT dose quantification

Andrew Chacon et al. Sci Rep. .

Abstract

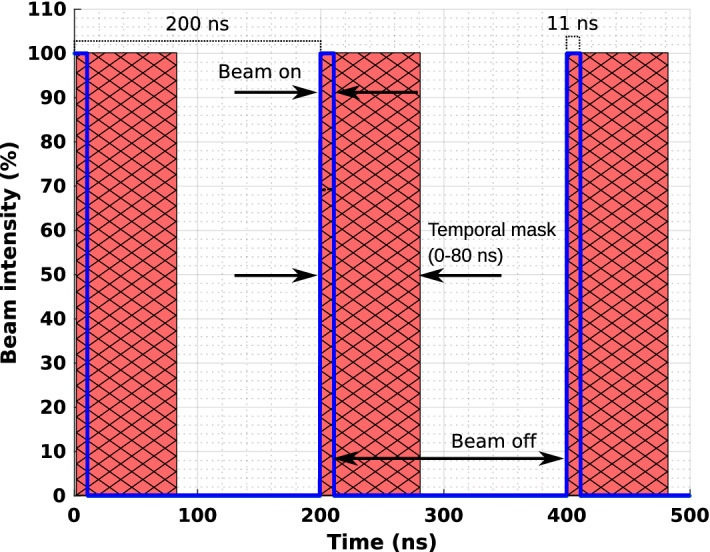
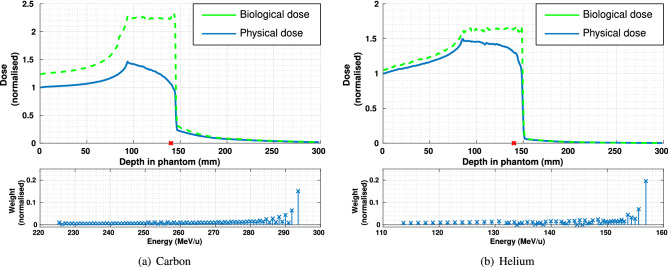
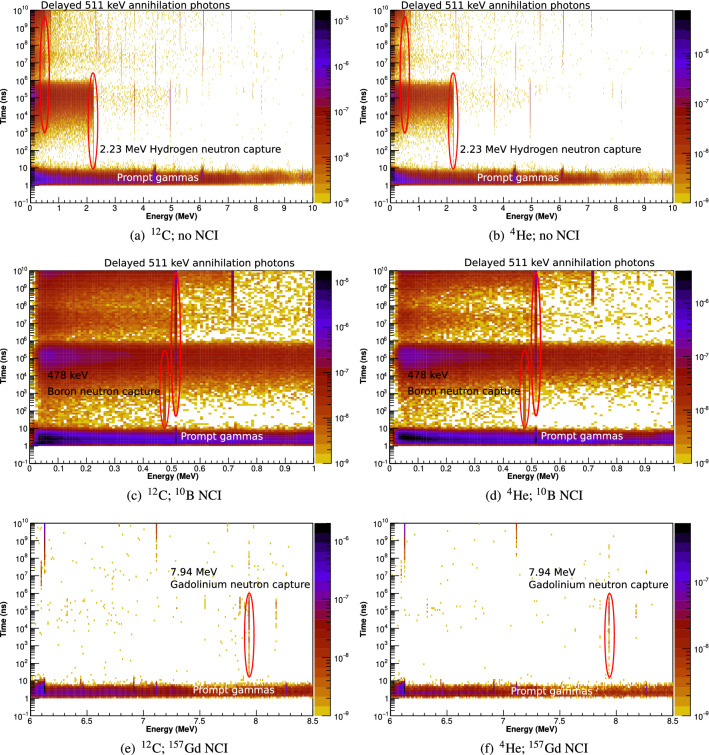
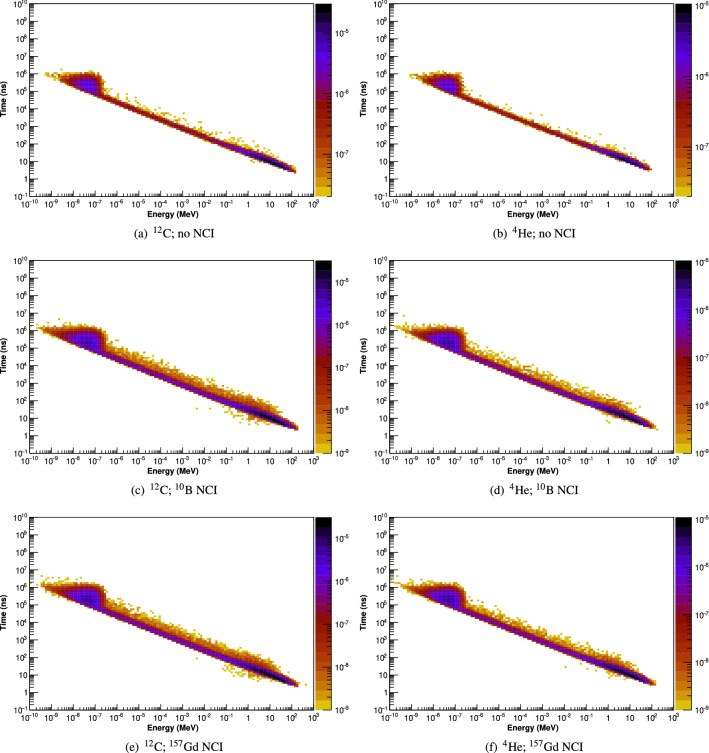
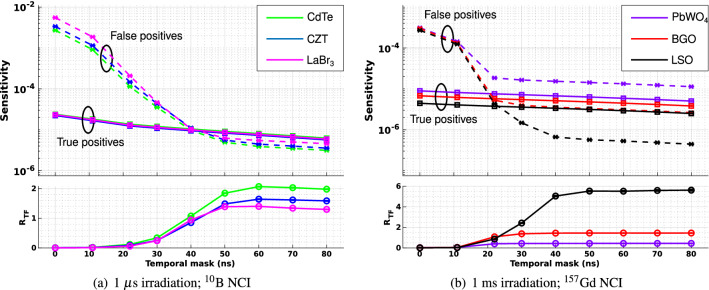
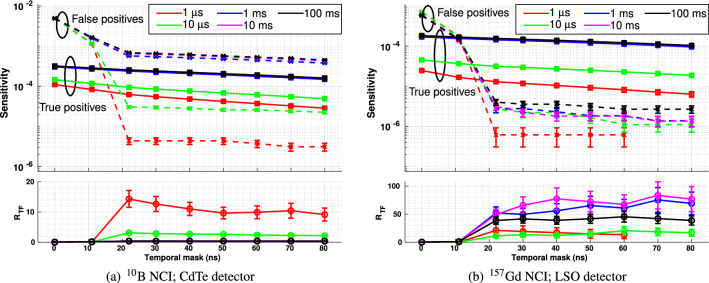
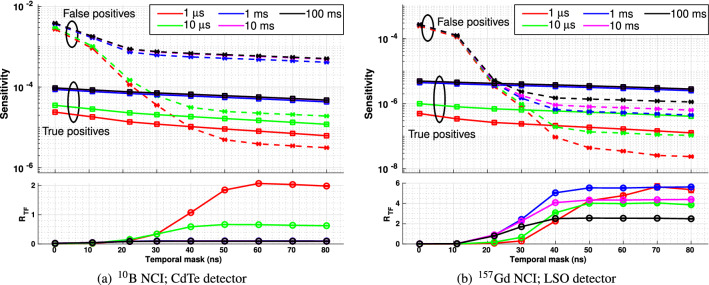
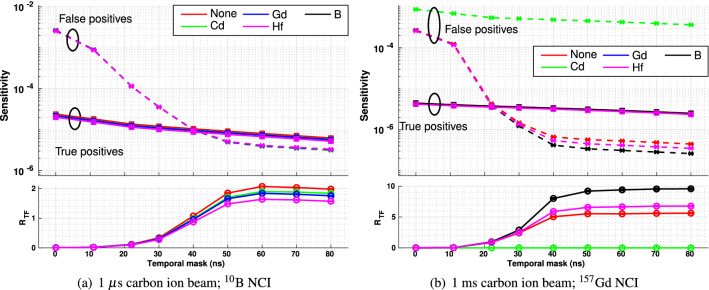
Neutron Capture Enhanced Particle Therapy (NCEPT) boosts the effectiveness of particle therapy by capturing thermal neutrons produced by beam-target nuclear interactions in and around the treatment site, using tumour-specific [Formula: see text]B or [Formula: see text]Gd-based neutron capture agents. Neutron captures release high-LET secondary particles together with gamma photons with energies of 478 keV or one of several energies up to 7.94 MeV, for [Formula: see text]B and [Formula: see text]Gd, respectively. A key requirement for NCEPT's translation is the development of in vivo dosimetry techniques which can measure both the direct ion dose and the dose due to neutron capture. In this work, we report signatures which can be used to discriminate between photons resulting from neutron capture and those originating from other processes. A Geant4 Monte Carlo simulation study into timing and energy thresholds for discrimination of prompt gamma photons resulting from thermal neutron capture during NCEPT was conducted. Three simulated [Formula: see text] mm[Formula: see text] cubic PMMA targets were irradiated by [Formula: see text]He or [Formula: see text]C ion beams with a spread out Bragg peak (SOBP) depth range of 60 mm; one target is homogeneous while the others include [Formula: see text] mm[Formula: see text] neutron capture inserts (NCIs) of pure [Formula: see text]B or [Formula: see text]Gd located at the distal edge of the SOBP. The arrival times of photons and neutrons entering a simulated [Formula: see text] mm[Formula: see text] ideal detector were recorded. A temporal mask of 50-60 ns was found to be optimal for maximising the discrimination of the photons resulting from the neutron capture by boron and gadolinium. A range of candidate detector and thermal neutron shielding materials were simulated, and detections meeting the proposed acceptance criteria (i.e. falling within the target energy window and arriving 60 ns post beam-off) were classified as true or false positives, depending on their origin. The ratio of true/false positives ([Formula: see text]) was calculated; for targets with [Formula: see text]B and [Formula: see text]Gd NCIs, the detector materials which resulted in the highest [Formula: see text] were cadmium-shielded CdTe and boron-shielded LSO, respectively. The optimal irradiation period for both carbon and helium ions was 1 µs for the [Formula: see text]B NCI and 1 ms for the [Formula: see text]Gd NCI.


Conflict of interest statement

The authors declare no competing interests.

Figures

Figure 1
Figure 1
Schematic of the simulation configuration.
Figure 2
Figure 2
The micro-structure of the beam during the first 500 ns. This pattern is repeated for the entire irradiation period. The red hashed region indicates the range of the timing mask, during which events are rejected; events occurring outside of this range will be accepted.
Figure 3
Figure 3
Depth-dose profiles (upper plot; blue = physical dose, green = biological dose) and energy spectra (lower plots) of polyenergetic carbon and helium ion beams; a red ‘X’ along the axis denotes the centroid of the NCI region.
Figure 4
Figure 4
The arrival-time/energy spectrograms of neutrons entering the NCI region per incident particle following irradiation by polyenergetic carbon and helium ion beams. A vertical red dashed line is drawn at energy = 0.4 eV.
Figure 5
Figure 5
The energy/arrival-time spectrograms of photons entering the detector following an instantaneous irradiation by polyenergetic carbon and helium ion beams.
Figure 6
Figure 6
The energy/arrival-time spectrograms of neutrons entering the detector following irradiation by polyenergetic carbon and helium ion beams.
Figure 7
Figure 7
Sensitivity (upper plot) and RTF (lower plot) of events detected using different detector materials following irradiation by a carbon ion beam. For the 10B NCI, magenta denotes the LaBr3 detector, green the CdTe detector and blue the CZT detector. For 157Gd NCI, red denotes the BGO detector, black the LSO detector and purple the PbWO4 detector. In the upper plots in each subfigure, square markers () joined by unbroken lines denote true positives, while cross markers (×) joined by dashed lines denote false positives.
Figure 8
Figure 8
Sensitivity (upper plot) and RTF (lower plot) for photon detections only following target irradiation by a carbon ion beam as a function of temporal mask duration for a range of different irradiation periods. In all plots, the red markers denote a total irradiation time of 1 µs, green 10 µs, blue 1 ms, magenta 10 ms and black 100 ms. In the upper plots in each subfigure, square markers () joined by unbroken lines denote true positives, while cross markers (×) joined by dashed lines denote false positives.
Figure 9
Figure 9
Sensitivity (upper plot) and RTF (lower plot) for all detected events following target irradiation by a carbon ion beam as a function of temporal mask duration for a range of different irradiation periods. In all plots, the red markers denote a total irradiation time of 1 µs, green 10 µs, blue 1 ms, magenta 10 ms and black 100 ms. In the upper plots in each subfigure, square markers () joined by unbroken lines denote true positives, while cross markers (×) joined by dashed lines denote false positives.
Figure 10
Figure 10
Sensitivity (upper plot) and RTF (lower plot) for events recorded in a detector shielded by different materials with high thermal neutron cross-section, following target irradiation by a carbon ion beam. In all plots, the red markers denote an unshielded detector, green cadmium shielding, blue gadolinium shielding (10B NCI only), black boron shielding (157Gd NCI only), and magenta hafnium shielding. In the upper plots in each subfigure, square markers () joined by unbroken lines denote true positives, while cross markers (×) joined by dashed lines denote false positives.

References

    1. Safavi-Naeini M, et al. Opportunistic dose amplification for proton and carbon ion therapy via capture of internally generated thermal neutrons. Sci. Rep. 2018 doi: 10.1038/s41598-018-34643-w. - DOI - PMC - PubMed
    1. Sauerwein, W., Wittig, A., Moss, R. & Nakagawa, Y. (eds.). Neutron Capture Therapy, 164–165 (Springer, 2012). 10.1007/978-3-642-31334-9.
    1. Goorley T, Nikjoo H. Electron and photon spectra for three gadolinium-based cancer therapy approaches. Radiat. Res. 2000;154:556–563. doi: 10.1667/0033-7587(2000)154[0556:eapsft]2.0.co;2. - DOI - PubMed
    1. Tanaka T, et al. Gamma-ray spectra from thermal neutron capture on gadolinium-155 and natural gadolinium. Prog. Theor. Exp. Phys. 2020 doi: 10.1093/ptep/ptaa015. - DOI
    1. Dymova MA, Taskaev SY, Richter VA, Kuligina EV. Boron neutron capture therapy: Current status and future perspectives. Cancer Commun. 2020;40:406–421. doi: 10.1002/cac2.12089. - DOI - PMC - PubMed

Publication types