. 2022 Jun;18(6):643-651.
doi: 10.1038/s41589-022-01003-9. Epub 2022 Apr 7.

Nascent alt-protein chemoproteomics reveals a pre-60S assembly checkpoint inhibitor

Affiliations

Nascent alt-protein chemoproteomics reveals a pre-60S assembly checkpoint inhibitor

Xiongwen Cao et al. Nat Chem Biol. 2022 Jun.

Abstract

Many unannotated microproteins and alternative proteins (alt-proteins) are coencoded with canonical proteins, but few of their functions are known. Motivated by the hypothesis that alt-proteins undergoing regulated synthesis could play important cellular roles, we developed a chemoproteomic pipeline to identify nascent alt-proteins in human cells. We identified 22 actively translated alt-proteins or N-terminal extensions, one of which is post-transcriptionally upregulated by DNA damage stress. We further defined a nucleolar, cell-cycle-regulated alt-protein that negatively regulates assembly of the pre-60S ribosomal subunit (MINAS-60). Depletion of MINAS-60 increases the amount of cytoplasmic 60S ribosomal subunit, upregulating global protein synthesis and cell proliferation. Mechanistically, MINAS-60 represses the rate of late-stage pre-60S assembly and export to the cytoplasm. Together, these results implicate MINAS-60 as a potential checkpoint inhibitor of pre-60S assembly and demonstrate that chemoproteomics enables hypothesis generation for uncharacterized alt-proteins.


Figures

Extended Data Fig. 1 ∣
Extended Data Fig. 1 ∣. Overview of BONCAT-based chemoproteomics method optimization.
a, Size distribution of canonical, annotated proteins detected from vehicle HEK 293T lysate subjected to gel-based microprotein isolation (control 1), AHA-labeled HEK 293T lysate subjected to Click chemistry with biotin, 3 kDa MWCO membrane removal of excess biotin, streptavidin enrichment and gel-based microprotein isolation (old BONCAT), vehicle HEK 293T lysate subjected to C8 column-based microprotein isolation (control 2), or AHA-labeled HEK 293T lysate subjected to on-bead direct capture and digest after C8 column-based size selection (new BONCAT). Error bars, standard error of the mean (s.e.m.), N = 4 (two biologically independent experiments, each with two technical replicates). b, Expression level distribution of canonical, annotated proteins detected from the four strategies described above. Error bars, standard error of the mean (s.e.m.), N = 4 (two biologically independent experiments, each with two technical replicates). c, Venn diagram of the reproducibility of control samples (c, left, DMSO) and AHA-labeled samples (c, right, Arsenite). d, Venn diagram of detected annotated proteins from combined DMSO or DTT treatment samples. e, GO (KEGG) analysis of the 2,299 DTT-induced genes with g:Profiler identified processes associated with endoplasmic reticulum stress and proteostasis (e.g., proteasome, mRNA surveillance pathway). f, Distribution of locations of identified alt-ORFs relative to annotated coding sequences (CDS). g, Venn diagram of alt-proteins identified under control or combined stress conditions. h, Top: Schematic representation of human CNPY2 transcript variant (tv) 1 or CACTIN tv 1; light gray arrow, 5' and 3' untranslated regions; red, alt-ORF; black, annotated protein CDS. Middle: Schematic representation of the expression construct containing complete 5'UTR and alt-ORF of the transcript indicated above, with a FLAG-HA appended to the C-terminus of the alt-protein. Bottom: HEK 293T cells transfected with the expression construct were immunostained with anti-HA (red) and DAPI (cyan). Scale bar, 10 μm. Data are representative of three biological replicates.
Extended Data Fig. 2 ∣
Extended Data Fig. 2 ∣. BONCAT-based chemoproteomic identification of newly synthesized alt-proteins.
a,b, Extracted ion chromatograms (EICs) from MS1 spectra corresponding to tryptic peptides from alt-CNPY2 (a) or alt-PRH1 (b) under control (DMSO) vs. stress (DNA damage vs. oxidative damage, respectively) conditions. c-h, MS/MS spectra of tryptic peptides assigned to alt-DRAP1 (c), alt-PRR3 (d), alt-PRH1 (e), alt-CNPY2 (f), alt-CACTIN (g), and MINAS-60 (h) using BONCAT in HEK 293T cells.
Extended Data Fig. 3 ∣
Extended Data Fig. 3 ∣. MINAS-60 is cell-cycle regulated, and translated from multiple start codons.
a, Immunostaining of synchronized MINAS-60 KI cells released from the G1/S boundary by a double thymidine block at the indicated time points with anti-HA (red), anti-fibrillarin (green), and DAPI (cyan). Scale bar, 10 μm. Data are representative of three biological replicates. b, Schematic representation of the region of human RBM10 tv 1 with candidate MINAS-60 start codons indicated. The ATG start codon of RBM10 is highlighted in red, and the two upstream non-ATG and seven internal ATG start codons that are upstream of and in-frame with the detected tryptic fragment of MINAS-60 are indicated in black. c,d, Expression of a construct containing the full 5'UTR and wild-type MINAS-60 coding sequence (WT, lane 1), or MINAS-60 coding sequence with each candidate start codon deletion (del, lanes 2-5, c), or mutation (lane 2-8, d), indicated on the top derived from RBM10 tv 1, with an HA tag appended to the C-terminus of MINAS-60, in HEK 293T cells was followed by immunoblotting with the antibodies indicated to the right. Untransfected (no transfection) HEK 293T cells served as a control. Data are representative of three biological replicates. e, Expression of a construct containing the full 5'UTR and MINAS-60 coding sequence (WT, lane 2), or ATG1 to the C-terminus of MINAS-60 (ATG1-C, lane 3), or ATG6 to the C-terminus of MINAS-60 (ATG6-C, lane 4) derived from RBM10 tv 1, with an HA tag appended to the C-terminus of MINAS-60, in HEK 293T cells was followed by immunoblotting with the antibodies indicated to the right. Untransfected HEK 293T cells served as a control. Data are representative of three biological replicates. f, HEK 293T cells were transfected with ATG1-C or ATG6-C of MINAS-60, followed by immunostaining with anti-HA (red), anti-fibrillarin (green), and DAPI (cyan). Scale bar, 10 μm. Data are representative of three biological replicates.
Extended Data Fig. 4 ∣
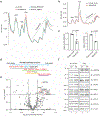
Extended Data Fig. 4 ∣. MINAS-60 associates with ribosomal large subunit (LSU) biogenesis factors.
a, Coomassie blue staining of FLAG-IP from control (293T) or MINAS-60 KI (MINAS-60-KI) HEK 293T cells. Two major enriched bands from the KI FLAG-IP are indicated with black arrows, and MINAS-60 bands are indicated with stars. b, Volcano plot of quantitative proteomics (N = 3 biologically independent experiments) of gel bands (25-45 kDa) excised from MINAS-60 KI (KI) or control (Ctrl) HEK 293T nuclear lysate FLAG-IP samples after SDS-PAGE. LSU biogenesis factors are indicated in red and the gene names are labeled. For complete quantitative proteomics results, see Supplementary Data S5-6. c, GO (biological processes) analysis of genes enriched (fold change ≥ 30) in MINAS-60 KI FLAG-IP over control with g:Profiler.
Extended Data Fig. 5 ∣
Extended Data Fig. 5 ∣. MINAS-60 downregulates global protein synthesis and cell proliferation.
a, Western blot analysis of HEK 293T stably expressing empty pLKO.1 vector control (lane 1, sh-ctrl), one of the two RBM10 shRNAs (lane 2, sh-RBM10-1 (a, left), sh-RBM10-2 (a, right), rescue with MINAS-60 (lane 3, Rescue_MINAS-60), rescue with RBM10 (lane 4, Rescue_RBM10), or rescue with RBM10 bearing an A398TG to TAA mutation (lane 5, Rescue_RBM10(A398TG-TAA). Data are representative of three biological replicates. b, Quantitative RT-PCR of the cell lines described above with primers specific to RBM10. Error bars, standard error of the mean (s.e.m.), N = 4 biologically independent samples, one-way ANOVA (Dunnett’s test). c,d, HEK 293T cells stably expressing empty pLKO.1 vector control (sh-Ctrl), one of the two RBM10 shRNA (sh-RBM10-1 (c) sh-RBM10-2 (d), rescue with MINAS-60 (Rescue_MINAS-60), rescue with RBM10 (Rescue_RBM10), or rescue with RBM10 bearing an A398TG to TAA mutation [Rescue_RBM10(A398TG-TAA)] were treated with 1 μM puromycin for 1 hour at 37°C before harvesting and western blotting with anti-puromycin antibody. Coomassie staining served as a loading control. Data are representative of three biological replicates. e, ImageJ was used to quantify the relative puromycin incorporation for cells indicated at the bottom relative to sh-Ctrl from three biological replicates. Data represent mean values ± s.e.m., and significance was evaluated with one-way ANOVA (Dunnett’s test). f, Growth curve of control (sh-Ctrl), RBM10 knockdown with a second shRNA (sh-RBM10-2), rescue with MINAS-60 (Rescue_MINAS-60) and rescue with RBM10 (Rescue_RBM10) HEK 293T cells at the indicated number of days (N = 3). Data represent mean values ± s.e.m., and significance was evaluated with two-way ANOVA (Dunnett’s test).
Extended Data Fig. 6 ∣
Extended Data Fig. 6 ∣. The C-terminal region of MINAS-60 is required for its interactions and function.
a, Top: Schematic representation of the domain structures of the wild-type (full-length, FL) and deletion mutants of MINAS-60, with amino acid residue numbers above. GTPBP4 and MRTO4 association status of each construct are listed on the right. Bottom: HEK 293T cells were transfected with MINAS-60 wild-type or mutants (listed at top), and immunoprecipitations (IP) were performed with anti-FLAG antibody followed by immunoblotting (IB) with the antibodies indicated on the right. Untransfected HEK 293T cells served as a control. Data are representative of three biological replicates. b, HEK 293T cells transfected with pcDNA 3.1 empty vector (Empty vector), wild-type (FL) or deletion mutants of MINAS-60 listed at top were treated with 1 μM puromycin for 1 hour at 37°C before harvesting and IB with anti-puromycin antibody. Coomassie staining served as a loading control. Data are representative of three biological replicates. c, ImageJ was used to quantify the relative puromycin incorporation for cells indicated at the bottom relative to empty vector from three biological replicates. Data represent mean values ± s.e.m., and significance was evaluated with one-way ANOVA (Dunnett’s test).
Extended Data Fig. 7 ∣
Extended Data Fig. 7 ∣. MINAS-60 does not regulate transcription of pre-rRNA, nor LSU pre-rRNA processing.
a, Quantitative RT-PCR with primers specific to the primary pre-rRNA (47S/45S/30S) of HEK 293T cells stably expressing empty pLKO.1 vector control (sh-ctrl), one of the two RBM10 shRNAs (sh-RBM10-1 (a, left), sh-RBM10-2 (a, right), rescue with MINAS-60 (Rescue_MINAS-60), or rescue with RBM10 (Rescue_RBM10). Error bars, standard error of the mean (s.e.m.), N = 4 biologically independent samples. b, Total RNA from HEK 293T cells stably expressing empty pLKO.1 vector control (lane 1, sh-ctrl), one of the two RBM10 shRNAs [sh-RBM10-1 (lane 2), sh-RBM10-2 (lane 5)], rescue with MINAS-60 [Rescue-1_MINAS-60 (rescue on sh-RBM10-1 background, lane 3), Rescue-2_MINAS-60 (rescue on sh-RBM10-2 background, lane 6)], or rescue with RBM10 [Rescue-1_RBM10 (rescue on sh-RBM10-1 background, lane 4), Rescue-2_RBM10 (rescue on sh-RBM10-2 background, lane 7)] were isolated with TRIzol, and pre-rRNAs were separated by gel electrophoresis, followed with northern blotting using radioactively labeled P4 probe (gray lines, diagram at right). Northern blotting with a probe against the 7SL RNA was used as a loading control. Illustrations of the pre-rRNAs detected by P4 are indicated to the right of their respective bands. Data are representative of three biological replicates. c, Total cellular RNA from the cell lines described above was isolated with TRIzol, and the ratio of 28S/18S was calculated using an Agilent 2100 Bioanalyzer. Error bars, standard error of the mean (s.e.m.), N = 3 biologically independent samples.
Extended Data Fig. 8 ∣
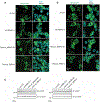
Extended Data Fig. 8 ∣. MINAS-60 downregulates LSU export.
a,b, Confocal live-cell imaging of control (sh-Ctrl), RBM10 knockdown with two independent shRNAs [sh-RBM10-1 (a), sh-RBM10-2 (b)], rescue with MINAS-60 (Rescue_MINAS-60) or rescue with RBM10 (Rescue_RBM10) HEK 293T cells stably expressing RPL29-GFP. Scale bar, 10 μm. Data are representative of three biological replicates. c, Western blot of the cell lines described above with antibodies indicated on the right for comparison of RPL29-GFP expression. Data are representative of three biological replicates.
Extended Data Fig. 9 ∣
Extended Data Fig. 9 ∣. MINAS-60 does not regulate 40S ribosomal subunit export.
a,d, Confocal live-cell imaging of control (sh-Ctrl), RBM10 knockdown with two independent shRNAs [sh-RBM10-1 (a) and sh-RBM10-2 (d)], rescue with MINAS-60 (Rescue_MINAS-60) or rescue with RBM10 (Rescue_RBM10) HEK 293T cells stably expressing RPS2-GFP. Scale bar, 10 μm. Data are representative of two biological replicates. b,e, Quantitation of the RPS2-GFP signals in the cell lines described above. At least 13 fields of view were analyzed, totaling > 350 cells for each measurement. Data represent mean values ± s.e.m., and significance was evaluated with one-way ANOVA (Dunnett’s test). c,f, Western blot of the cell lines described above with antibodies indicated on the right for comparison of RPS2-GFP expression. Data are representative of two biological replicates.
Extended Data Fig. 10 ∣
Extended Data Fig. 10 ∣. MINAS-60 downregulates cytoplasmic LSU export and pre-60S assembly.
a, Sucrose gradient sedimentation analysis of polysome fractions of cytoplasmic lysates from control (sh-Ctrl), RBM10 knockdown with a second shRNA (sh-RBM10-2), rescue with MINAS-60 (Rescue_MINAS-60) or rescue with RBM10 (Rescue_RBM10) HEK 293T cells. Data are representative of three biological replicates. b, Transient over-expression of MINAS-60 reduces 60S and 80S levels. Sucrose gradient sedimentation analysis of polysome fractions of cytoplasmic lysates from HEK 293T cells transfected with pcDNA 3.1 empty vector (Empty vector) or pcDNA 3.1-MINAS-60 (MINAS-60). Data are representative of three biological replicates. c, Quantitation of the ratio of cytoplasmic total 60S to total 40S subunits (c, left) or 80S to free 40S subunits (c, right) in “b”. The area under each peak was measured using ImageJ. Data represent mean values ± s.e.m., and significance was evaluated with two-tailed t-test. d, Schematic representation of pre-60S assembly factors associated with different pre-60S states. The bait protein BRIX1 is indicated in blue. LSU assembly factors exhibiting increased co-purification with BRIX1 in RBM10 KD cells are indicated in red. e, Volcano plot of quantitative proteomics (N = 5 biologically independent experiments) of BRIX1-FLAG pulldown from HEK 293T cells stably expressing BRIX1 and control shRNA (Ctrl), or BRIX1 and RBM10 shRNA (KD), to quantify changes in BRIX1 interactome in RBM10 KD over control HEK 293T cells. Increased association with ribosome assembly factors are indicated in red and gene names are labeled. For complete quantitative proteomics results, see Supplementary Data S11-12. f, BRIX1-FLAG-IP and western blotting with antibodies indicated on the right using the two cell lines described above. Cell lysates (4%) before IP (input) were used as the loading control. Data are representative of three biological replicates.
Fig. 1 ∣
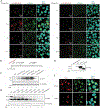
Fig. 1 ∣. BONCAT chemoproteomic profiling of nascent alt-proteins.
a, Schematic workflow. b,c, Top: Schematic representation of human DRAP1 transcript, PRR3 transcript variant (tv) 2, PRH1 tv1, or RBM10 tv1 (c); light gray arrow, 5' and 3' untranslated regions; red, alt-ORF; black, annotated protein CDS. Middle: Schematic representation of the expression construct containing complete 5'UTR and alt-ORF of the transcript indicated above, with a FLAG-HA appended to the C-terminus of the alt-protein. Bottom: HEK 293T cells transfected with the expression construct were immunostained with anti-HA (red), DAPI (cyan), and anti-fibrillarin (green, c). Scale bar, 10 μm. Data are representative of three biological replicates. d, HEK 293T cells transfected with the expression construct were lysed and immunoblotted (IB), with untransfected HEK 293T cells as a control. Data are representative of three biological replicates. e, f, HEK 293T cells transfected with the alt-CNPY2 expression construct were treated with increasing amounts of etoposide or vehicle for 2 h (left), or with 60 μM etoposide for different times or vehicle (right), followed by quantitative analysis (N = 3 biologically independent experiments) of the alt-CNPY2-FLAG-HA immunoblotting signal (e); or followed by quantitative RT-PCR with primers specific to CNPY2 tv1 (f). Data represent mean values ± s.e.m., N = 4 biologically independent samples.
Fig. 2 ∣
Fig. 2 ∣. MINAS-60 is endogenously expressed, cell-cycle regulated and conserved in mouse.
a, The cDNA sequence of human RBM10 tv1 is shown with the protein sequences of MINAS-60 and RBM10 indicated below. The start codons of RBM10 (391) and MINAS-60 (398, 554 and 560) are numbered above the cDNA sequence. The tryptic peptide of MINAS-60 detected by LC-MS/MS in this study is highlighted in red. b, Immunostaining of two MINAS-60 epitope tag knock-in (KI) HEK 293T cell lines with anti-HA (red), anti-fibrillarin (green), and DAPI (cyan). Scale bar, 10 μm. Data are representative of three biological replicates. c, Western blotting analysis of synchronized MINAS-60 KI cells released from the G1/S boundary at the indicated time points with antibodies indicated on the right. Data are representative of three biological replicates. d, RBM10 mRNAs from Mus musculus (NM_145627.3), Bos taurus (NM_001206693.1), and Macaca mulatta (XM_015127275.2) were obtained from NCBI nucleotide database, then translated in the +1, +2 and +3 frames using the Expasy translate tool. The full-length sequences of hypothetical MINAS-60 homologs were predicted in each transcript and aligned with ClustalW2. e, 3T3 cells transfected with mouse MINAS-60 (mMINAS-60) expression construct were immunostained with anti-HA (red), anti-fibrillarin (green), and DAPI (cyan). Scale bar, 10 μm. Data are representative of three biological replicates.
Fig. 3 ∣
Fig. 3 ∣. MINAS-60 associates with ribosomal large subunit (LSU) assembly factors to downregulate protein synthesis and cell proliferation.
a, Volcano plot of quantitative proteomics (N = 3 biologically independent experiments) of anti-FLAG pulldown from MINAS-60 KI (KI) or control (Ctrl) HEK 293T nuclear lysates. Ribosomal proteins are indicated in blue. Enriched LSU assembly factors are indicated in red and gene names are labeled. For complete quantitative proteomics results, see Supplementary Data S7-8. b, HEK 293T cells were transfected with MINAS-60-FLAG-HA (MINAS-60-FH, lanes 2 and 3) or vehicle (lane 1), and immunoprecipitation (FLAG-IP) was performed in the absence (lanes 1 and 2) or presence (lane 3) of RNaseA, followed by immunoblotting with antibodies indicated on the right. Cell lysates (4%) before IP (input, lanes 4-6) were used as loading controls. Data are representative of three biological replicates. c, Top: Sucrose-gradient sedimentation analysis of nuclear lysates containing ribosome precursor complexes from HEK 293T cells stably expressing MINAS-60-FLAG-HA. Bottom: Immunoblot analysis of fractions numbered at the top with antibodies indicated on the right. Data are representative of three biological replicates. d, ImageJ was used to quantify puromycin incorporation for cells indicated at the bottom relative to sh-Ctrl from three biological replicates. Data represent mean values ± s.e.m., one-way ANOVA (Dunnett’s test). e, Growth curve of control (sh-Ctrl), RBM10 knockdown (sh-RBM10-1), rescue with MINAS-60 (Rescue_MINAS-60) and rescue with RBM10 (Rescue_RBM10) HEK 293T cells at the indicated number of days (N = 3 biological independent experiments). Data represent mean values ± s.e.m., two-way ANOVA (Dunnett’s test).
Fig. 4 ∣
Fig. 4 ∣. MINAS-60 downregulates cytoplasmic LSU export.
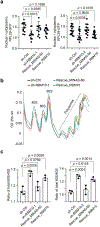
a, Quantitation of RPL29-GFP intensity in the nucleus vs. cytoplasm in control (sh-Ctrl), RBM10 knockdown with shRNA (sh-RBM10-1 (left), sh-RBM10-2 (right)), rescue with MINAS-60 (Rescue_MINAS-60), or rescue with RBM10 (Rescue_RBM10) HEK 293T cells stably expressing RPL29-GFP. At least 13 fields of view were analyzed, totaling > 350 cells for each measurement. Data represent mean values ± s.e.m., and significance was evaluated with one-way ANOVA (Dunnett’s test). b, Sucrose-gradient sedimentation analysis of ribosomal fractions (40S, 60S, 80S and polysomes) of cytoplasmic lysates from control (sh-Ctrl), RBM10 knockdown (sh-RBM10-1), rescue with MINAS-60 (Rescue_MINAS-60) or rescue with RBM10 (Rescue_RBM10) HEK 293T cells. Data are representative of three biological replicates. c, Quantitation of the ratio of cytoplasmic 60S to 40S subunits in the cell lines indicated below after sucrose gradient fractionation. The area under each peak was measured using ImageJ. Data represent mean values ± s.e.m., and significance was evaluated with one-way ANOVA (Dunnett’s test).
Fig. 5 ∣
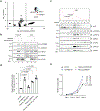
Fig. 5 ∣. RBM10 silencing promotes pre-60S assembly.
a, Schematic representation of pre-60S assembly factors associated with different pre-60S states. The bait protein MRTO4 is indicated in blue. LSU assembly factors exhibiting increased co-purification with MRTO4 in RBM10 KD cells are indicated in red. b, Volcano plot of quantitative proteomics (N = 4 biologically independent experiments) of MRTO4-FLAG pulldown from HEK 293T cells stably expressing MRTO4 and control shRNA (Ctrl), or MRTO4 and RBM10 shRNA (KD), to quantify changes in MRTO4 interactome in RBM10 KD over control HEK 293T cells. Increased association with ribosome assembly factors are indicated in red and gene names are labeled. For complete quantitative proteomics results, see Supplementary Data S9-10. c, MRTO4 FLAG-IP and western blotting with antibodies indicated on the right using the two cell lines described above. Cell lysates (4%) before IP (input) were used as the loading control. Data are representative of three biological replicates.
Fig. 6 ∣
Fig. 6 ∣. Model of MINAS-60 regulatory pathway.
MINAS-60 localizes to the nucleolus, where it may acts as a checkpoint inhibitor of late-stage pre-60S assembly, consequently slowing cytoplasmic LSU export, global protein synthesis and cell proliferation.

Comment in

  • Microproteins - lost in translation.
    Kruusvee V, Wenkel S. Kruusvee V, et al. Nat Chem Biol. 2022 Jun;18(6):581-582. doi: 10.1038/s41589-022-01007-5. Nat Chem Biol. 2022. PMID: 35393573 No abstract available.

References

    1. Orr MW, Mao Y, Storz G & Qian SB Alternative ORFs and small ORFs: shedding light on the dark proteome. Nucleic Acids Res 48, 1029–1042 (2020). - PMC - PubMed
    1. Brunet MA, Levesque SA, Hunting DJ, Cohen AA & Roucou X Recognition of the polycistronic nature of human genes is critical to understanding the genotype-phenotype relationship. Genome Res 28, 609–624 (2018). - PMC - PubMed
    1. Chen J et al. Pervasive functional translation of noncanonical human open reading frames. Science 367, 1140–1146 (2020). - PMC - PubMed
    1. Prensner JR et al. Noncanonical open reading frames encode functional proteins essential for cancer cell survival. Nat Biotechnol (2021). - PMC - PubMed
    1. Brunet MA et al. The FUS gene is dual-coding with both proteins contributing to FUS-mediated toxicity. EMBO Rep 22, e50640 (2021). - PMC - PubMed

Publication types

MeSH terms