. 2022 Apr;3(4):437-452.
doi: 10.1038/s43018-022-00352-7. Epub 2022 Apr 7.

Concurrent delivery of immune checkpoint blockade modulates T cell dynamics to enhance neoantigen vaccine-generated antitumor immunity

Affiliations

Concurrent delivery of immune checkpoint blockade modulates T cell dynamics to enhance neoantigen vaccine-generated antitumor immunity

Longchao Liu et al. Nat Cancer. 2022 Apr.

Abstract

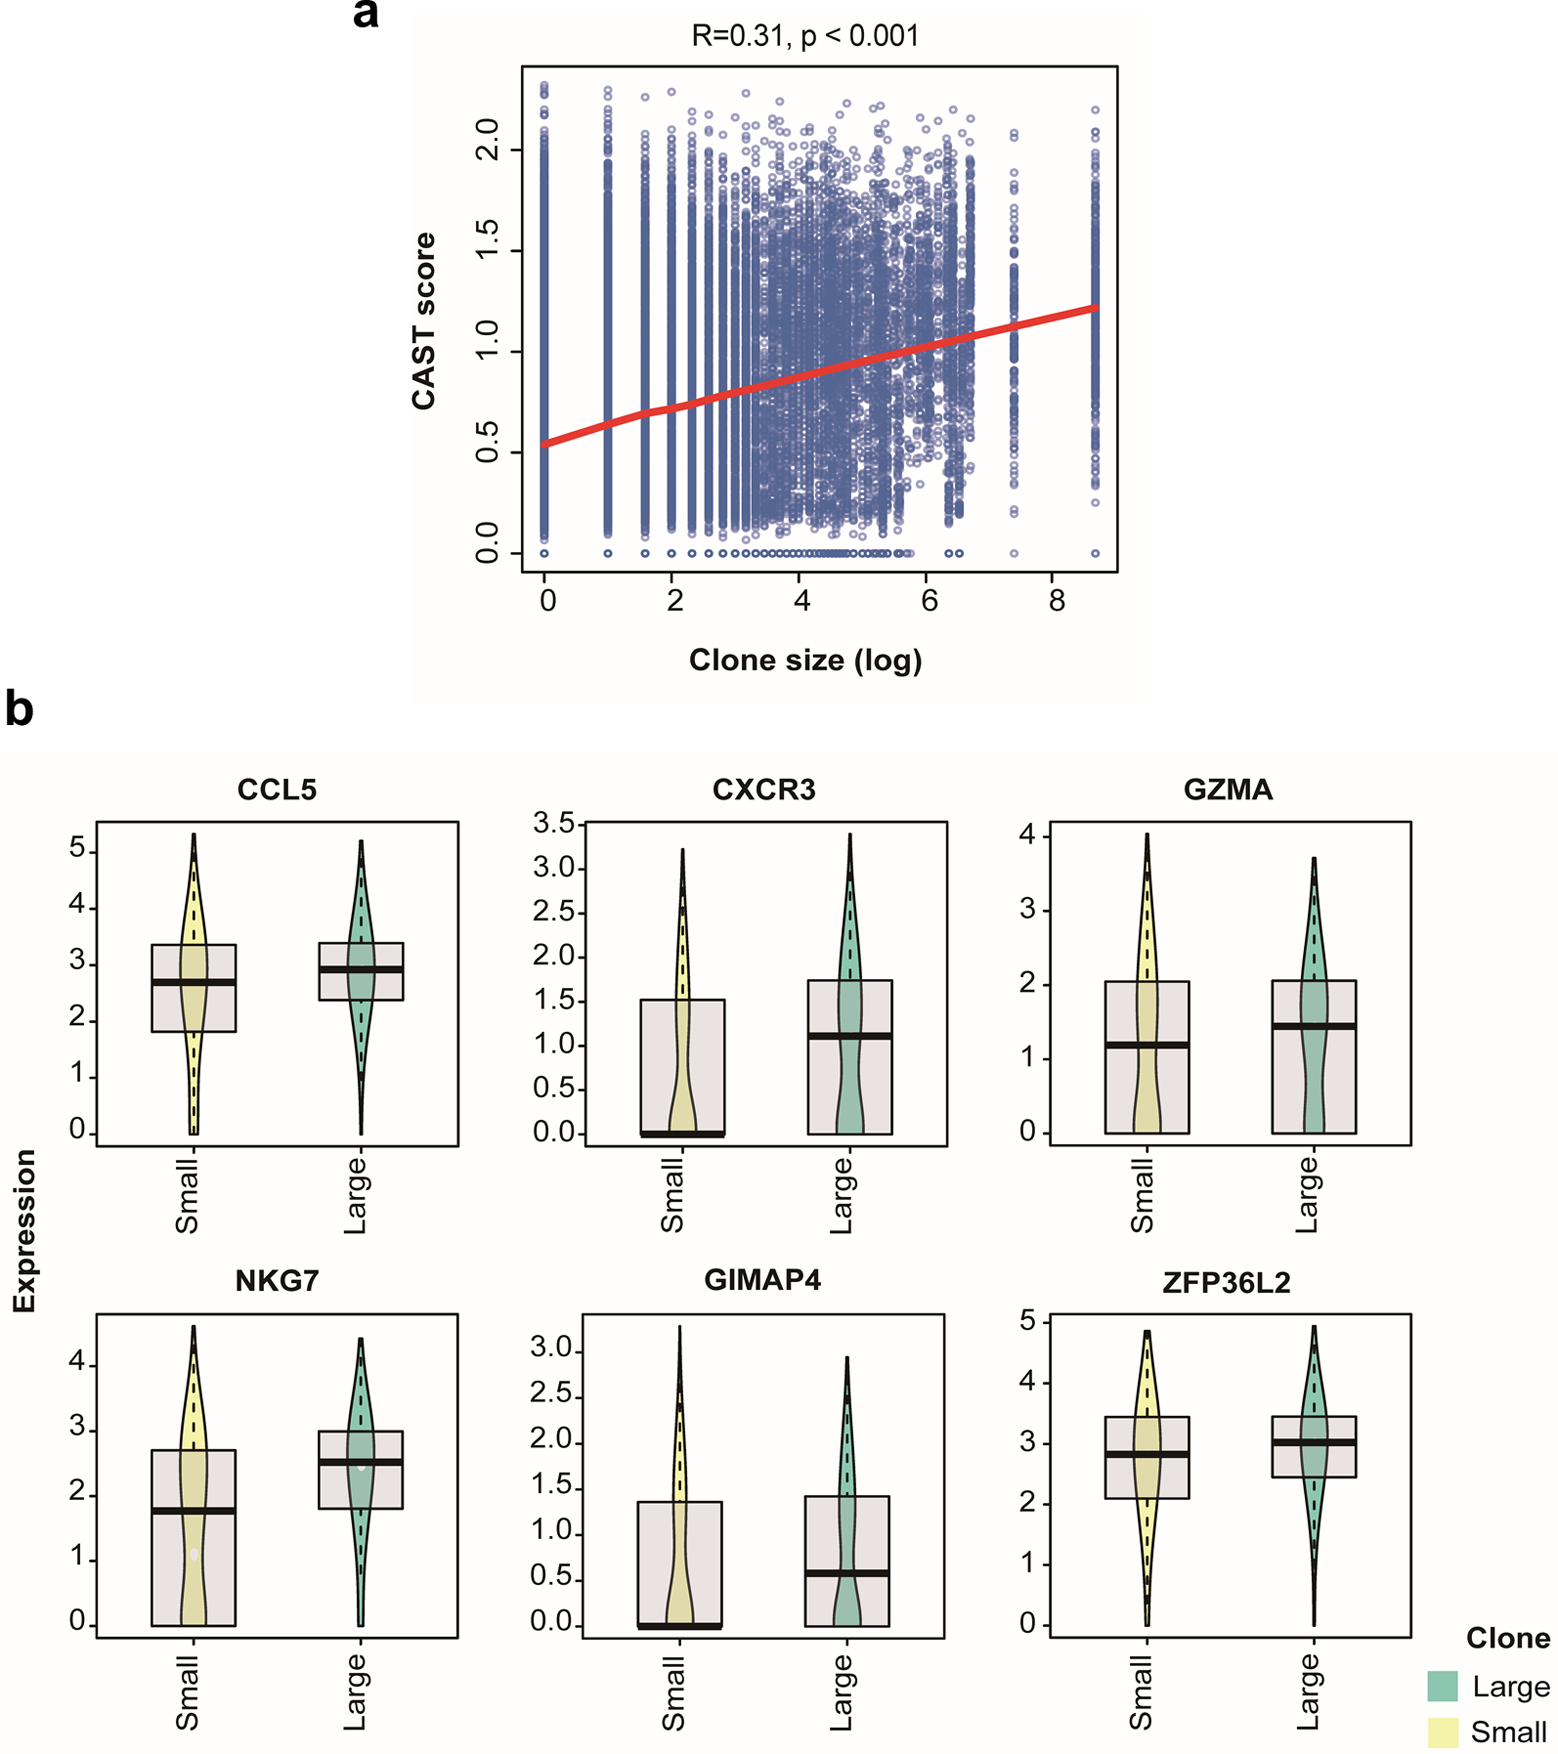
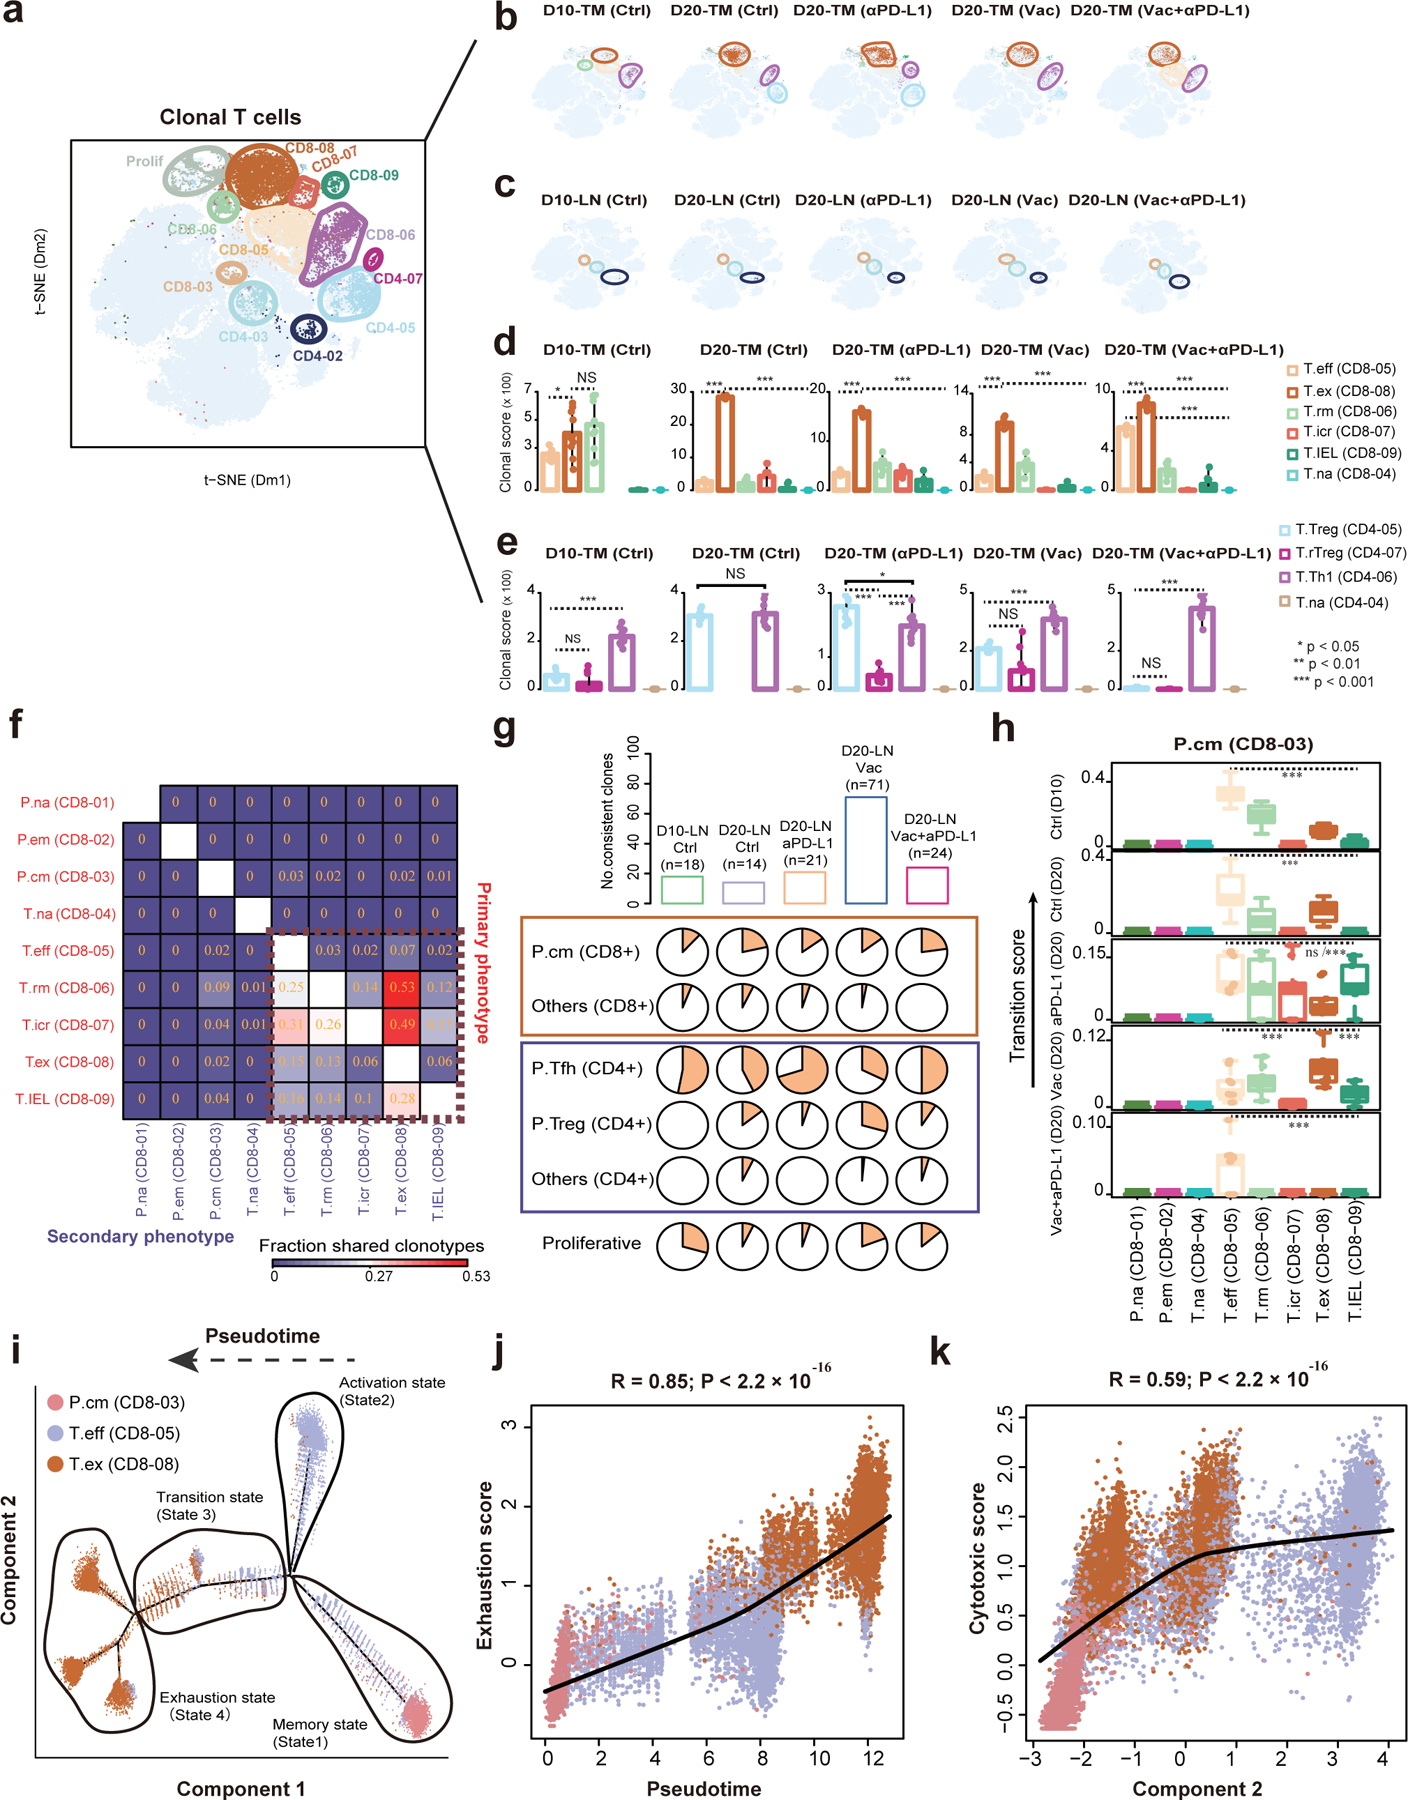
Neoantigen vaccines aiming to induce tumor-specific T cell responses have achieved promising antitumor effects in early clinical trials. However, the underlying mechanism regarding response or resistance to this treatment is unclear. Here we observe that neoantigen vaccine-generated T cells can synergize with the immune checkpoint blockade for effective tumor control. Specifically, we performed single-cell sequencing on over 100,000 T cells and uncovered that combined therapy induces an antigen-specific CD8 T cell population with active chemokine signaling (Cxcr3+/Ccl5+), lower co-inhibitory receptor expression (Lag3-/Havcr2-) and higher cytotoxicity (Fasl+/Gzma+). Furthermore, generation of neoantigen-specific T cells in the draining lymph node is required for combination treatment. Signature genes of this unique population are associated with T cell clonal frequency and better survival in humans. Our study profiles the dynamics of tumor-infiltrating T cells during neoantigen vaccine and immune checkpoint blockade treatments and high-dimensionally identifies neoantigen-reactive T cell signatures for future development of therapeutic strategies.


Conflict of interest statement

Competing interests

The authors declare no competing interests.

Figures

Extended Data Fig. 1
Extended Data Fig. 1. Neoantigen vaccine combined with ICB to induce a durable antitumor immune response
a, Gating strategy for accessing neoantigen specific T cell phenotype. b, MC38 bearing female C57BL/6J mice were treated with two doses of neoantigen vaccine on day 10 and 17 post tumor inoculation. The percentage of PD1+TIM3+tetramer+ CD8 T cells in the draining lymph node and tumor was detected by flow cytometry. c, MC38 bearing female C57BL/6J mice were treated with either anti-PD-L1, adjuvant alone (Adj), the combination of adjuvant and anti-PD-L1 or neoantigen vaccine plus anti-PD-L1. Tumor volume was monitored every 3 days, P=0.0194 (Adj+αPD-L1 vs Vaccine+αPD-L1). d, MC38 bearing female C57BL/6J mice were treated with neoantigen vaccine on day 12 post tumor inoculation. One dose of anti-PD-L1 (200 μg) was given before (day 10) or after (day 15) vaccination. The combination with two doses of anti-PD-L1 (200 μg, day 10 and 15) were used for comparison. Data were shown as mean ± s.e.m. (n=8 (b), n=5 (c) and n=6 (d) mice) from two independent experiments. Statistical analysis was performed by two-way ANOVA with Tukey’s multiple comparisons test (c,d), two-tailed unpaired Student’s t-test (b), *P ≤ 0.05, ****P ≤ 0.0001.
Extended Data Fig. 2
Extended Data Fig. 2. Study design and the distribution of T cell clusters
a, Gating strategy of single T cell sorting for single-cell sequencing. b, t-SNE plots showing the distribution of CD8+ and CD4+ T cells for each scRNA-seq library.
Extended Data Fig. 3
Extended Data Fig. 3. Expression levels of signature genes in each T cell cluster
a, Heatmap showing the mean expression of discriminative genes for each cluster of conventional CD4+ T cells (n=29,305 cells). b, Heatmap showing the mean expression of discriminative genes for each cluster of CD8+ T cells (n= 43,453 cells). c, Heatmap showing the mean expression of discriminative genes for each cluster of regulatory T cells (n= 8,058 cells). d, t-SNE plot of expression levels of selected genes in different clusters indicated by the colored oval corresponding to Fig. 2a. e, Bar plots showing the distribution of T cell clusters for each sample (n=93,399 cells).
Extended Data Fig. 4
Extended Data Fig. 4. Single-cell analyses of the dynamic changes of TILs in response to distinct immunotherapies
Bar plots displaying the dynamics of several major CD8+ T cell clusters (upper panel) and CD4+ T cell clusters (lower panel) in response to different immunotherapies (T.na (n=2,238 cells); T.eff (n=6,191 cells); T.ex (n=7,050 cells); T.na (n=2,046 cells); T.Th1 (n=4,798 cells); T.Treg (n=4,122 cells) ). P values were determined by a chi-square test on counts of T cells, exact p values were provided in Source Data Extended Data Fig. 4.
Extended Data Fig. 5
Extended Data Fig. 5. The dynamic change of major tumor-infiltrated T cell populations in response to distinct immunotherapies
a, Gating strategies for accessing the major tumor-infiltrated T cell populations by flow cytometry. b, MC38 bearing female C57BL/6J mice were treated with either neoantigen vaccine, anti-PD-L1 or the combination. The percentage of CCR7+ cells in tumor infiltrated CD4 and CD8 T cells were detected by flow cytometry as indicated time points. Data were shown as mean ± s.e.m. (n=5 mice) from two independent experiments. Statistical analysis was performed by two-way ANOVA with Šídák's multiple comparisons test (b), ****P ≤ 0.0001.
Extended Data Fig. 6
Extended Data Fig. 6. Lineage tracking of clonal CD8 T cell subsets associated with immunotherapies
a, Boxplots showing the clonal score of exhausted T cells (CD8–08), effector T cells (CD8–05), Tregs (CD4–04) and Th1-like T cells (CD4–06) in different treatment groups. b, Boxplot showing the pairwise transition score between CD8–05 and other intra-tumor CD8+ clusters across all tumor samples. Different T cell clusters were randomly downsampled (50%) 10 times for statistical test (n=10 permutations (a,b)). Center line indicates the median value, lower and upper hinges represent the 25th and 75th percentiles, respectively, and whiskers denote 1.5× interquartile range. c, The trajectory of three CD8+ T cell clusters showing the inferred pseudotime along the tree-like structure. d, The trajectory of three CD8+ T cell clusters showing by consistent clones. e, The monocle component 1 correlates with the stemness score of CD8+ T cells. f, The distribution of CD8+ T cells in different transcriptional states identified by monocle across all groups. Two sided Wilcoxon rank-sum test were used for multiple groups comparisons, exact p values were provided in Source Data Extended data Fig. 6 (a,b). Two-sided Pearson’s correlation coefficient test was used to determine the p value, P < 2.2 × 10⁻¹⁶ (e).
Extended Data Fig. 7
Extended Data Fig. 7. Lineage tracking of clonal CD4 T cell subsets associated with immunotherapies
a, Monocle-guided cell trajectory showing the state transition between two major conventional CD4+ T cell clusters (CD4–03, CD4–06). b, Violin plots showing the expression level of Lag3, Havcr2, Ctla4 and Tgfb1 on the CD4+ T cells in transcriptional state 2–3. c, The distribution of CD4 T cells in the monocle-identified transcriptional states among different groups. d, Monocle-guided cell trajectory of three regulatory T cell (Treg) clusters (CD4–02, CD4–05 and CD4–07). 4 transcriptional states were identified along the inferred trajectory. e, Violin plots showing the expression level of S1pr1, Klf2, Il10 and Glrx in the two terminal transcriptional states (2 and 4). f, The distribution of Treg cells in the monocle-identified transcriptional states among different groups. g, Heat map showing the fraction of clonotypes belonging to a primary phenotype cluster (rows) that are shared with other secondary phenotype clusters (columns). h, The fraction of clonal cells in each functional state of Treg trajectory. The two sided Wilcoxon rank-sum test were used to calculate the p value following the adjustment of the Benjamini-Hochberg method to get the fdr q value, n=6,126 cells (a-c) and n=4,415 cells (d-f). ***represents fdr q value < 0.001 (b,e).
Extended Data Fig. 8
Extended Data Fig. 8. The landscape of neoantigen Adpgk-specific CD8+ T cells
Female C57BL/6J mice were subcutaneously injected with neoantigen vaccine, the percentage of Adpgk-specific T cell (tetramer+) in the draining lymph node was detected by flow cytometry. Representative data of 6 independent mice was shown.
Extended Data Fig. 9
Extended Data Fig. 9. Neoantigen vaccine and ICB coordinately mediated the anti-tumor immune response depending on T cells from draining lymph node
a-c, female C57BL/6J mice were subcutaneously inoculated with 1×10⁶ MC38 tumor cells and treated with either neoantigen vaccine, anti-PD-L1 or the combination. Gating strategies for accessing the phenotype of tumor infiltrated CD8 T cells by flow cytometry (a). The percentage of neoantigen-specific T cell in the tumor tissue was detected by flow cytometry. The representative result for Fig. 5b (n=4 independent mice) was shown in (b). The percentage of IFNγ-producing CD8 T cells were detected by Elispot assay (n=5 mice) (c). d-e, C57BL/6J mice were subcutaneously injected with neoantigen vaccine. Lymphocytes from draining lymph node were harvested at day 6 post vaccination and adoptively transferred to MC38 bearing Rag1−/− mice. Two doses of anti-PD-L1 were given to the recipient mice on day 2 and 5 post adoptive transfer. The percentage of tetramer+ cells in the donor draining lymph node was detected by flow cytometry (d). The representative IFNγ+ spots for Fig. 5k were shown (e). Data were shown as mean ± s.e.m. from two independent experiments. Statistical analysis was performed by one-way ANOVA (c), ****P ≤ 0.0001.
Extended Data Fig. 10
Extended Data Fig. 10. The discriminative markers of neoantigen specific T cells are associated with better clinical outcome in human tumors
a, The correlation between CAST score and clone size of CD8+ T cells in BCC patients. The solid red line represents LOESS fitting result (n=26,846 cells). b, Boxplots comparing the expression of discriminative marker for CD8–05 in BCC patients’ CD8 T cells with large (n=1,271) or small (n=1,446) clone. Center line indicates the median value, lower and upper hinges represent the 25th and 75th percentiles, respectively, and whiskers denote 1.5× interquartile range. Two-sided Spearman’s correlation coefficient test was used to determine the p value, P < 2.2 × 10⁻¹⁶ (a).
Fig. 1 |
Fig. 1 |. Neoantigen vaccine combined with ICB remodeled TILs to induce a durable immune response.
a, MC38 bearing female C57BL/6J mice were subcutaneously injected with two doses of neoantigen vaccine (10 mcg 9-mer peptide formulated with 50 μg Poly I:C and 50 μg CpG1826) on day 10 and 17 post tumor inoculation. Tumor volume was measured twice per week (n = 4 mice; P < 0.0001). b, WT or MC38 bearing female C57BL/6J mice were treated with neoantigen vaccine subcutaneously (n = 8 mice). The percentage of tetramer+ cells in the draining lymph node and non-draining lymph node was detected by flow cytometry. c,d, MC38 bearing female C57BL/6J mice were treated with neoantigen vaccine subcutaneously. The percentage of tetramer+ cell in the tumor (c) and Tox+ cells in tetramer+ cells (d) were detected by flow cytometry (n = 8 mice). e, Boxplot showing the PD-L1 expression on different myeloid cell populations in lymph node and tumor tissue of MC38 bearing mice. Center line indicates the median value, lower and upper hinges represent the 25th and 75th percentiles, respectively, and whiskers denote 1.5× interquartile range. Each dot corresponds to one cell. f-h, female C57BL/6J mice were subcutaneously inoculated with 1×10⁶ MC38 tumor cells and treated with either neoantigen vaccine, anti-PD-L1 or the combination (n = 5 mice). Tumor volume was measured every three days. Experimental design (f), Tumor growth curve (g), percentage of survival (h) were shown. (i) The experimental flowchart of single-cell RNA sequencing data generation. Data were shown as mean ± s.e.m. from two independent experiments. Statistical analysis was performed by two-way ANOVA with Šídák’s multiple comparisons test (a,b) or Tukey’s multiple comparisons test (g), two-tailed unpaired Student’s t-test (c-d) and Log-rank test (h), ****P ≤ 0.0001.
Fig. 2 |
Fig. 2 |. The dynamics of TILs in response to distinct immunotherapies.
a, t-distributed stochastic neighbor embedding (t-SNE) plot showing Seurat-guided unsupervised clustering and distribution of 93,399 T cells from the spleen, lymph node or tumor tissue of MC38 bearing mice (n = 40 mice). Each dot denotes an individual T cell; color denotes cluster origin. There are 23 main clusters, including 9 CD8+ clusters, 7 CD4+ clusters, 4 CD8CD4 TCRαβ+ double negative (DN) clusters and 3 mixed clusters. We selected one representative signature gene to name each cluster and indicate the potential function (bottom). b, Heat map displaying normalized expression values of discriminative gene sets for CD4 conventional T cells, Tregs and CD8 T cells in the lymphoid (spleen and lymph node) and tumor tissue. c, Heatmap showing the mean expression of representative T cell function-associated genes in each CD4+ and CD8+ cluster. d, Sample preference of each cluster estimated by Ro/e index (Methods). +++ (Ro/e ≥3, P<0.05) represents highly enriched; ++ (2≤ Ro/e <3, P<0.05) represents enriched; + (1.2≤ Ro/e <2, P<0.05) represents slightly enriched; +/− (0.8≤ Ro/e <1.2 or P>0.05) represents non-significant; - (0<Ro/e<0.8, P<0.05) represents deletion. (e-j) MC38 bearing female C57BL/6J mice were treated with either neoantigen vaccine, anti-PD-L1 or the combination. The percentage of TIL subsets were determined by flow cytometry as indicated time points. The percentage of CD62LhiCD44lo CD8 T cells in different treatment groups (e). The percentage of TIM-3+ PD-1+ CD8 T cells in different treatment groups (f). The percentage of TOX+ CD8 T cells in different treatment groups (g). The percentage of CD62LhiCD44lo CD4 T cells in different treatment groups (h). The percentage of Foxp3+ Tregs in different treatment groups (i). The percentage of RANKL+ Th1-like CD4 T cells in different treatment groups (j). Data were shown as mean ± s.e.m. (n=5 (e-f, h-j), n=6 (g) mice) from two independent experiments. Statistical analysis was performed by one-way ANOVA with Tukey’s multiple comparisons test (e-j), ****P ≤ 0.0001.
Fig. 3 |
Fig. 3 |. Lineage tracking of clonal T cell subsets associated with immunotherapies.
a, The clonal T cells (n=12,053 cells from n=40 mice) were highlighted in the t-SNE plot. Color represents cluster origin. b, Distribution of clonal T cell in the tumor sample of each treatment. The enriched clusters are indicated by colored oval. c, The distribution of clonal T cells in matched lymph nodes of samples in panel (b). d, Clonal expansion levels of 6 tumoral CD8+ T cell clusters quantified by clonal score for each tumor sample. e, Clonal expansion levels of 4 tumoral CD4+ T cell clusters quantified by clonal score for each tumor sample. f, Heat map showing the fraction of T cells with clonotypes belonging to a primary phenotype cluster (rows) that are shared with other secondary phenotype clusters (columns). g, The upper bar plots showing the number of consistent clones in lymph node of each group. The lower pie charts displaying the distribution of these consistent clones in different T cell clusters. h, Boxplots showing the migration potentials of CD8–03-Gpr183-Tcm to other CD8+ T cell clusters. Migration score between two specific clusters is calculated based on the migration level of each member. Center line indicates the median value, lower and upper hinges represent the 25th and 75th percentiles, respectively, and whiskers denote 1.5× interquartile range. Different T cell clusters were randomly downsampled (50%) 10 times for statistical test. Two-sided Wilcoxon rank-sum test were used for multiple groups comparisons (n=10 permutations, ***P ≤ 0.001, exact p values are provided in Source Data Fig. 3 (d-e, h)). i, Monocle-guided cell trajectory of three major CD8+ T cell clusters with high migration relationship. The direction of the inferred pseudotime is indicated by the arrow. The different functional states identified by monocle were ordered along the artificial pseudotime. j, The inferred pseudotime is correlated with the exhaustion feature of CD8+ T cells. The solid line represents the LOESS fitting of the relationship between the pseudotime and exhaustion scores. Dots were colored by their cluster origin. k, The monocle component 2 is correlated with the cytotoxic score of CD8+ T cells. The cytotoxic score was calculated similar to exhaustion score (Methods). P values were calculated by using the two-sided Pearson’s correlation coefficient test (j-k).
Fig. 4 |
Fig. 4 |. Identification of neoantigen specific T cell landscape in response to combination treatment.
Tetramer+ T cells were sorted from the spleen and lymph node of neoantigen-Adpgk vaccinated mice, and their CDR3 sequences were clustered using iSMART, revealing 1415 unique iSMART clusters. a, TCR clusters were then compared to clusters from T cells in unvaccinated mouse lymphoid tissues, and the top 20 clusters enriched in neoantigen-Adpgk vaccinated mice are displayed in (a) (n=1802 CDR3 sequences). b, Bar graphics showing the enrichment analysis of tetramer+ neoantigen-specific T cells, which is defined as the T cells with TCRs enriched in any of the iSMART groups in (a). The x-axis represents the ratio of observed cell number over the expected cell number (Ro/e) obtained from two-sided chi-square test, exact p value=3.7×10⁻³⁰ (b). c, t-SNE plot showing the projection of tetramer+ CD8+ T cells which express the TCRs in the twenty significant iSMART groups (n=461 cells). d, Odds ratio heatmap of twenty tetramer+ TCR groups in six TIL-enriched CD8+ T cell clusters. Statistical significance was evaluated with Chi-square test and FDR correction was performed with Benjamin-Hochberg method on multiple TCR groups. e, Volcano plot showing differentially expressed genes between T cells of CD8–05-T.eff and other CD8+ tumor-infiltrating T cells (n= 6,191 cells in cluster CD8–05). f, Violin plots showing the expression levels of Ccl5, Cxcr3, Fasl, Lag3 and Havcr2 across the tumoral CD8+ T cell clusters. g, Differential pathways enriched for the discriminative markers of CD8–05 T cell subset (n= 6,191 cells) by GSEA.
Fig. 5 |
Fig. 5 |. Neoantigen vaccine and ICB coordinately mediated the anti-tumor immune response depending on T cells from draining lymph node.
a-d, female C57BL/6J mice were subcutaneously inoculated with 1×10⁶ MC38 tumor cells and treated with either neoantigen vaccine, anti-PD-L1 or the combination. Experimental design (a), the percentage of tetramer+ CD8 T cells (b), LAG3+ CD8 T cells (c) and CXCR3+ CD8 T cells (d) in the spleen or tumor tissue of different treatments groups was detected by flow cytometry. e-h, female C57BL/6J mice were subcutaneously inoculated with 1×10⁶ MC38 tumor cells and treated with the combination of neoantigen vaccine and anti-PD-L1. 20 μg FTY720 was administrated one day before treatment initiation and then 10 μg every other day for 2 weeks. Experimental design (e), tumor growth curve (f), the percentage of IFNγ producing cell in the tumor tissue was determined by Elispot (g), the percentage of neoantigen-specific CD8+ T cells in the tumor tissue was detected by tetramer staining (h). i-l, female C57BL/6J mice were subcutaneously injected with neoantigen vaccine. Lymphocytes from draining lymph node were harvested at day 6 post vaccination and adoptively transferred to MC38 bearing Rag1−/− mice. Two doses of anti-PD-L1 were given to the recipient mice on day 2 and 5 post adoptive transfer. Schematic of experiment design (i), tumor growth curve (j), the percentage of IFNγ producing cell in the spleen was determined by Elispot (k), the percentage of neoantigen-specific CD8+ T cells in the tumor tissue was detected by tetramer staining (l). m-o, female C57BL/6J mice were subcutaneously inoculated with 1×10⁶ MC38 tumor cells and treated with the combination of neoantigen vaccine and anti-PD-L1. Experimental design (m), representative result of MuLV p15E specific tetramer staining (n), percentage of MuLV p15E specific tetramer+ CD8 T cells (n = 5 mice) (o). Data were shown as mean ± s.e.m. from two independent experiments (n=4 (b, f), n=5 (c-d, h, j, l), n=6 (k) and n=8 (g) mice). Statistical analysis was performed by two-way ANOVA (b, f, j), one-way ANOVA (c-d, g-h, k-l) with Tukey’s multiple comparisons test and two-tailed unpaired Student’s t-test (o), ****P ≤ 0.0001.
Fig. 6 |
Fig. 6 |. The discriminative marker of antigen specific T cells are associated with better survival in human tumors.
a, Receiver operating characteristic (ROC) plots showing the performance in prediction of CD8–05 effector T cells. b, Influence of the CAST score on the overall survival of major human cancers. HR below 1 (horizonal solid line) indicates that patients with higher CAST score exhibit improved survival. The error bar represents the calculated 95% confidence interval (95%CI). For each cancer type, the patients were divided into High CD8 TIL and Low CD8 TIL subgroups. Brain lower grade glioma (LGG, n = 457 patients), bladder urothelial carcinoma (BLCA, n=337 patients), breast invasive carcinoma (BRCA, n=1065 patients), colon adenocarcinoma (COAD, n=450 patients), esophageal carcinoma (ESCA, n=172 patients), glioblastoma multiforme (GBM, n=159 patients), kidney renal clear cell carcinoma (KIRC, n=525 patients), kidney renal papillary cell carcinoma (KIRP, n=254 patients), liver hepatocellular carcinoma (LIHC, n=354 patients), lung adenocarcinoma (LUAD, n=478 patients), lung squamous cell carcinoma (LUSC, n=478 patients), ovarian serous cystadenocarcinoma (OV, n=260 patients), pheochromocytoma and paraganglioma (PCPG, n=178 patients), prostate adenocarcinoma (PRAD, n=421 patients), sarcoma (SARC, n=244 patients), stomach adenocarcinoma (STAD, n=388 patients), thyroid carcinoma (THCA, n=499 patients), uterine corpus endometrial carcinoma (UCEC, n=369 patients), testicular germ cell tumors (TGCT, n=119 patients). c-f, Kaplan-Meier survival curves of patients with high CD8 TIL from skin cutaneous melanoma (SKCM, n = 428 patients) (c), head and neck squamous cell carcinoma (HNSC, n = 497 patients) (d), cervical squamous cell carcinoma and endocervical adenocarcinoma (CESC, n = 282 patients) (e) and pancreatic adenocarcinoma (PAAD, n = 163 patients) (f) with respect to high or low CAST score within tumor specimens. g-j, Kaplan-Meier survival curves of patients with low CD8 TIL from SKCM (g), HNSC (h), CESC (i) and PAAD (j). k, The violin plots showing the CAST scores across CD8+ T cell groups with different clone frequency in advanced basal cell carcinoma (BCC) samples. l, t-SNE plot showing CD8+ cells that are color-coded according to whether they belong to large or small clones. m, Three of four BCC patients showed higher CAST scores of CD8+ T cells in post-αPD-1 samples when comparing to pre-treatment counterparts (one-sided Wilcoxon rank-sum test, su005 (p=8.4×10⁻¹⁶), su008 (p=0.00019), su009 (p=5.4×10⁻¹¹)). Survival distributions were compared using the log-rank test (c-j). Two-sided Spearman’s correlation coefficient test was used with the exact p value=5.0×10−231 (k).

Comment in

  • The dynamics of an immunotherapy duo.
    Shavkunov AS, Gubin MM. Shavkunov AS, et al. Nat Cancer. 2022 Apr;3(4):376-378. doi: 10.1038/s43018-022-00362-5. Nat Cancer. 2022. PMID: 35484417 No abstract available.

References

    1. Chen DS & Mellman I Oncology meets immunology: the cancer-immunity cycle. Immunity 39, 1–10 (2013). - PubMed
    1. Sharma P & Allison JP The future of immune checkpoint therapy. Science 348, 56–61 (2015). - PubMed
    1. Waldman AD, Fritz JM & Lenardo MJ A guide to cancer immunotherapy: from T cell basic science to clinical practice. Nat Rev Immunol (2020). - PMC - PubMed
    1. Reinherz EL alphabeta TCR-mediated recognition: relevance to tumor-antigen discovery and cancer immunotherapy. Cancer Immunol Res 3, 305–312 (2015). - PMC - PubMed
    1. Zamora AE, Crawford JC & Thomas PG Hitting the Target: How T Cells Detect and Eliminate Tumors. J Immunol 200, 392–399 (2018). - PMC - PubMed

Publication types