. 2022 Jul;43(10):3221-3244.
doi: 10.1002/hbm.25847. Epub 2022 Apr 8.

Age-related change in task-evoked amygdala-prefrontal circuitry: A multiverse approach with an accelerated longitudinal cohort aged 4-22 years

Affiliations

Age-related change in task-evoked amygdala-prefrontal circuitry: A multiverse approach with an accelerated longitudinal cohort aged 4-22 years

Paul Alexander Bloom et al. Hum Brain Mapp. 2022 Jul.

Abstract

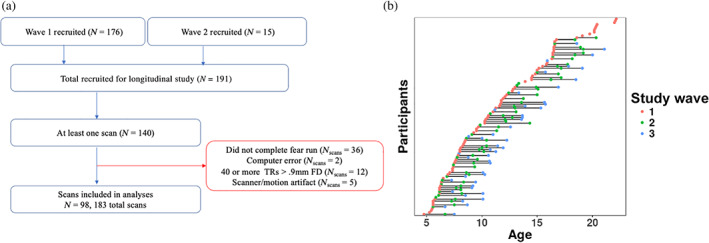
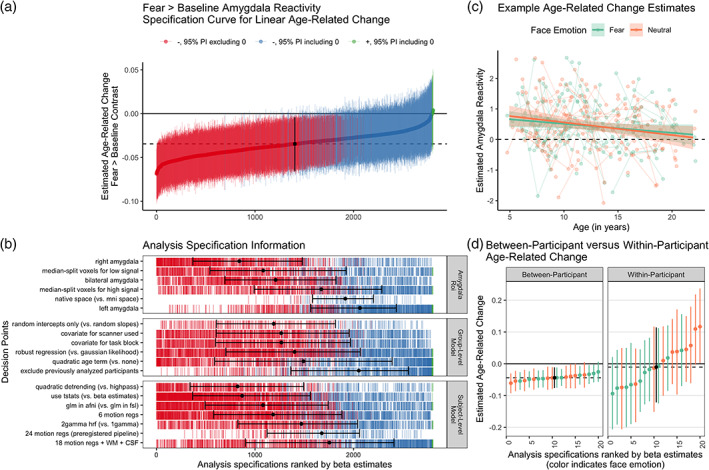
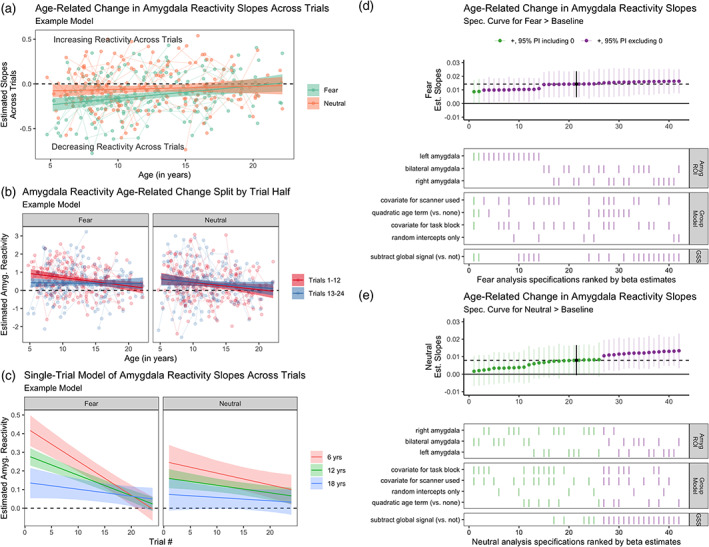
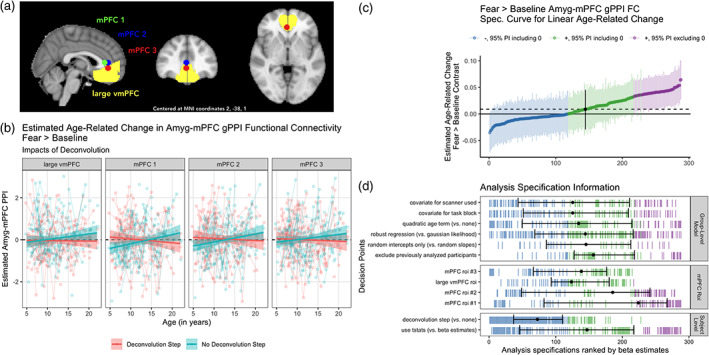
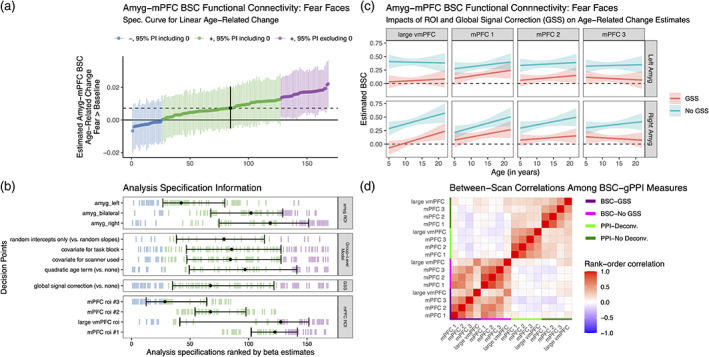
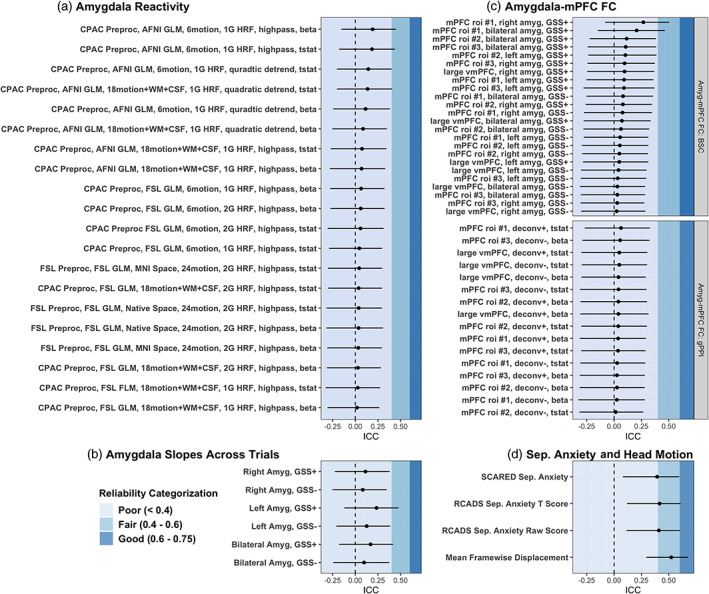
The amygdala and its connections with medial prefrontal cortex (mPFC) play central roles in the development of emotional processes. While several studies have suggested that this circuitry exhibits functional changes across the first two decades of life, findings have been mixed - perhaps resulting from differences in analytic choices across studies. Here we used multiverse analyses to examine the robustness of task-based amygdala-mPFC function findings to analytic choices within the context of an accelerated longitudinal design (4-22 years-old; N = 98; 183 scans; 1-3 scans/participant). Participants recruited from the greater Los Angeles area completed an event-related emotional face (fear, neutral) task. Parallel analyses varying in preprocessing and modeling choices found that age-related change estimates for amygdala reactivity were more robust than task-evoked amygdala-mPFC functional connectivity to varied analytical choices. Specification curves indicated evidence for age-related decreases in amygdala reactivity to faces, though within-participant changes in amygdala reactivity could not be differentiated from between-participant differences. In contrast, amygdala-mPFC functional connectivity results varied across methods much more, and evidence for age-related change in amygdala-mPFC connectivity was not consistent. Generalized psychophysiological interaction (gPPI) measurements of connectivity were especially sensitive to whether a deconvolution step was applied. Our findings demonstrate the importance of assessing the robustness of findings to analysis choices, although the age-related changes in our current work cannot be overinterpreted given low test-retest reliability. Together, these findings highlight both the challenges in estimating developmental change in longitudinal cohorts and the value of multiverse approaches in developmental neuroimaging for assessing robustness of results.

Keywords: amygdala; development; longitudinal; multiverse; prefrontal cortex; robustness.


Conflict of interest statement

The authors declare no potential conflict of interest.

Figures

FIGURE 1
FIGURE 1
(a) Schematic showing study inclusion criteria. (b) Included scans at each study wave, with each dot representing one scan, and horizontal lines connecting participants across study waves
FIGURE 2
FIGURE 2
Multiverse analyses of age‐related change in amygdala reactivity. (a). Specification curve of age‐related change in fear > baseline amygdala reactivity. Points represent estimated linear age‐related change and lines are corresponding 95% posterior intervals (PIs). Models are ordered by age‐related change estimates, with the dotted line representing the median estimate across all specifications. Color indicates sign of beta estimates and whether respective posterior intervals include 0 (red = negative excluding 0; blue = negative including 0, green = positive including 0, black = median across all specifications). (b). Model specification information corresponding to each model in A. Variables on the y‐axis represent analysis choices, corresponding color‐coded marks indicate that a choice was made, and blank space indicates that the choice was not made in a given analysis. Within each category panel (amygdala ROI, Group‐Level Model, and Participant‐Level Model), decision points are ordered from top to bottom by the median model rank when the corresponding choice is made (i.e., choices at the top of each panel tend to have more negative age‐related change estimates). Black points with error bars represent the median and IQR ranks of specifications making the choice indicated on the corresponding line. (c). Example participant‐level data and model predictions for age‐related related change in amygdala reactivity for both the fear > baseline (green) and neutral‐baseline (orange) contrasts. Data are shown for a preregistered pipeline using a native space bilateral amygdala mask, 24 motion regressors, t‐statistics, high‐pass filtering, and participant‐level GLMs in FSL. Points represent participant‐level estimates, light lines connect estimates from participants with multiple study visits, and dark lines with shaded area represent model predictions and 95% posterior intervals. (d). Specification curves for a subset of models separately parametrizing within‐participant (right) vs. between‐participant (left) age‐related change for both the fear > baseline (green) and neutral > baseline (orange) contrasts, as well as the median across specifications (black). See https://pbloom.shinyapps.io/amygdala_mpfc_multiverse/ for interactive visualizations
FIGURE 3
FIGURE 3
Age‐related change in amygdala reactivity across trials. (a). An example model of estimated age‐related change in slopes of beta estimates across both fear (green) and neutral (orange) trials. Negative slopes represent higher amygdala activity in earlier trials relative to later trials. (b). Example models of estimated age‐related change in amygdala reactivity for the fear > baseline (left) and neutral > baseline (right) contrasts for both the first (red) and second (blue) halves of trials. In both a and b, points represent participant‐level estimates, light lines connect estimates from participants with multiple study visits, and dark lines with shaded area represent model predictions and 95% posterior intervals. (c). Example single‐trial model predictions of estimated amygdala reactivity for fear (left) and neutral (right) faces as a function of age and trial number. Age was modeled as a continuous variable, and average predictions for participants of age 6 (red), 12 (green), and 18 (blue) years are shown for visualization purposes. All estimates in a–c shown are from an example analysis pipeline using bilateral amygdala estimates and without global signal correction. (d). Specification curve for age‐related change in slopes across fear trials (i.e., many parallel analyses for the fear trials in subplot b). (e). Specification curve for age‐related change in slopes across neutral trials (i.e., neutral trials in plot b). GSS = global signal correction using post hoc mean centering. For both d and e, color indicates sign of beta estimates and whether respective posterior intervals include 0 (green = positive including 0, purple = positive excluding 0, and black = median across all specifications), and horizontal dotted lines represent median estimates across all analysis decisions. Variables on the y‐axis represent analysis choices, corresponding color‐coded marks indicate that a choice was made, and blank space indicates that the choice was not made in a given analysis
FIGURE 4
FIGURE 4
Multiverse analyses of age‐related change in amygdala—mPFC connectivity using gPPI methods. (a). MNI space mPFC ROIs used in connectivity analyses. (b). Example participant‐level data and model predictions for age‐related related change in amygdala—mPFC gPPI for analysis pipelines with a deconvolution step (red), or without (blue) for each of the four regions shown in a. Although deconvolution changed the sign of age‐related change estimates, the estimates are not “statistically significant” for each pipeline alone, except for mPFC ROIs 1 and 2 without deconvolution. (c). Specification curve of age‐related change in fear > baseline amygdala—mPFC gPPI. Points represent estimated linear age‐related change and lines are corresponding 95% posterior intervals. Models are ordered by age‐related change estimates, and the dotted line represents the median estimate across all specifications. Color indicates sign of beta estimates and whether respective posterior intervals include 0 (blue = negative including 0, green = positive including 0, purple = positive excluding 0, black = median across all specifications). Black points with error bars represent the median and IQR ranks of specifications making the choice indicated on the corresponding line. (d). Model specification information corresponding to each model in c. Variables on the y‐axis represent analysis choices, corresponding color‐coded marks indicate that a choice was made, and blank space indicates that the choice was not made in a given analysis. Within each category (Group‐Level Model, mPFC ROI, and Participant‐Level Model), respectively, decision points are ordered from top to bottom by the median model rank when the corresponding choice is made (i.e., choices at the top of each panel tend to have more negative age‐related change estimates). See https://pbloom.shinyapps.io/amygdala_mpfc_multiverse/ for interactive visualizations
FIGURE 5
FIGURE 5
Multiverse analyses of age‐related change in amygdala—mPFC connectivity using beta‐series correlation (BSC) methods. (a). Specification curve of age‐related change in amygdala—mPFC BSC for fear trials. Points represent estimated linear age‐related change and lines are corresponding 95% posterior intervals. Models are ordered by age‐related change estimates, and the dotted line represents the median estimate across all specifications. Color indicates sign of beta estimates and whether respective posterior intervals include 0 (blue = negative including 0, green = positive including 0, purple = positive excluding 0, and black = median across all specifications). (b). Model specification information corresponding to each model in a. Variables on the y‐axis represent analysis choices, corresponding color‐coded marks indicate that a choice was made, and blank space indicates that the choice was not made in a given analysis. Within each category (amygdala ROI, group‐level model, global signal subtraction, and mPFC ROI) respectively, decision points are ordered from top to bottom by the median model rank when the corresponding choice is made (i.e., choices at the top of each panel tend to have more negative age‐related change estimates). Black points with error bars represent the median and IQR ranks of specifications making the choice indicated on the corresponding line. GSS = global signal correction using post hoc mean centering. (c). Example model predictions for age‐related change in amygdala—mPFC BSC for fear trials for analysis pipelines with a global signal subtraction (GSS, post hoc mean centering) step (red), or without (blue) for each of the four mPFC regions (see Figure 4a) with the left and right amygdala. Pipelines shown have random slopes, no covariates for task block or scanner, and no quadratic age term. (d). Between‐scan rank‐order correlations between amygdala—mPFC connectivity measures. All gPPI measures are for the fear > baseline contrast, and BSC measures are for fear trials. See https://pbloom.shinyapps.io/amygdala_mpfc_multiverse/ for interactive visualizations
FIGURE 6
FIGURE 6
Multiverse analyses of associations between amygdala—mPFC circuitry and separation anxiety. (a). Age‐related change in SCARED and RCADS raw and t‐scores for parent‐reported separation anxiety subscales. The red dotted line in the middle panel represents the clinical threshold for the standardized RCADS measure (because this t‐score measure is standardized based on age and gender, no age‐related change is expected). (b). Separate specification curves for associations of amygdala reactivity (left), amygdala—mPFC connectivity (both gPPI and BSC; center two panels), and amygdala reactivity slopes across trials (right) with the three separation anxiety outcomes shown in a. Points represent estimated associations between brain measures and separation anxiety (controlling for mean FD and age) and lines are corresponding 95% posterior intervals. Models are ordered by beta estimates, and the dotted line represents the median estimate across all specifications. Color indicates sign of beta estimates and whether respective posterior intervals include 0 (red = negative excluding 0, blue = negative including 0, green = positive including 0). Scores on each separation anxiety outcome were z‐scored for comparison. (c). Example model predictions for associations between fear > baseline amygdala—mPFC gPPI and each separation anxiety measure. Predictions and 95% posterior intervals are plotted for each separation anxiety measure separately for each mPFC region, and for gPPI pipelines with and without a deconvolution step. Pipelines shown use robust regression, have random slopes, no covariates for task block or scanner, and no quadratic age term
FIGURE 7
FIGURE 7
Longitudinal test–retest Bayesian ICC estimates. ICC values are shown for amygdala reactivity (a), slopes of amygdala reactivity betas across trials (b), amygdala—mPFC functional connectivity using both gPPI and BSC methods (c), and separation anxiety and in‐scanner head motion measurements (d). Shaded background colors depict whether ICC estimates are categorized as poor (<.4), fair (.4–.6), or good (.6–.75) reliability. No ICC estimates met the threshold for excellent reliability (>.75). Bayesian ICC estimates were calculated through a variance decomposition based on posterior predictive distributions. Negative values indicate higher posterior predictive variances not conditioned on random effect terms than conditioned on random effects terms

Similar articles

Cited by

References

    1. Abdulrahman, H. , & Henson, R. N. (2016). Effect of trial‐to‐trial variability on optimal event‐related fMRI design: Implications for beta‐series correlation and multi‐voxel pattern analysis. NeuroImage, 125, 756–766. 10.1016/j.neuroimage.2015.11.009 - DOI - PMC - PubMed
    1. Achenbach, T. M. (1991). Integrative guide for the 1991 CBCL/4‐18, Ysr, and Trf profiles (1st US‐1st Printing edition). University of Vermont/Department of Psychiatry.
    1. Achterberg, M. , & van der Meulen, M. (2019). Genetic and environmental influences on MRI scan quantity and quality. Developmental Cognitive Neuroscience, 38, 100667. 10.1016/j.dcn.2019.100667 - DOI - PMC - PubMed
    1. Adolphs, R. (2008). Fear, faces, and the human amygdala. Current Opinion in Neurobiology, 18(2), 166–172. 10.1016/j.conb.2008.06.006 - DOI - PMC - PubMed
    1. Bates, D. , Maechler, M. , & Bolker, B . (2011). lme4: Linear mixed‐effects models using S4 classes (0.999375‐39) [Computer software]. http://www.idg.pl/mirrors/CRAN/web/packages/lme4/

Publication types