. 2022 May 9;14(5):e15326.
doi: 10.15252/emmm.202115326. Epub 2022 Apr 19.

BNT162b2 vaccine induces antibody release in saliva: a possible role for mucosal viral protection?

Collaborators, Affiliations

BNT162b2 vaccine induces antibody release in saliva: a possible role for mucosal viral protection?

Abbass Darwich et al. EMBO Mol Med. .

Abstract

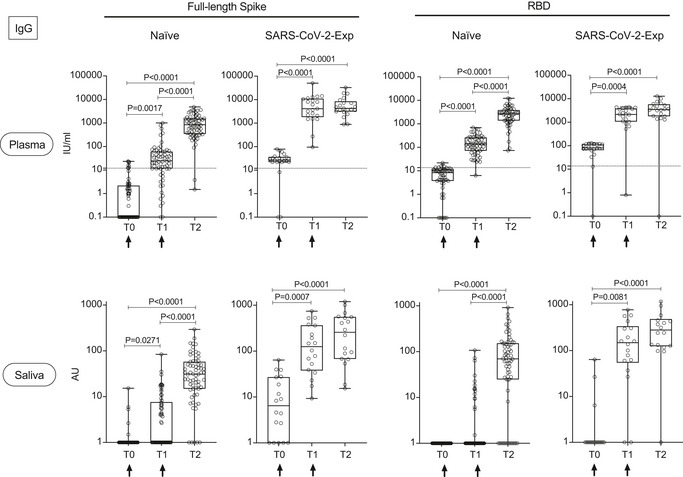
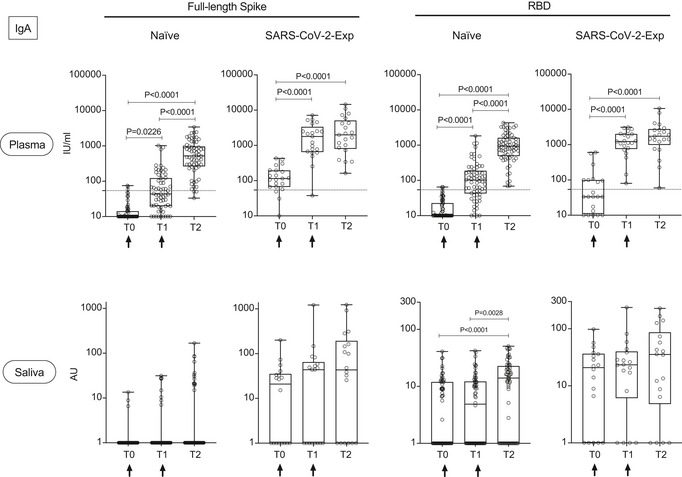
Vaccination against an airborne pathogen is very effective if it induces also the development of mucosal antibodies that can protect against infection. The mRNA-based vaccine-encoding SARS-CoV-2 full-length spike protein (BNT162b2, Pfizer/BioNTech) protects also against infection despite being administered systemically. Here, we show that upon vaccination, cognate IgG molecules are also found in the saliva and are more abundant in SARS-CoV-2 previously exposed subjects, paralleling the development of plasma IgG. The antibodies titer declines at 3 months from vaccination. We identified a concentration of specific IgG in the plasma above which the relevant IgG can be detected in the saliva. Regarding IgA antibodies, we found only protease-susceptible IgA1 antibodies in plasma while they were present at very low levels in the saliva over the course of vaccination of SARS-CoV-2-naïve subjects. Thus, in response to BNT162b2 vaccine, plasma IgG can permeate into mucosal sites and participate in viral protection. It is not clear why IgA1 are detected in low amount, they may be proteolytically cleaved.

Keywords: BNT162b2; IgA; IgG; SARS-CoV-2; mucosal immunity.


Figures

Figure 1
Figure 1. BNT162b2 vaccination induces the release of SARS‐CoV‐2‐specific IgG in plasma and saliva
Antibody response in plasma and saliva at different time points (T0, T1, T2) from BNT162b2 vaccination in naïve (plasma: n = 64; saliva: n = 66) and SARS‐CoV‐2‐Exp (plasma: n = 21; saliva: n = 18) subjects. Subjects received the first vaccine dose at day 0 (T0) and the 2nd dose at day 21 (T1) (indicated with an arrow). T2 corresponds to 7–10 days after the 2nd dose. Plasma and saliva were tested for IgG to full‐length spike and its receptor‐binding domain (RBD). For plasma samples the titers of antigen‐specific Ig are expressed in IU/ml. LoD is indicated by a dotted line: LoD (spike) = 12, LoD (RBD) = 13.8. For saliva samples, the titers of antigen‐specific Ig were normalized by dividing the values of SARS‐CoV‐2‐specific Ig by total IgG concentration of each sample. The normalization was applied only to values higher than LoD. The adjusted values are expressed in AU. The box plots show the interquartile range, the horizontal lines show the median values, and the whiskers indicate the minimum‐to‐maximum range. Each dot corresponds to an individual subject. Log scale on y axis. P‐values were determined using the Friedman test with the Dunnett's multiple comparison test. Source data are available online for this figure.
Figure 2
Figure 2. BNT162b2 vaccination induces the release of SARS‐CoV‐2‐specific IgA in plasma and saliva
Antibody response in plasma and saliva at different time points (T0, T1, T2) from BNT162b2 vaccination in naïve (n = 66) and SARS‐CoV‐2‐Exp (plasma: n = 21; saliva: n = 18) subjects. Subjects received the first vaccine dose at day 0 (T0), and the 2nd dose at day 21 (T1) (indicated with an arrow). T2 corresponds to 7–10 days after the 2nd dose. Plasma and saliva were tested for IgA to full‐length spike and its receptor‐binding domain (RBD). For plasma samples the titers of antigen‐specific Ig are expressed in IU/ml. LoD is indicated by a dotted line: LoD (spike) = 54.22, LoD (RBD) = 54.08. For saliva samples, the titers of antigen‐specific Ig were normalized by dividing the values of SARS‐CoV‐2‐specific Ig by total IgA concentration of each sample. The normalization was applied only to values higher than LoD. The adjusted values are expressed in AU. The box plots show the interquartile range, the horizontal lines show the median values, and the whiskers indicate the minimum‐to‐maximum range. Each dot corresponds to an individual subject. Log scale on y axis. P‐values were determined using the Friedman test with the Dunnett's multiple comparison test. Source data are available online for this figure.
Figure EV1
Figure EV1. Identification of saliva SARS‐CoV‐2‐specific IgG threshold in relation to plasma SARS‐CoV‐2‐specific IgG
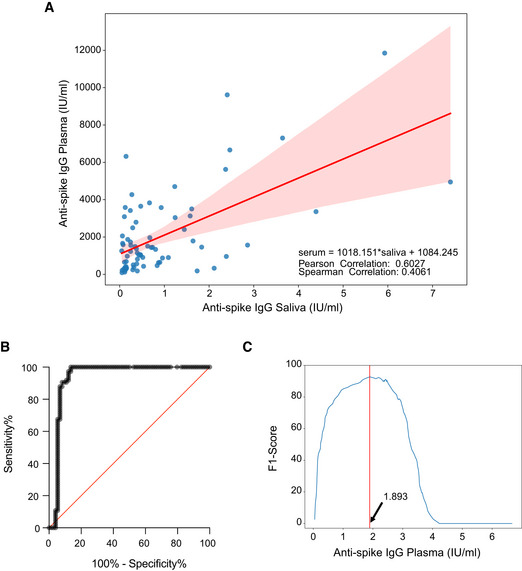
  1. Scatterplot of the recorded values of spike SARS‐CoV‐2‐specific IgG in plasma and saliva, on the X‐axis and Y‐axis, respectively. In red, linear interpolation obtained by regression of SARS‐CoV‐2‐specific IgG in the plasma on IgG in the saliva.

  2. ROC curve (0.9374 ± 0.02597, 95% CI 0.8865 to 0.9883 P < 0.0001).

  3. Plot of the F1 scores computed for different threshold levels. Log values of anti‐spike IgG in the plasma are reported on X‐axis. The vertical red line highlights the maximum F1 score registered and the respective threshold value: 1.893 (log plasma) that corresponds to 78,16 IU/ml.

Figure 3
Figure 3. Release of SARS‐CoV‐2‐specific IgG and IgA in plasma and saliva after BNT162b2 vaccination and in COVID‐19 patients
The antibody response of vaccinated naïve (plasma: n = 64; saliva n = 66) or SARS‐CoV‐2‐Exp (plasma: n = 21; saliva: n = 18) subjects at 7–10 days after the second dose (T2) was compared to that obtained in COVID‐19 patients (plasma n = 28; saliva n = 26). As a control, SARS‐CoV‐2‐specific antibody response was analyzed in nonvaccinated subjects (n = 19, Control). Plasma and saliva were tested for IgA to full‐length spike and its receptor‐binding domain (RBD). For plasma samples, the titers of antigen‐specific Ig are expressed in IU/ml. LoD is indicated by a dotted line: LoD (spike IgG) = 12, LoD (RBD IgG) = 13.8, LoD (spike IgA) = 54.22, LoD (RBD IgA) = 54.08. For saliva samples, the titers of antigen‐specific Ig were normalized by dividing the values of SARS‐CoV‐2‐specific Ig by total IgA or total IgG concentrations of each sample. The normalization was applied only to values higher than LoD. The adjusted values are expressed in AU. The box plots show the interquartile range, the horizontal lines show the median values, and the whiskers indicate the minimum‐to‐maximum range. Each dot corresponds to an individual subject. Log scale on y axis. P‐values were determined using the Kruskal–Wallis test with the Dunn's multiple comparison test. Source data are available online for this figure.
Figure EV2
Figure EV2. IgG and IgA to nucleocapsid (N protein) in saliva and plasma
Anti‐N (nucleocapsid protein) IgG and IgA were measured both in plasma and saliva of vaccinated naïve (n = 18) and SARS‐CoV‐2‐Exp (n = 19) subjects at 7–10 days after the second dose (T2), in COVID‐19 patients (plasma: n = 19; saliva: n = 26) and in nonvaccinated subjects (n = 19, Control). For plasma samples, the titers of antigen‐specific Ig are expressed in IU/ml. LoD is indicated by a dotted line: LoD (N IgG) = 1.22, LoD (N IgA) = 190. For saliva samples, the titers of antigen‐specific Ig were normalized by dividing the values of SARS‐CoV‐2‐specific Ig by total IgA or total IgG concentrations of each sample. The normalization was applied only to values higher than LoD. The adjusted values are expressed in AU. The box plots show the interquartile range, the horizontal lines show the median values, and the whiskers indicate the minimum‐to‐maximum range. Each dot corresponds to an individual subject. Log scale on y axis. P‐values were determined using the Kruskal–Wallis test with the Dunn's multiple comparison test.
Figure 4
Figure 4. Release of SARS‐CoV‐2‐specific IgA1 and IgA2 antibodies in plasma and saliva after BNT162b2 vaccination and in COVID‐19 patients
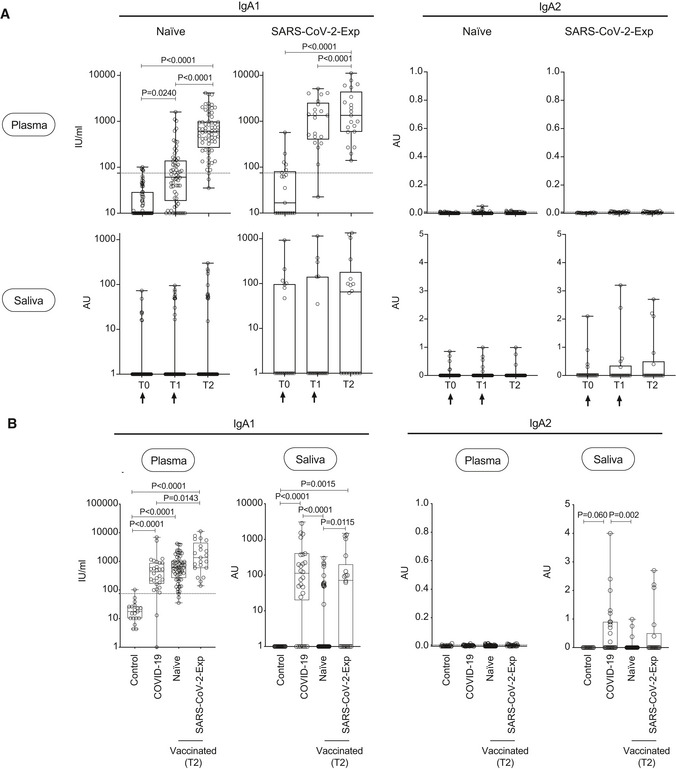
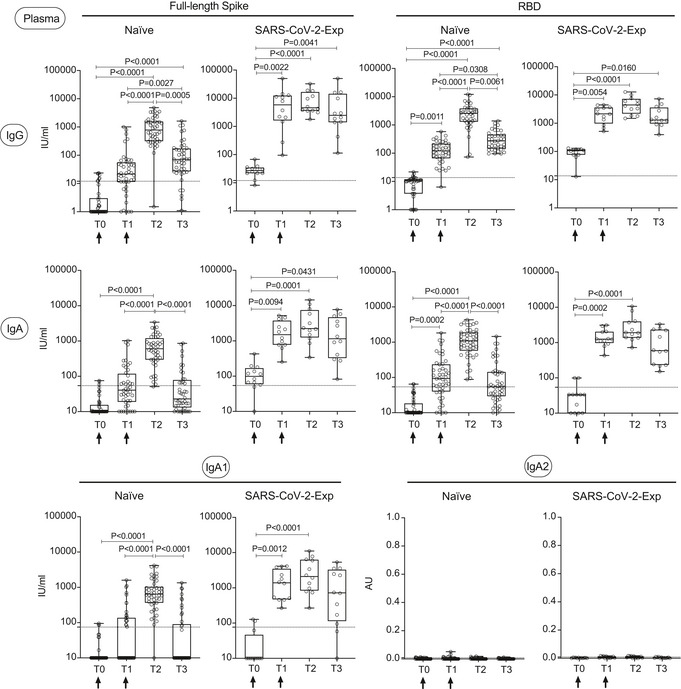
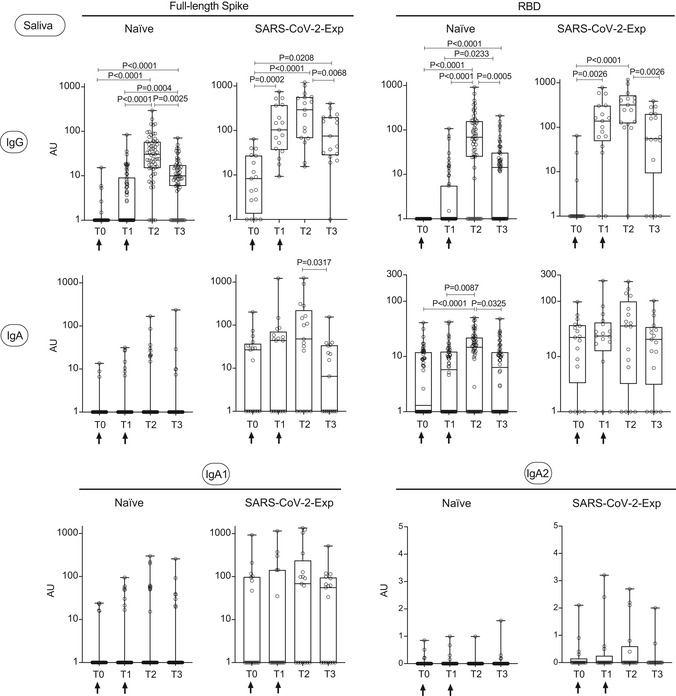
  1. IgA1 and IgA2 subtypes specific for spike protein were measured in plasma and saliva at different time point (T0,T1, T2) of vaccinated naïve (plasma: n = 64; saliva: n = 63 (IgA1), n = 55 (IgA2)) or SARS‐CoV‐2‐Exp (plasma: n = 21; saliva: n = 18) subjects. Subjects received the first vaccine dose at day 0 (T0), and the 2nd dose at day 21 (T1) (indicated with an arrow). T2 corresponds to 7–10 days after the 2nd dose. For plasma samples, the titers of antigen‐specific IgA1 and IgA2 are expressed in IU/ml and AU, respectively (see Methods). LoD is indicated by a dotted line: LoD (IgA1) = 74.64; LoD (IgA2) = 0.009. For saliva samples, the titers of antigen‐specific Ig were normalized by dividing the values of SARS‐CoV‐2‐specific Ig by total IgA concentration of each sample. The normalization was applied only to values higher than LoD. The adjusted values are expressed in AU.

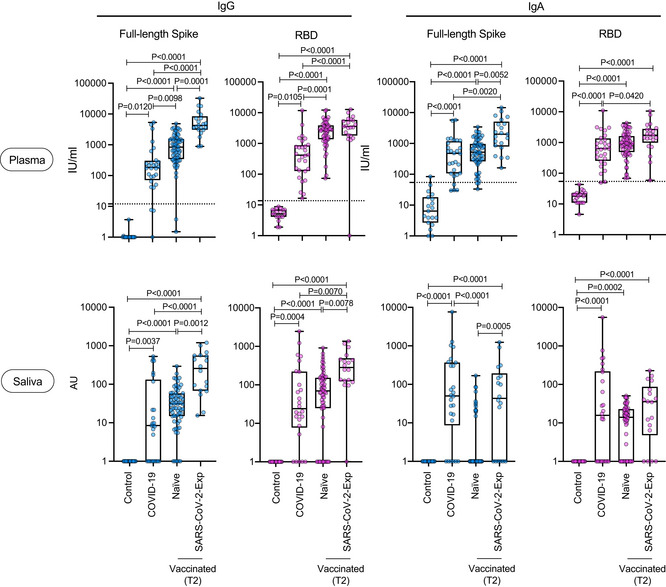
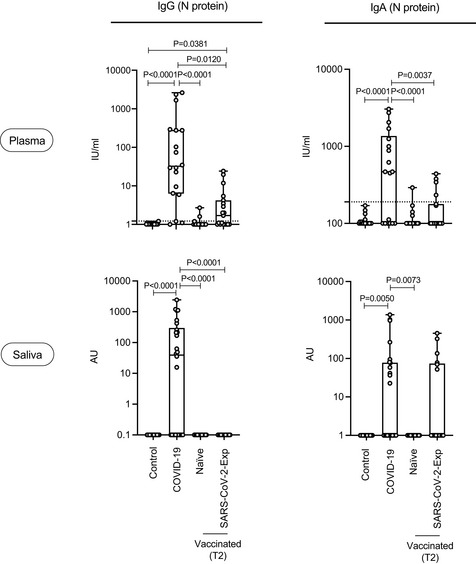
  2. IgA1 and IgA2 subtypes specific for spike protein were measured in plasma and saliva of vaccinated naïve and SARS‐CoV‐2‐Exp subjects 7–10 days after second dose (T2), and the antibody response was compared to that obtained in COVID‐19 patients (plasma: n = 28; saliva: n = 26) and in nonvaccinated subjects (n = 19, Control).

Data information: The box plots show the interquartile range, the horizontal lines show the median values, and the whiskers indicate the minimum‐to‐maximum range. Each dot corresponds to an individual subject. Log scale on y axis (only for IgA1). P‐values were determined using the Friedman test with the Dunnett's multiple comparison test (A) or the Kruskal–Wallis test with the Dunn's multiple comparison test (B). Source data are available online for this figure.
Figure EV3
Figure EV3. SARS‐CoV‐2‐specific IgG, IgA, and IgA1 levels decrease in plasma three months after BNT162b2 vaccination
SARS‐CoV‐2‐specific antibody responses were measured in the plasma of vaccinated naïve (n = 44) and SARS‐CoV‐2‐Exp (n = 12) subjects at different time points: at the time of the first (T0) and the 2nd dose vaccine dose (T1) (indicated with an arrow), at 7–10 days (T2) and 3 months (T3) after the 2nd dose. Plasma was tested for IgG and IgA to full‐length spike and its receptor‐binding domain (RBD) and for anti‐spike IgA1 and IgA2. The titers of antigen‐specific Ig are expressed in IU/ml, except for IgA2 that are expressed in AU (see Materials and Methods). LoD is indicated by a dotted line: LoD (spike IgG) = 12, LoD (RBD IgG) = 13.8, LoD (spike IgA) = 54.22, LoD (RBD IgA) = 54.08, LoD (IgA1) = 74.64; LoD (IgA2) = 0.009. The box plots show the interquartile range, the horizontal lines show the median values, and the whiskers indicate the minimum‐to‐maximum range. Each dot corresponds to an individual subject. Log scale on y axis (except for IgA2). P‐values were determined using the Friedman test with the Dunnett's multiple comparison test.
Figure EV4
Figure EV4. SARS‐CoV‐2‐specific IgG, IgA, and IgA1 levels decrease in saliva three months after BNT162b2 vaccination
SARS‐CoV‐2‐specific antibody responses were measured in the saliva of vaccinated naïve (n = 59) and SARS‐CoV‐2‐Exp (n = 17) subjects at different time points: at the time of the first (T0) and the 2nd dose vaccine dose (T1) (indicated with an arrow), at 7–10 days (T2) and 3 months (T3) after the 2nd dose. Saliva was tested for IgG and IgA to full‐length spike and its receptor‐binding domain (RBD) and for anti‐spike IgA1 and IgA2. The titers of antigen‐specific Ig were normalized by dividing the values of SARS‐CoV‐2‐specific Ig by total IgA or total IgG concentrations of each sample. The normalization was applied only to values higher than LoD. The adjusted values are expressed in AU. The box plots show the interquartile range, the horizontal lines show the median values, and the whiskers indicate the minimum‐to‐maximum range. Each dot corresponds to an individual subject. Log scale on y axis (except for IgA2). P‐values were determined using the Friedman test with the Dunnett's multiple comparison test.

References

    1. Abu Jabal K, Ben‐Amram H, Beiruti K, Batheesh Y, Sussan C, Zarka S, Edelstein M (2021) Impact of age, ethnicity, sex and prior infection status on immunogenicity following a single dose of the BNT162b2 mRNA COVID‐19 vaccine: real‐world evidence from healthcare workers, Israel, December 2020 to January 2021. Euro Surveill 26: 2100096 - PMC - PubMed
    1. Ali F, Sweeney DA (2021) No one likes a stick up their nose: making the case for saliva‐based testing for coronavirus disease 2019 (COVID‐19). Clin Infect Dis 72: e357–e358 - PMC - PubMed
    1. Amanat F, Stadlbauer D, Strohmeier S, Nguyen THO, Chromikova V, McMahon M, Jiang K, Arunkumar GA, Jurczyszak D, Polanco J et al (2020) A serological assay to detect SARS‐CoV‐2 seroconversion in humans. Nat Med 26: 1033–1036 - PMC - PubMed
    1. Azzi L, Dalla Gasperina D, Veronesi G, Shallak M, Ietto G, Iovino D, Baj A, Gianfagna F, Maurino V, Focosi D et al (2022) Mucosal immune response in BNT162b2 COVID‐19 vaccine recipients. EBioMedicine 75: 103788 - PMC - PubMed
    1. Baeza‐Yates R, Ribeiro‐Neto B (1999) Modern information retrieval. New York, NY: ACM Press;