. 2022 Apr 1;149(7):dev200332.
doi: 10.1242/dev.200332. Epub 2022 Apr 8.

Notch-dependent DNA cis-regulatory elements and their dose-dependent control of C. elegans stem cell self-renewal

Affiliations

Notch-dependent DNA cis-regulatory elements and their dose-dependent control of C. elegans stem cell self-renewal

Tina R Lynch et al. Development. .

Abstract

A long-standing biological question is how DNA cis-regulatory elements shape transcriptional patterns during metazoan development. Reporter constructs, cell culture assays and computational modeling have made major contributions to answering this question, but analysis of elements in their natural context is an important complement. Here, we mutate Notch-dependent LAG-1 binding sites (LBSs) in the endogenous Caenorhabditis elegans sygl-1 gene, which encodes a key stem cell regulator, and analyze the consequences on sygl-1 expression (nascent transcripts, mRNA, protein) and stem cell maintenance. Mutation of one LBS in a three-element cluster approximately halved both expression and stem cell pool size, whereas mutation of two LBSs essentially abolished them. Heterozygous LBS mutant clusters provided intermediate values. Our results lead to two major conclusions. First, both LBS number and configuration impact cluster activity: LBSs act additively in trans and synergistically in cis. Second, the SYGL-1 gradient promotes self-renewal above its functional threshold and triggers differentiation below the threshold. Our approach of coupling CRISPR/Cas9 LBS mutations with effects on both molecular and biological readouts establishes a powerful model for in vivo analyses of DNA cis-regulatory elements.

Keywords: sygl-1; Gradient; Homotypic cluster; Spatiotemporal resolution; Transcription factor binding site; smFISH.


Conflict of interest statement

Competing interests The authors declare no competing or financial interests.

Figures

Fig. 1.
Fig. 1.
Identification of functional LBSs in sygl-1 cis-regulatory DNA. (A) C. elegans GSC molecular regulators. (B) GSCs are maintained in null mutants (ø) of either sygl-1 or lst-1, but not maintained when both genes are null. (C) Schematic of the distal gonad. The niche (gray) is a somatic cell at the distal end. GLP-1/Notch signaling (arrows) maintains a pool of GSCs in the distal PZ (yellow) and activates graded sygl-1 transcription (magenta). Germ cells in the proximal PZ become primed for differentiation (green). (D) The Notch transcriptional activation complex binds DNA (black line) at an LBS (black arrowhead) via its CSL DNA-binding protein (LAG-1 in C. elegans). Other components are the Notch intracellular domain (NICD) and Mastermind-like coactivator (LAG-3 in C. elegans). Right-facing arrow labeled ‘ON’ represents predicted transcription start site. (E) Summary of the LBS mutations. Filled arrowheads represent canonical 5′-YGTGRGAA-3′ LBS; open arrowheads represent noncanonical LBSs. Arrowheads point right for 5′-CGTGGGAA-3′ and left for its complement 5′-TTCCCACG-3′. Mutant LBS (x) is 5′-TGACGTCA-3′ for LBS B, C and D, and 5′-AGACGTCA-3′ for LBS A (mutated bases underlined, or in red in figure). Spacing in base pairs (bp) between LBS is to scale. 1xV5 (yellow) was inserted to visualize SYGL-1 protein. Exons are shown in magenta and untranslated regions (UTRs) in gray. (F) Representative maximum-intensity z-projections of V5-stained dissected distal gonads. Scale bar: 20 µm. For all figures throughout this paper, see Table S1 for strain genotypes. (G) Fiji quantification of V5 immunosignal normalized to sygl-1::V5(wt) (see Materials and Methods). Germ cell position measures are germ cell diameters (gcd; top axis) and microns (µm; bottom axis). Total gonads scored from two independent experiments: wild type, 29; A mut, 31; BCD mut, 25; sygl-1(ø), 24.
Fig. 2.
Fig. 2.
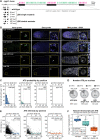
LBS mutations weaken niche-dependent transcriptional response of sygl-1. (A) Schematic of the sygl-1 locus. Black boxes represent exons, gray boxes represent UTRs. Black arrow indicates predicted transcription start site. smFISH probes are shown above DNA as vertical lines: exon probes (magenta) and intron probes (green) (see Materials and Methods). The sygl-1(ø) control removes the DNA sequence that probes detect. Expansion shows individual LBSs and their mutations; conventions as in Fig. 1E. LBS mutants in this figure are not epitope-tagged. (B) Representative images of sygl-1 smFISH in the distal end of dissected adult gonads. Exon channel colors reflect intensity to show mRNA without saturating ATS (see Materials and Methods; color key in upper right; pixel intensities 3-50). DAPI shown in grayscale. Main images are maximum-intensity z-projections; insets are 4×-magnified maximum-intensity projections (four 0.3 µm slices). Arrowheads indicate ATS (overlapping intron/exon/DAPI). Arrows indicate cytoplasmic mRNA (exon only). Scale bars: 5 μm (main image); 1 μm (insets). (C-F) See Fig. S2E for specific values. (C) Percentage of nuclei with at least one ATS as a function of distance (units as in Fig. 1G). Vertical dashed line indicates transcriptional extent of gradient, after which <5% cells contain at least one ATS. Error bars represent s.e.m. (D) Pie charts showing the number of ATSs per nucleus for wild type and LBS mutants. Percentages are averages from three experiments (see Materials and Methods). Nuclei with zero sygl-1 ATSs have been excluded. (E) Position of ATSs in wild type and single and double LBS mutants. Each dot represents one ATS (see Materials and Methods); see Fig. S2D for details (e.g. total ATSs scored). Solid line represents mean (5 µm intervals); shaded area represents s.e.m. (F) ATS intensities as a rough estimate of the number of nascent transcripts/ATS (see Materials and Methods). Boxplot center lines represent medians (wild type: 5.1; single mutants; 3.7; double mutants: 2.6); see Materials and Methods for BoxPlotR conventions. Each dot represents mean of all ATS/experiment (irrespective of position). Total number of experiments: wild type, 9; LBS single mutants, 10; LBS double mutants: 8. Experiments with zero ATS detected (BC mut, BD mut) are not represented. **P=0.0009; ***P=7.1×10⁻⁵ (Student's t-test).
Fig. 3.
Fig. 3.
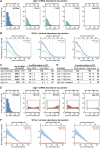
LBS mutations reduce molecular sygl-1 mRNA and protein abundance. (A-F) Molecular output of LBS single (A-D) and double (E,F) mutants. (A,E) Average number of sygl-1 mRNA molecules per cell (see Materials and Methods). See Fig. S2E for specific values. Position measures as in Fig. 1G. Error bars represent s.e.m. Vertical dashed lines indicate the extent of mRNA gradient after which values fall below background and/or reach minimum. Insets in E show the data near background in greater detail with horizontal dashed lines indicating the background level [from sygl-1(ø); see Materials and Methods]. (B,F) Quantification of V5 immunofluorescence as a measure of SYGL-1 expression (see Materials and Methods). Solid lines represent mean; shaded area represents s.e.m. Horizontal dashed line at ‘0’ is based on an untagged control. Small peaks 0-3 µm from the distal end are nonspecific V5 signal (see Materials and Methods). Vertical dashed lines indicate the extent of the protein gradient after which values fall below 10% of the wild-type maximum. See D for total number of gonads scored in B; total gonads scored in F are from three or four experiments: wild type, 61; BC mut, 49; BD mut, 59 CD mut, 39. (C) Summary of mRNA data in LBS single mutants. Numbers are mean per experiment ±s.d. between experiments (see Materials and Methods). n, number of gonads scored in at least three experiments. Peak mRNA is the number of mRNA molecules per cell from the 0-5 µm region as a percentage of wild type; total mRNA is the number of mRNA molecules per gonad as a percentage of wild type. (D) Summary of protein data in LBS single mutants. Numbers are mean percentage of wild type for each replicate ±s.d. between replicates (see Materials and Methods). n: total gonads scored in three replicates. All data were obtained in adults carrying lst-1(+); RNA data (A,C,E) is from smFISH experiments (strains not epitope-tagged) and protein data from V5 immunostaining (B,D,F).
Fig. 4.
Fig. 4.
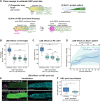
LBS mutations reduce GSC pool size. (A) Schematics representing three complementary assays used to estimate GSC pool size. Top left: PZ with progression from GSCs (yellow) to overt differentiation (green; meiotic prophase). Top right: GLD-1 protein increases as germ cells differentiate. Bottom left: At 15°C, lst-1(ø) sygl-1(x); emb-30(ts) PZ contains scattered M-phase (PH3+, magenta) cells and increasing GLD-1 (green). Bottom right: When shifted to 25°C, PZ germ cells arrest. Distal PH3+, GLD-1 cells are inferred to come from GSCs and proximal PH3 cells; GLD-1+ cells are inferred to come from GSC daughters primed to differentiate. Asterisk indicates the distal end. (B,C) Boxplots showing the effects of LBSs on PZ length and cell number. Boxplot conventions match Fig. 2F. Small circles indicate individual gonads; large circles indicate replicate averages. Data from each gonad were fitted to a linear mixed effects model; Tukey's post-hoc test was used to make pairwise comparisons between genotypes. ***P<0.0001; n.s., not significant (P≥0.01). (B) Average number of germ cell diameters (gcd) in PZ were manually counted. Total gonads were scored in two to five experiments: wild type, 141; B mut, 106; C mut, 73; D mut, 97. (C) Total number of cells in the PZ were counted with Imaris software (see Materials and Methods). Total gonads were scored in three independent experiments: wild type, 40; B mut, 28; C mut, 42; D mut, 42. (D) Fixed gonads were stained with polyclonal antibody to GLD-1 to determine the effect of LBSs on GLD-1 expression. Arrow indicates the distal shift of the increase in GLD-1 expression. Position measures as in Fig. 1G. Signal intensities were normalized against internal controls (see Materials and Methods). Solid lines represent mean; shaded areas represent s.e.m.; 24 gonads/genotype scored from two replicates. (E) Representative maximum-intensity projections. Left: PH3 (magenta), GLD-1 (green). Gray lines indicate the extent of the GSC pool. Right: DAPI (cyan). Scale bar: 20 µm. (F) Estimated number of GSCs in the naïve pool; GLD-1 PH3+ cells were manually counted (see Materials and Methods). Boxplot conventions as in B,C. Number of total gonads scored in two experiments: wild type, 26; D mut, 12. *P=0.05. Student's two-tailed t-test conducted on replicate averages; homoscedasticity assumed.
Fig. 5.
Fig. 5.
Solo LBSs are similar but not identical. (A) Boxplot showing the effect of LBS mutations on PZ length. Boxplot conventions and statistical tests as in Fig. 4B,C. Total gonads scored in two to four experiments: wild type, 111; BC mut, 57; BD mut, 59; CD mut, 48; sygl-1(ø), 48. *P<0.05 (P=0.04 in both cases); ***P<0.0001. All other pairwise comparisons are not significant (n.s., P>0.05). Not all n.s. comparisons shown. (B) Two explanations of an average of 1.4 mRNA molecules per cell in a troop of eight cells (see Fig. S4A). Left: One or two mRNA molecules present in each cell. An even mRNA distribution might be explained by false positives. Right: No RNA molecules in some cells and three to five in others. Concentrated mRNA is consistent with stochastic transcriptional bursts. (C) Percentage of total nuclei that contain at least one, at least three or at least five sygl-1 mRNA molecules in each bin of distance from the distal end (Materials and Methods). Position measures as in Fig. 1G. Error bars represent s.e.m. Strains in lst-1(+) background. LBS double mutant 0-5 µm bin values were fitted to a linear mixed effects model and Tukey's post-hoc compared LBS double mutant values with the 0-5 µm bin in sygl-1(ø). ***P<0.0001, n.s., P>0.01, color-coded for either the ‘at least three’ or ‘at least five’ data.
Fig. 6.
Fig. 6.
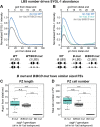
LBS number is a key factor in determining SYGL-1 abundance. (A,B) Quantification of V5 immunofluorescence as a measure of SYGL-1 expression. See Materials and Methods for sygl-1 heterozygote creation. (A) Thirty gonads per genotype scored in two experiments. (B) Total gonads scored in one to four experiments: wild type, 66; B mut, 73; B/BCD mut, 10. SYGL-1 abundance could not be measured in lst-1(ø) BD mut homozygotes, because they lack GSCs and hence lack a germline tissue. (C,D) Analysis of PZ length and PZ cell number in B/BCD mut heterozygotes and controls. Boxplot conventions as in Fig. 2F. ***P<0.01, n.s., P≥0.01; Student's two-tailed t-test (homoscedasticity assumed). Ten gonads per genotype scored from one experiment. (C) Average number of germ cell diameters (gcd) in PZ were manually counted. P=0.86 for B mut versus B/BCD mut. (D) Total number of cells in the PZ counted using Imaris. P=0.11 for B mut versus B/BCD mut.

Similar articles

Cited by

References

    1. Andersson, R. and Sandelin, A. (2020). Determinants of enhancer and promoter activities of regulatory elements. Nat. Rev. Genet. 21, 71-87. 10.1038/s41576-019-0173-8 - DOI - PubMed
    1. Arnett, K. L., Hass, M., McArthur, D. G., Ilagan, M. X., Aster, J. C., Kopan, R. and Blacklow, S. C. (2010). Structural and mechanistic insights into cooperative assembly of dimeric Notch transcription complexes. Nat. Struct. Mol. Biol. 17, 1312-1317. 10.1038/nsmb.1938 - DOI - PMC - PubMed
    1. Arribere, J. A., Bell, R. T., Fu, B. X., Artiles, K. L., Hartman, P. S. and Fire, A. Z. (2014). Efficient marker-free recovery of custom genetic modifications with CRISPR/Cas9 in Caenorhabditis elegans. Genetics 198, 837-846. 10.1534/genetics.114.169730 - DOI - PMC - PubMed
    1. Austin, J. and Kimble, J. (1987). glp-1 Is required in the germ line for regulation of the decision between mitosis and meiosis in C. elegans. Cell 51, 589-599. 10.1016/0092-8674(87)90128-0 - DOI - PubMed
    1. Bailey, A. M. and Posakony, J. W. (1995). Suppressor of Hairless directly activates transcription of Enhancer of split Complex genes in response to Notch receptor activity. Genes Dev. 9, 2609-2622. 10.1101/gad.9.21.2609 - DOI - PubMed

Publication types

MeSH terms