. 2023 Mar 17;119(1):167-182.
doi: 10.1093/cvr/cvac059.

Maturation of hiPSC-derived cardiomyocytes promotes adult alternative splicing of SCN5A and reveals changes in sodium current associated with cardiac arrhythmia

Affiliations

Maturation of hiPSC-derived cardiomyocytes promotes adult alternative splicing of SCN5A and reveals changes in sodium current associated with cardiac arrhythmia

Giulia Campostrini et al. Cardiovasc Res. .

Abstract

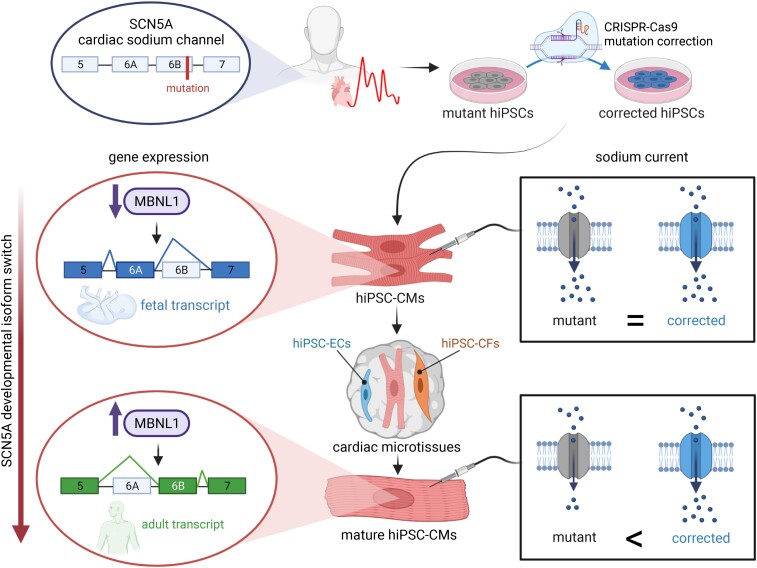
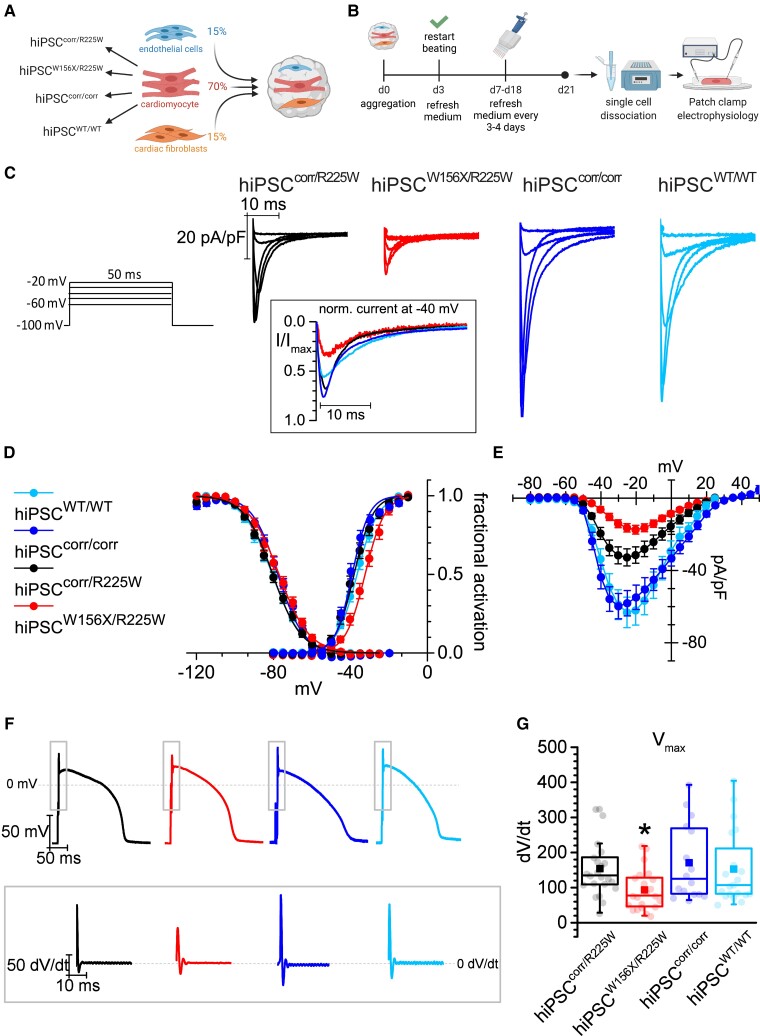
Aims: Human-induced pluripotent stem cell-cardiomyocytes (hiPSC-CMs) are widely used to study arrhythmia-associated mutations in ion channels. Among these, the cardiac sodium channel SCN5A undergoes foetal-to-adult isoform switching around birth. Conventional hiPSC-CM cultures, which are phenotypically foetal, have thus far been unable to capture mutations in adult gene isoforms. Here, we investigated whether tri-cellular cross-talk in a three-dimensional (3D) cardiac microtissue (MT) promoted post-natal SCN5A maturation in hiPSC-CMs.

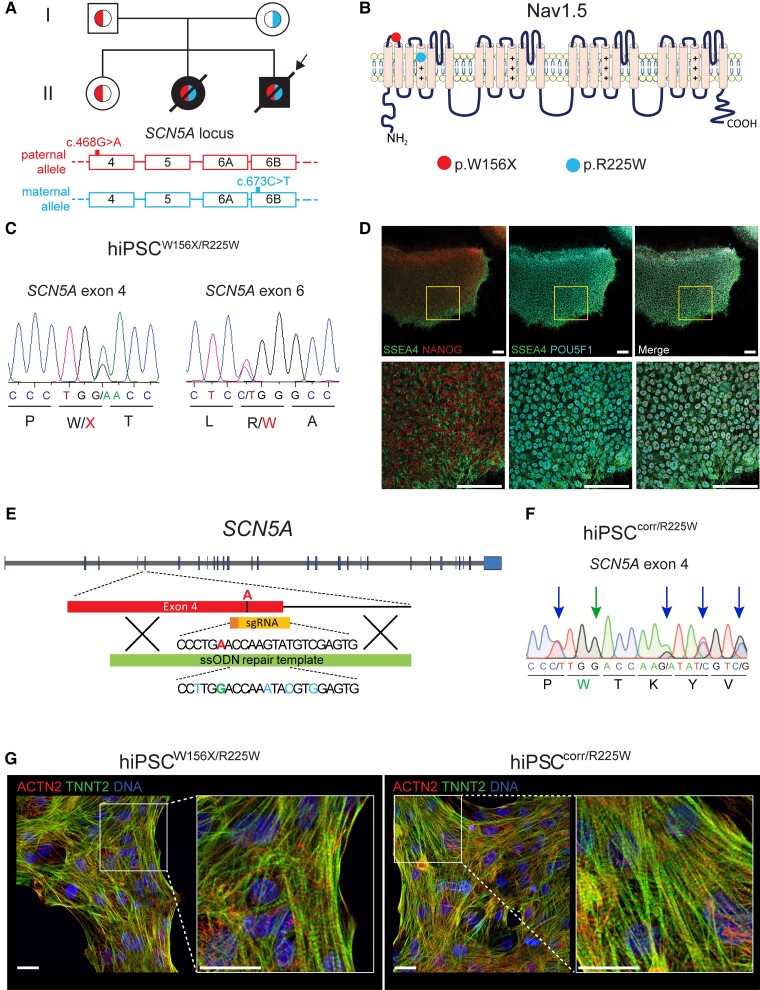
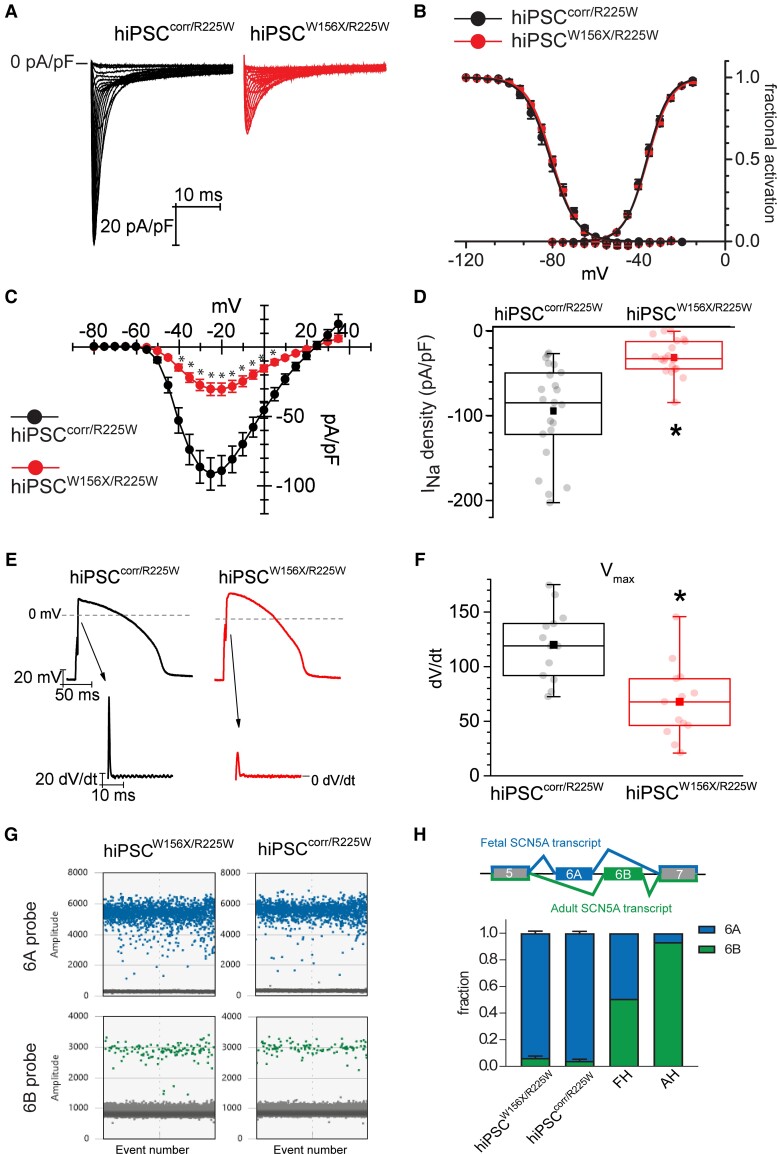
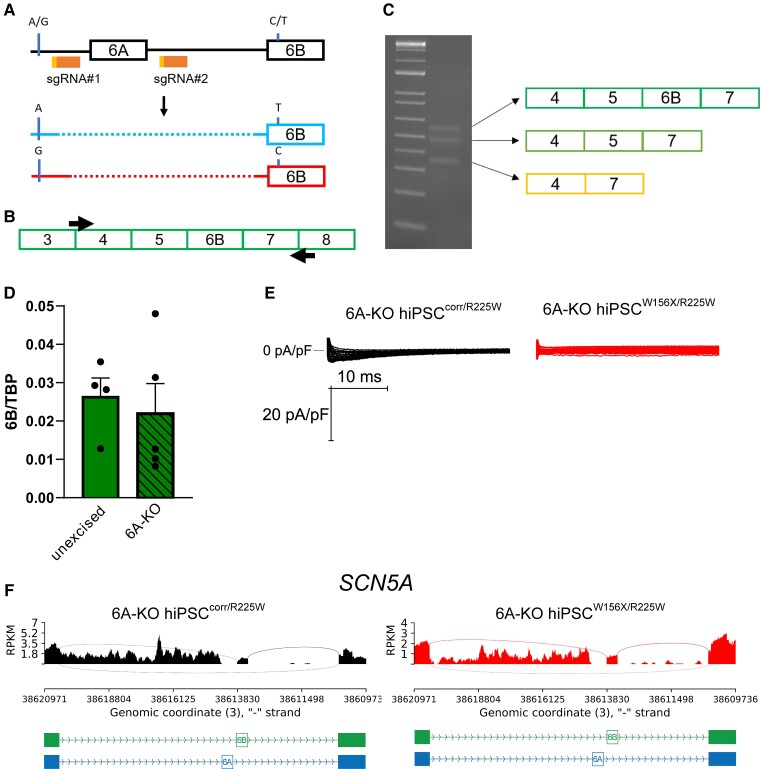
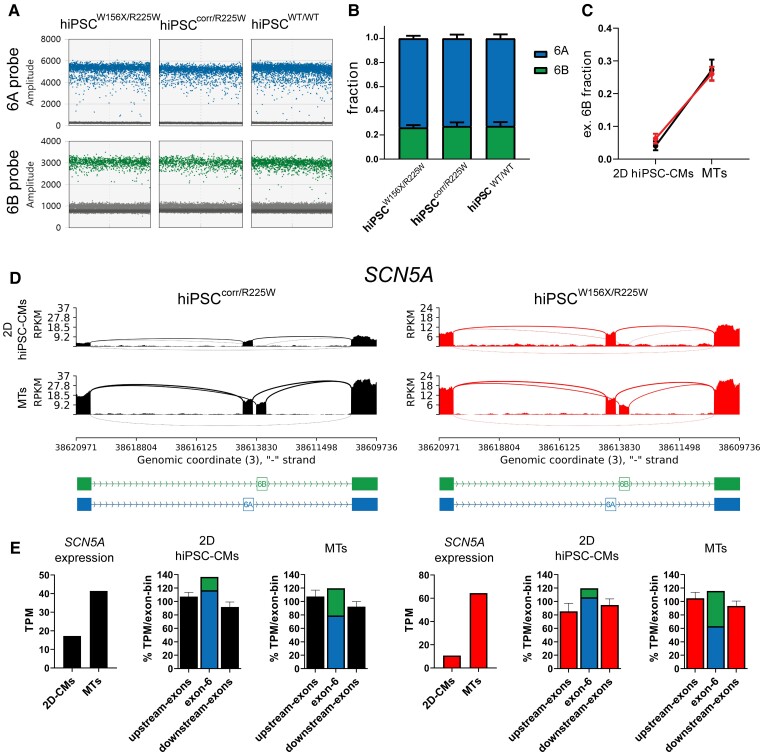
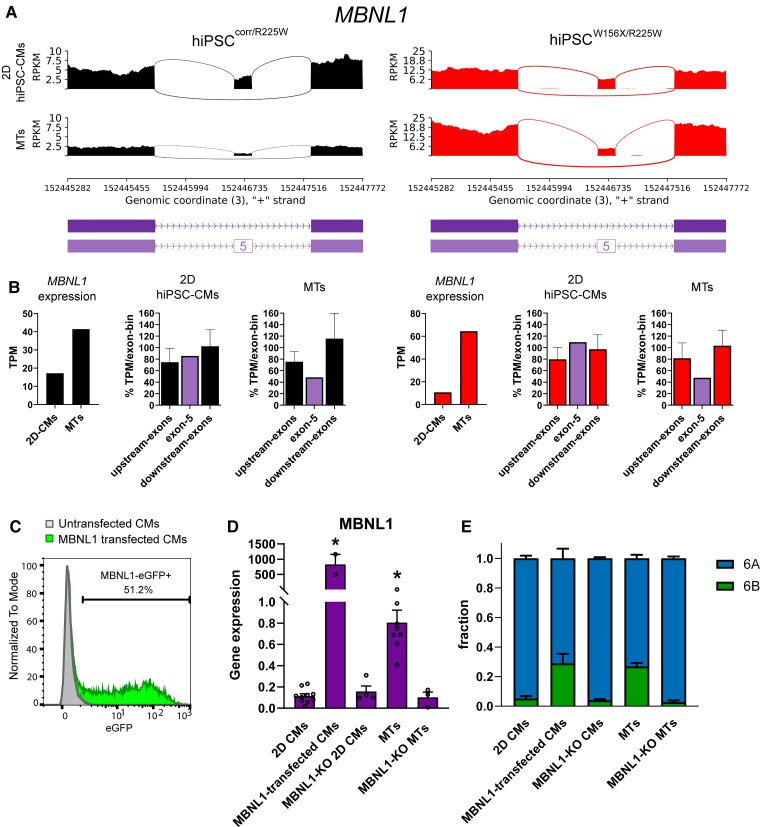
Methods and results: We derived patient hiPSC-CMs carrying compound mutations in the adult SCN5A exon 6B and exon 4. Electrophysiological properties of patient hiPSC-CMs in monolayer were not altered by the exon 6B mutation compared with isogenic controls since it is not expressed; further, CRISPR/Cas9-mediated excision of the foetal exon 6A did not promote adult SCN5A expression. However, when hiPSC-CMs were matured in 3D cardiac MTs, SCN5A underwent isoform switch and the functional consequences of the mutation located in exon 6B were revealed. Up-regulation of the splicing factor muscleblind-like protein 1 (MBNL1) drove SCN5A post-natal maturation in microtissues since its overexpression in hiPSC-CMs was sufficient to promote exon 6B inclusion, whilst knocking-out MBNL1 failed to foster isoform switch.

Conclusions: Our study shows that (i) the tri-cellular cardiac microtissues promote post-natal SCN5A isoform switch in hiPSC-CMs, (ii) adult splicing of SCN5A is driven by MBNL1 in these tissues, and (iii) this model can be used for examining post-natal cardiac arrhythmias due to mutations in the exon 6B.

Translational perspective: The cardiac sodium channel is essential for conducting the electrical impulse in the heart. Postnatal alternative splicing regulation causes mutual exclusive inclusion of fetal or adult exons of the corresponding gene, SCN5A. Typically, immature hiPSCCMs fall short in studying the effect of mutations located in the adult exon. We describe here that an innovative tri-cellular three-dimensional cardiac microtissue culture promotes hiPSC-CMs maturation through upregulation of MBNL1, thus revealing the effect of a pathogenic genetic variant located in the SCN5A adult exon. These results help advancing the use of hiPSC-CMs in studying adult heart disease and for developing personalized medicine applications.

Keywords: SCN5A; cardiac arrhythmias; cardiac microtissue; cardiac sodium channel; human-induced pluripotent stem cell-derived cardiomyocytes.


Conflict of interest statement

Conflict of interest: C.L.M. is co-founder of Ncardia bv.

Figures

Graphical Abstract
Graphical Abstract
hiPSC-CM maturation in 3D cardiac microtissues promotes SCN5A fetal to adult isoform switch.
Figure 1
Figure 1
Generation of hiPSCs from a patient with compound heterozygous mutations in SCN5A and their genetic correction. (A) Top, family tree of the proband (arrow) showing in black filling the patients affected by cardiac conduction defects and in white unaffected individuals. Red (left) and light blue (right) colours within the family tree symbols indicate the genotype at the SCN5A locus, as indicated at the bottom of the figure. Red (top), paternal allele carrying the c.468G>A SCN5A (p.W156X) mutation in exon 4; light blue (bottom), maternal allele carrying the c.673C>T SCN5A (p.R225W) mutation in exon 6B. (B) Schematic representation of the sodium channel Nav1.5 α-subunit, encoded by SCN5A. The red (left) and the light blue (right) circles show the position of p.W156X and p.R225W mutations, respectively. (C) Sanger sequencing chromatograms showing the c.468G>A SCN5A (p.W156X) mutation in exon 4 (left), and the c.673C>T SCN5A (p.R225W) mutation in exon 6B (right), both present in heterozygosis in the patient-derived hiPSCW156X/R225W line. (D) Representative immunofluorescence images of hiPSCW156X/R225W undifferentiated colonies showing expression of pluripotency markers NANOG (red), SSEA4 (green), and POU5F1 (cyan). Bottom panels are an enlargement of the framed area in top panels. Scale bars: 25 µm. (E) Schematic showing the strategy used to correct the c.468G>A (p.W156X) mutation in SCN5A exon 4 with CRISPR/Cas9 in the paternal allele of hiPSCW156X/R225W. The mutant adenine base is shown in red; in yellow the sgRNA guiding the Cas9 to the mutation; in green the ssODN used as donor template for homology-directed DNA repair. Underneath part of the ssODN sequence, showing in green the WT guanine base and in light blue the silent mutations. (F) Sanger sequencing chromatogram showing SCN5A exon 4 after correction of the c.468G>A (W156X) mutation in hiPSCcorr/R225W. The green arrow (second arrow from the left) indicates the corrected patient mutation and the blue arrows indicate the silent mutations inserted in one allele. (G) Representative immunofluorescence staining for ACTN2 (red) and TNNI3 (green) in hiPSCW156X/R225W- and hiPSCcorr/R225W-CMs. Nuclei are stained with Dapi (blue). Panels on the right are enlargement of the framed area in the left panels. Scale bars: 10 µm.
Figure 2
Figure 2
Cardiomyocytes from hiPSCW156X/R225W and hiPSCcorr/R225W show no altered electrical properties due to exon 6B-located p.R225W SCN5A mutation and express mainly the foetal SCN5A isoform. (A) Representative INa traces recorded as indicated in hiPSCcorr/R225W- (black) and hiPSCW156X/R225W- (red) CMs during voltage-clamp activation protocol (test range −80/−15 mV, 22 steps, holding potential = −100 mV). (B) Average activation (AC) and inactivation (IC) curve of INa recorded in hiPSCcorr/R225W- (black; AC: V1/2 = −36.3 ± 0.7 mV, n = 21; IC: V1/2 = −80.9 ± 1 .2 mV, n = 15) and hiPSCW156X/R225W- (red; AC: V1/2 = −35.9 ± 0.4 mV, n = 17; IC: V1/2 = −80.2 ± 0.7 mV, n = 14) CMs. P > 0.05 with Student’s t-test. (C) Mean current–voltage (IV) relationships of INa recorded in hiPSCcorr/R225W (black, n = 23) and hiPSCW156X/R225W (red, n = 21) CMs, showing a reduction in current density in hiPSCW156X/R225W. Experiments >4. *P < 0.05 with two-way ANOVA repeated measures. Data in (B) and (C) are shown as mean ± SEM. (D) Box plot of maximal peak INa density in hiPSCcorr/R225W (black) and hiPSCW156X/R225W (red) CMs. Dots: single values, lines: median, square: mean, error bars: 1.5× inter-quartile range (IQR). *P < 0.05 with Student’s t-test. (E) Representative APs recorded from hiPSCcorr/R225W- (black) and hiPSCW156X/R225W- (red) CMs paced at 1 Hz. Arrows indicate the respective derivative trace of the AP upstroke, showing a smaller peak in hiPSCW156X/R225W which corresponds to a slower Vmax. (F) Box plot of mean Vmax of APs recorded in hiPSCcorr/R225W- (black) and hiPSCW156X/R225W- (red) CMs. Dots, lines, squares and error bars as in (D). n = 13, experiments = 4. *P < 0.05 with Student’s t-test. (G) Representative outcome of the ddPCR assay showing exon 6A (blue) and 6B (green) expression in hiPSCW156X/R225W- and hiPSCcorr/R225W-CMs. Each coloured dot represents a positive droplet for the fluorophore, grey dots represent negative droplets. (H) Top, schematic of the developmentally regulated alternative splicing of SCN5A exon 6: the foetal SCN5A transcript includes exon 6A, whereas the adult SCN5A transcript includes exon 6B. Bottom, bar graph showing the average fraction of SCN5A exon 6A (blue) and 6B (green) expression in 20-day-old hiPSCW156X/R225W- (n = 5) and hiPSCcorr/R225W-CMs (n = 6) compared with foetal heart (FH) and adult heart (AH).
Figure 3
Figure 3
Genetic excision of exon 6A does not increase adult SCN5A isoform expression. (A) Schematic representation of the strategy to excise SCN5A exon 6A using CRISPR/Cas9 with two sgRNAs (sgRNA#1 and #2, orange). In red and light blue, the results of excision (dotted line) in the hiPSCsW156X/R225W: the maternal allele (top, blue, with the mutated T in exon 6B and the A SNP in the intron between exon 5 and exon 6A) carried a 15 bp larger deletion upstream of exon 6A compared with the paternal allele (bottom, red, WT C in exon 6B and G SNP in 5-6A intron). (B) Schematic showing the primers (black arrows) used to amplify and sequencing cDNA from 6A-KO hiPSCcorr/R225W-CMs. (C) Gel electrophoresis of PCR products from (B) showing three bands corresponding to three transcript species as indicated by the arrows. (D) Bar graph of mean expression of exon 6B in unexcised and 6A-KO hiPSC-CMs. Data were normalized to TBP. n = 4. Dots: single values. (E) Representative INa traces recorded from 6A-KO hiPSCcorr/R225W and 6A-KO hiPSCW156X/R225W CMs showing an almost complete absence of the current. (F) Sashimi plots of RNA-seq data from 6A-KO hiPSCcorr/R225W and 6A-KO hiPSCW156X/R225W CMs showing the absence of exon 6A transcription but extensive transcription of the intronic region between exon 5 and exon 6B.
Figure 4
Figure 4
Electrical maturation of hiPSC-CMs in 3D cardiac microtissues with hiPSC-derived non-myocytes reveals functional effects of p.R225W SCN5A mutation. (A) Schematic of the microtissue formation using hiPSC-CMs from four lines (hiPSCcorr/R225W, hiPSCW156X/R225W, hiPSCcorr/corr, hiPSCWT/WT) and ECs and CFs from hiPSCWT/WT. The percentage of each cell type is indicated. (B) Schematic of 21-day MT culture protocol until single-cell dissociation for analysis. (C) Representative INa traces recorded in hiPSCcorr/R225W-, hiPSCW156X/R225W-, hiPSCcorr/corr-, and hiPSCWT/WT-CMs dissociated from MTs, corresponding to the voltage steps reported on the right. In the inset, the current at −40 mV normalized to the peak current, to compare the fraction of open channels around the V1/2 of activation. (D) Activation (AC) and inactivation (IC) curve of INa recorded in hiPSCcorr/R225W- (black; AC: V1/2 = −38.1 ± 1.2 mV; IC: V1/2 = −80.6 ± 1.1 mV; n = 16), hiPSCW156X/R225W- (red; AC: V1/2 = −32.4 ± 1.2 mV*, n = 11; IC: V1/2 = −77.3 ± 1.4 mV, n = 9), hiPSCcorr/corr- (blue; AC: V1/2 = −39.3 ± 0.9 mV, n = 17; IC: V1/2 = −77.9 ± 1.2 mV; n = 16), and hiPSCWT/WT- (light blue; AC: V1/2 = −36.5 ± 0.9 mV, n = 8; IC: V1/2 = −80.8 ± 1.3 mV, n = 7) CMs showing a rightward shift in INa activation in hiPSCW156X/R225W-CMs. *P < 0.05 vs. the other lines with one-way ANOVA and Fisher’s post hoc test. Experiments = 3. (E) Mean voltage-density plot of INa recorded in hiPSCcorr/R225W- (black), hiPSCW156X/R225W- (red), hiPSCcorr/corr- (blue), and hiPSCWT/WT- (light blue) CMs, showing a reduction in current density in hiPSCW156X/R225W- and hiPSCcorr/R225W-CMs compared with the corrected and WT line and a shift in the activation of hiPSCW156X/R225W-CMs. From −45 to −20 mV: P < 0.05 for hiPSCW156X/R225W and for hiPSCcorr/corr vs. the other lines with two-way ANOVA repeated measures. Experiments = 3. (F) Representative AP traces recorded with dynamic clamp from hiPSCcorr/R225W- (black), hiPSCW156X/R225W- (red), hiPSCcorr/corr- (blue), and hiPSCWT/WT- (light blue) CMs paced at 1 Hz. The inset indicates the respective derivative trace of the AP after the stimulus. (G) Box plot of mean Vmax of APs recorded in hiPSCcorr/R225W- (black, n = 23), hiPSCW156X/R225W- (red, n = 22), hiPSCcorr/corr- (blue, n = 17), and hiPSCWT/WT- (light blue, n = 20) CMs. Dots: single values, lines: median, squares: mean, error bars: 1.5× IQR. *P < 0.05 vs. the other lines with one-way ANOVA and Fisher’s post hoc test. Experiments = 4.
Figure 5
Figure 5
SCN5A exon 6B expression is increased in MTs compared with monolayer hiPSC-CMs. (A) Representative outcome of the ddPCR assay showing exon 6A (blue) and 6B (green) expression in hiPSCW156X/R225W-, hiPSCcorr/R225W-, and hiPSCWT/WT-CMs. (B) Bar graph of the average fraction of SCN5A exon 6A and 6B expression in hiPSCW156X/R225W-, hiPSCcorr/R225W- and hiPSCWT/WT-MTs (n = 3). (C) Plot showing the fraction of SCN5A exon 6B expression in monolayer (2D) hiPSC-CMs compared with MTs for hiPSCcorr/R225W (black) and hiPSCW156X/R225W (red), indicating a strong increase of the relative expression of exon 6B in MTs. (D) Sashimi plots of RNA-seq data from 2D hiPSC-CMs and MTs for hiPSCcorr/R225W and hiPSCW156X/R225W showing increased expression of SCN5A exon 6B in MTs in both lines. (E) Bar graphs from RNA-seq data (TPM) from hiPSCcorr/R225W (left, black) and hiPSCW156X/R225W (right, red) showing increased expression of SCN5A and higher fraction of exon 6B-including transcripts in MTs compared with 2D hiPSC-CMs.
Figure 6
Figure 6
MBNL1 is up-regulated in MTs and promotes exon 6B expression. (A) Sashimi plots of RNA-seq data from 2D hiPSC-CMs and MTs for hiPSCcorr/R225W and hiPSCW156X/R225W showing decreased expression of MBNL1 exon 6 in MTs in both lines. (B) Bar graphs showing expression based on RNA-seq data (TPM) from 2D CMs and MTs from hiPSCcorr/R225W (left, black) and hiPSCW156X/R225W (right, red); MBNL1 was up-regulated and a lower fraction of exon 5-including transcripts (purple) in MTs compared with 2D hiPSC-CMs. (C) FACS analysis showing the percentage of eGFP-expressing cells (MBNL1-eGFP+) in untransfected (grey) and MBNL1-transfected (green) hiPSC-CMs. (D) MBNL1 expression analysis by qPCR in 2D CMs, MBNL1-transfected CMs, MBNL1-KO 2D CMs, MTs, and MBNL1-KO MTs. *P < 0.05, One-way ANOVA compared with 2D CMs. n > 3. Dots: single values. (E) Fraction of exon 6A (blue) and exon 6B (green) SCN5A analysed by ddPCR in the cells from (C), as indicated. n > 3.

References

    1. Giacomelli E, Mummery CL, Bellin M. Human heart disease: lessons from human pluripotent stem cell-derived cardiomyocytes. Cell Mol Life Sci 2017;74:3711–3739. - PMC - PubMed
    1. van den Berg CW, Elliott DA, Braam SR, Mummery CL, Davis RP. Differentiation of human pluripotent stem cells to cardiomyocytes under defined conditions. Methods Mol Biol 2016;1353:163–180. - PubMed
    1. Nijak A, Saenen J, Labro AJ, Schepers D, Loeys BL, Alaerts M. iPSC-cardiomyocyte models of Brugada syndrome—achievements, challenges and future perspectives. Int J Mol Sci 2021;22:2825. - PMC - PubMed
    1. Garg P, Garg V, Shrestha R, Sanguinetti MC, Kamp TJ, Wu JC. Human induced pluripotent stem cell-derived cardiomyocytes as models for cardiac channelopathies: a primer for non-electrophysiologists. Cir Res 2018;123:224–243. - PMC - PubMed
    1. Wilde AAM, Amin AS. Clinical spectrum of SCN5A mutations: long QT syndrome, Brugada syndrome, and cardiomyopathy. JACC Clin Electrophysiol 2018;4:569–579. - PubMed

Publication types

MeSH terms