Review
. 2022 Apr 8;13(1):68.
doi: 10.1186/s13244-022-01190-y.

Role of the radiologist in the diagnosis and management of the two forms of hepatic echinococcosis

Affiliations
Review

Role of the radiologist in the diagnosis and management of the two forms of hepatic echinococcosis

Paul Calame et al. Insights Imaging. .

Abstract

Echinococcosis is a parasitic disease caused by two zoonotic tapeworms (cestodes) of the Echinocococcus genus. It can be classified as either alveolar or cystic echinococcosis. Although the two forms differ significantly in terms of imaging findings, they share similarities in terms of management and treatment. In parallel to medical treatment with albendazole (ABZ), and surgery, historically used in these diseases, various imaging-guided interventional procedures have recently emerged (drainage, stenting, or Puncture, aspiration, injection, and reaspiration (PAIR)). These options open up a new range of therapeutic options. As in oncology, multidisciplinary consultation meetings now play a major role in adapted management and patient care in hepatic echinococcosis. Consequently, diagnostic imaging and interventional expertise have brought radiologists to the fore as important members of these multidisciplinary team. The radiologist will need to evaluate parasite activity in both forms of the disease, to guide the choice of the appropriate therapy from among medical treatment, interventional radiology procedures and/or surgical treatment. Knowledge of the specific complications of the two forms of echinococcosis will also help radiologists to discuss the appropriate treatment and management. The aim of this review is to describe the core knowledge that what a radiologist should possess to actively participate in multidisciplinary meetings about hepatic echinococcosis. We discuss the role of imaging, from diagnosis to treatment, in alveolar (AE) and cystic echinococcosis (CE), respectively.

Keywords: Alveolar echinococcosis; Cystic Echinococcosis; Diagnostic imaging; Echinococcosis; Radiologists; Radiology (Interventional).


Conflict of interest statement

The authors declare that they have no competing interests.

Figures
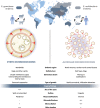
Fig. 1
Fig. 1
Figure representing type of growth, main demographic and imaging findings of cystic (CE) and alveolar echinococcosis (AE)
Fig. 2
Fig. 2
Role of imaging in the positive diagnosis of CE and AE. †First-line tests generally comprise EgHF-ELISA or indirect hemagglutination. The confirmation test in combination with the Em2-and rec-Em18-ELISA enables diagnosis with sensitivity of almost 100%. ‡ Western blotting is the more specific test, used as a confirmatory test in addition to ELISA and IHA (sensitivity varies according to CE stage)
Fig. 3
Fig. 3
Schematic structure of a cystic echinococcosis cyst
Fig. 4
Fig. 4
Incidental alveolar echinococcosis discovered in a 65-year-old man with a recent history of acute myeloid leukemia, and presenting with liver blood test abnormalities. A. Abdominal ultrasound showing heterogeneous echogenic mass with irregular borders. B. Contrast-enhanced ultrasound showing the absence of enhancement of the liver lesion (arrowheads). C. T2-weighted MR images in the axial plane showing pathognomonic microcysts (arrowheads)
Fig. 5
Fig. 5
Overall correlations of right liver alveolar echinococcosis in a 54-year-old women. A Photograph of gross specimen after right hepatectomy showing multiples microcysts with honeycomb aspect. B T2-weighted MR image in the axial plane showing typical microcysts in correlation with gross specimen (arrows; Kodama 2). C FDG-PET/CT scan showing active parasitic lesion with increased FDG-uptake at the periphery of the lesion. D Correlation with diffusion-weighted imaging showing peripheral hypersignal of AE lesion with low ADC values
Fig. 6
Fig. 6
Large alveolar echinococcosis lesion of the right liver in a 34-year-old man diagnosed with jaundice. A CT image in the axial plane obtained at portal phase of enhancement showing alveolar echinococcosis of the right liver (arrow) associated with infiltration up to the right pedicle (arrowheads) and the biliary convergence. B Coronal T2-weighted MR images. Multiple microcysts (arrowheads) with biliary convergence involvement leading to biliary dilation in the left lobe (arrow). C Cholangiography images. Percutaneous biliary drainage to achieve regression of jaundice in preparation for liver surgery
Fig. 7
Fig. 7
Alveolar echinococcosis in a 57 year old man with an initial suspicion of gallbladder carcinoma. A CT images in the axial plane obtained during the portal phase of enhancement: infiltrative hypodense liver lesion with calcifications infiltrating the gallbladder (arrow). B Fat-suppressed T1-weighted sequence in the axial plane showing hypointensity of the liver lesion. C T2-weighted fat-suppressed MR image in the axial plane showing typical microcysts within hypointense T2 lesions (arrowheads). D Diffusion-weighted imaging showing suppressed hyperintensity on b800 corresponding to high ADC values
Fig. 8
Fig. 8
Atypical CT findings of alveolar echinococcosis in a 65-year-old woman with a recent diagnosis of lymphoma. A CT image in the axial plane showing two aspecific hypodense liver lesions of the left liver (arrows). B T2-weighted fat-suppressed MR image in the axial plane showing typical microcysts within hypointense T2 lesions (arrows; Kodama 2)
Fig. 9
Fig. 9
Alveolar echinococcosis lesion of the left liver lobe in 56-year-old woman. Assessment of parasitic activity on MRI and FDG-PET/CT scan. A T2-weighted MR image in the axial plane. AE lesion in mixed T2 hypo- and hypersignal, with peripheral microcysts (arrowheads). B Diffusion-weighted imaging showing peripheral hypersignal of AE lesion. C Correlation with FDG-PET/CT scan. Increased FDG-uptake at the periphery of the lesion
Fig. 10
Fig. 10
Alveolar echinococcosis lesion of the right liver in a 49-year-old woman discovered due to left leg edema. A CT image in the coronal plane at the portal phase showing alveolar echinococcosis of the right liver (arrow) associated with invasion of the inferior vena cava, responsible for thrombosis, extending to the common iliac veins (arrowheads). B CT image in the coronal plane obtained during the portal phase: infiltration to the pedicle and biliary convergence (arrows) and biliary dilatation of the left lobe (arrowheads). C CT image in the axial plane obtained during the portal phase showing portal cavernoma of the liver pedicle secondary to hilar alveolar echinococcosis infiltration. D Same examination, soft tissue window: calcified lung nodules (arrowheads). Hypertrophy of the azygos vein secondary to inferior vena cava thrombosis (arrow). E Same examination, lung window: calcified lung nodules (arrowheads)
Fig. 11
Fig. 11
Alveolar echinococcosis lesion of the right liver in a 44-year-old man complicated by advanced chronic liver disease secondary to Budd Chiari syndrome. A CT image in the coronal plane at the portal phase showing alveolar echinococcosis of the right liver (arrow) associated with infiltration to the pedicle (arrowheads). B CT image in the axial plane obtained during the portal phase: invasion of the inferior vena cava and the ostium of the hepatic veins (arrowheads). C CT image in the axial plane obtained during the portal phase: infiltration of the right liver pedicle (arrowheads) D. Hypertrophy of the left liver lobe and surface nodularity suggestive of advanced fibrosis. Note the mosaic pattern of enhancement, sign of hepatic sinusoidal dilatation, as a result of the Budd Chari syndrome
Fig. 12
Fig. 12
Left lobe cystic echinococcosis lesion in a 43-year-old woman revealed by abdominal pain associated with fever. A CT image in the axial plane obtained during the portal phase of enhancement showing peritoneal rupture of left lobe CE lesion (arrowheads). Peritoneal effusion contiguous to the anterior surface of the left lobe CE lesion. B T2-weighted fat-suppressed MR image in the axial plane showed internal detached membrane (water lily sign, arrowheads) of the left lobe lesion, diagnosing a transitional stage of CE (CE3a). Second CE lesion CE1 (arrow). C Correlation with macroscopic findings. Internal membrane of the CE3a cyst (arrows)
Fig. 13
Fig. 13
Large cystic echinococcosis lesion of the right liver in a 54-year-old woman revealed by ascitic decompensation. A CT image in the axial plane at the portal phase showing a large cystic echnicoccosis lesion of the right liver. Internal daughter cysts (arrowheads) (CE3a stage). B CT image in the axial plane at the portal phase showing a large right liver cyst complicated by advanced chronic liver disease secondary to Budd Chiari syndrome. Hypertrophy of the left liver lobe and surface nodularity suggestive of advanced fibrosis. C Same examination in the coronal plane. Mass effect of the cystic echinococcosis on the heart chambers (arrowheads). D Same examination in the axial plane, lower slices. Portal thrombosis (arrow) and ascites (star)
Fig. 14
Fig. 14
Differential diagnosis of a cystic echinococcosis lesion in a 78-year-old woman. A Unenhanced CT image in the axial plane showing a right liver cyst. B CT image in the axial plane at the portal phase showing a cystic lesion of the right liver with thickening wall. C T2-weighted MR image in the axial plane showing heterogeneous content without daughter cysts. D T1-weighted MR image in the axial plane showing hyperintense signal of the liver cyst confirming the diagnosis of hemorrhagic liver cyst
Fig. 15
Fig. 15
Differential diagnosis of cystic echinococcosis lesion in a 64-year-old woman. A CT image in the axial plane at the portal phase showing a large right liver cyst. B Same examination, lower slices. Internal enhanced septa. C CT image in the sagittal plane at the portal phase showing internal enhanced septa ruled out a cystic echinococcosis lesion, confirming the diagnosis of biliary mucinous cystadenoma
Fig. 16
Fig. 16
Cystic echinococcosis lesion CE4 with negative result on serology test. A CT image in the coronal plane obtained during the portal phase of enhancement: CE lesion of the right lobe with calcified membrane, leads to complementary exploration in MRI and US to assess activity. Note the macroscopic fat content (arrow). B T2-weighted MR image in the axial plane showing low signal in T2 and absence of daughter cysts (arrowheads). C B-mode ultrasound: echogenic structure of the CE lesion, without daughter cyst. Lesion classified as CE4
Fig. 17
Fig. 17
Cystic echinococcosis lesion CE3b of the right liver lobe in a 44-year-old man. A T2-weighted MR image in the axial plane: loss of continuity of the cyst wall and visualization of daughter cyst into the biliary duct (arrow). B Corresponding images on CT obtained during the portal phase of enhancement. C MRCP in the coronal plane: direct communication between the cyst and the biliary duct (arrow). D Corresponding images on CT obtained during the portal phase of enhancement: direct communication between the cyst and the biliary duct (arrowheads)
Fig. 18
Fig. 18
Large cystic echinococcosis lesion of the left liver at CE3b stage discovered during an investigation of abdominal pain. A T2-weighted MR image in the coronal plane: loss of continuity of the cyst wall (arrowheads) in contact with the gastric antrum. B CT image in the axial plane obtained during the portal phase of enhancement: close contact between the cyst wall and the gastric antrum (arrow). C CT image in the axial plane obtained during the portal phase in a context of fever and abdominal pain 3 months after the start of anti-parasitic treatment. Appearance of digestive content and air-fluid level within the CE lesion. Direct communication between the cyst and the gastric antrum (arrow). D Same lesion in T2-weighted MR image in the axial plane. Note the emptying of most daughter cysts, a sign of evacuation in the digestive tract
Fig. 19
Fig. 19
Cystic echinococcosis lesion CE3b in a 48-year-old patient revealed by abdominal pain, fever, and liver blood test abnormalities. A Fat-suppressed T2-weighted MR image in the axial plane shows a cystic lesion of the right liver, including daughter cysts with floating membranes. Biliary compression without fistula can be observed (arrow). B Fat-suppressed T2-weighted MR image in the axial plane. Posterior rupture of the cystic echinococcosis (arrow). C Fat-suppressed T1-weighted sequence in the axial plane shown after gadolinium injection at the portal phase. Parietal enhancement of cystic echinococcosis that suggests infection of parasitic lesion (arrowheads)

References

    1. McManus DP, Zhang W, Li J, Bartley PB. Echinococcosis. Lancet. 2003;362:1295–1304. doi: 10.1016/S0140-6736(03)14573-4. - DOI - PubMed
    1. Eckert J, Deplazes P. Biological, epidemiological, and clinical aspects of echinococcosis, a zoonosis of increasing concern. Clin Microbiol Rev. 2004;17:107–135. doi: 10.1128/CMR.17.1.107-135.2004. - DOI - PMC - PubMed
    1. Bulakçı M, Kartal MG, Yılmaz S, et al. Multimodality imaging in diagnosis and management of alveolar echinococcosis: an update. Diagn Interv Radiol. 2016;22:247–256. doi: 10.5152/dir.2015.15456. - DOI - PMC - PubMed
    1. Bresson-Hadni S, Delabrousse E, Blagosklonov O, et al. Imaging aspects and non-surgical interventional treatment in human alveolar echinococcosis. Parasitol Int. 2006;55(Suppl):S267–272. doi: 10.1016/j.parint.2005.11.053. - DOI - PubMed
    1. Wen H, Vuitton L, Tuxun T, et al. Echinococcosis: advances in the 21st century. Clin Microbiol Rev. 2019 doi: 10.1128/CMR.00075-18. - DOI - PMC - PubMed