. 2022 Apr 8:11:e72811.
doi: 10.7554/eLife.72811.

Efficient differentiation of human primordial germ cells through geometric control reveals a key role for Nodal signaling

Affiliations

Efficient differentiation of human primordial germ cells through geometric control reveals a key role for Nodal signaling

Kyoung Jo et al. Elife. .

Abstract

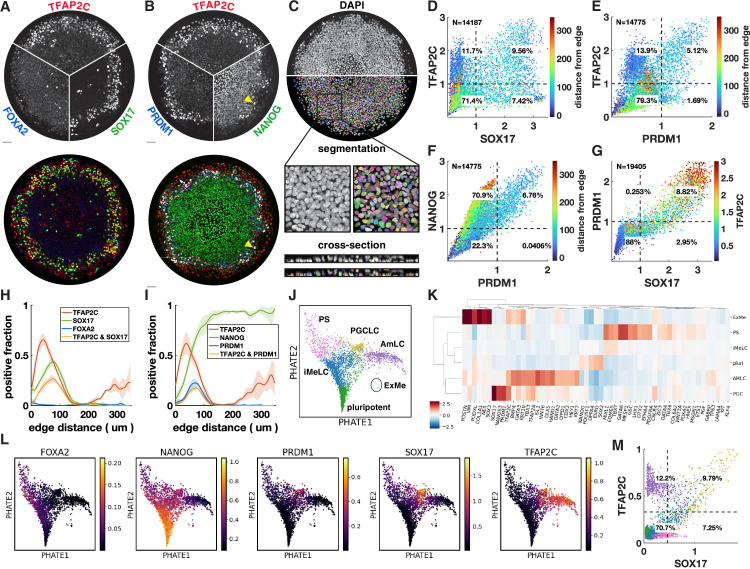
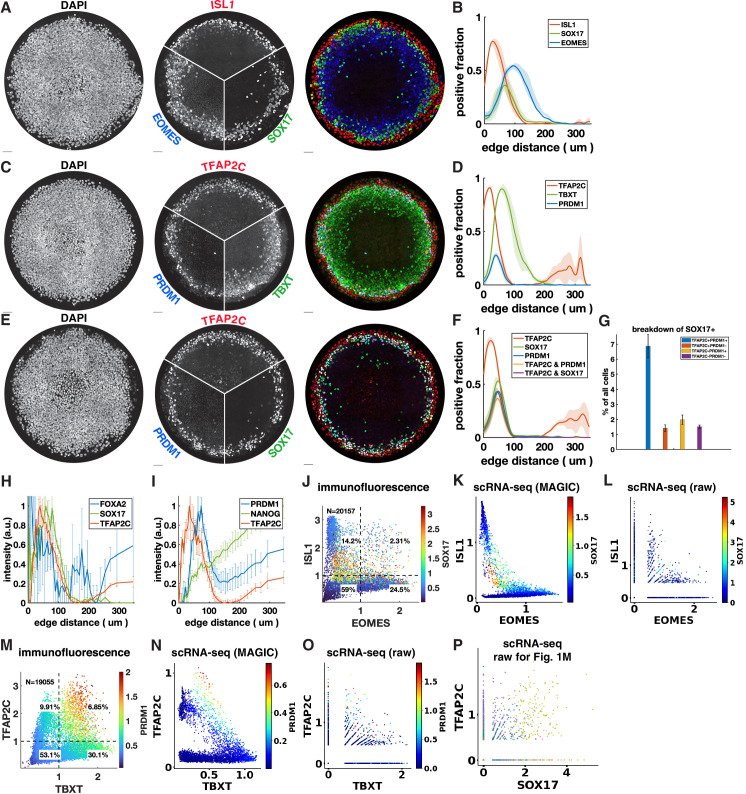
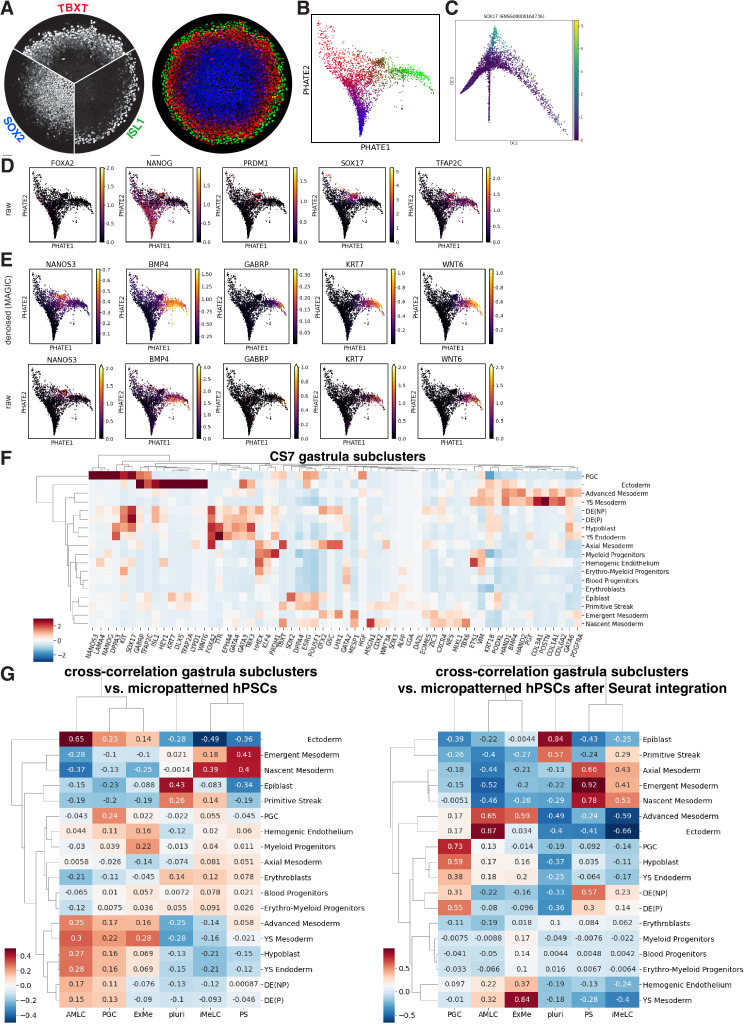
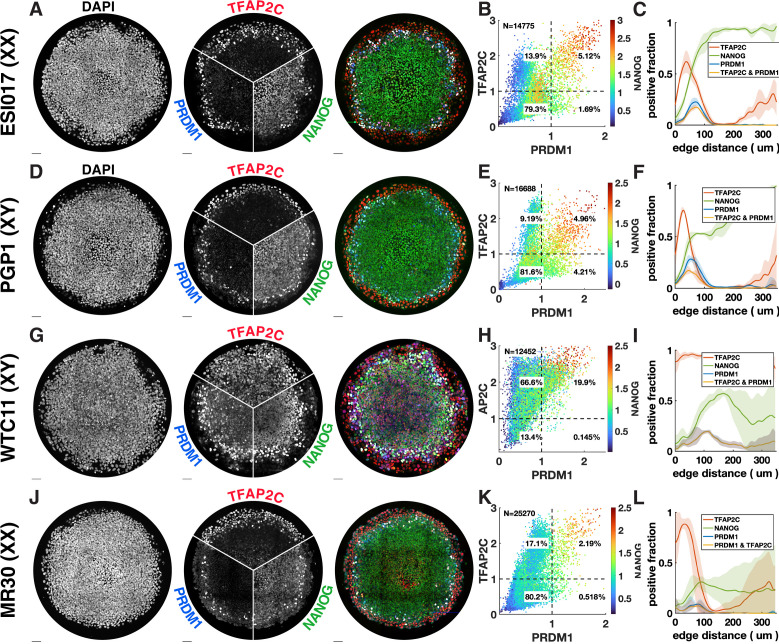
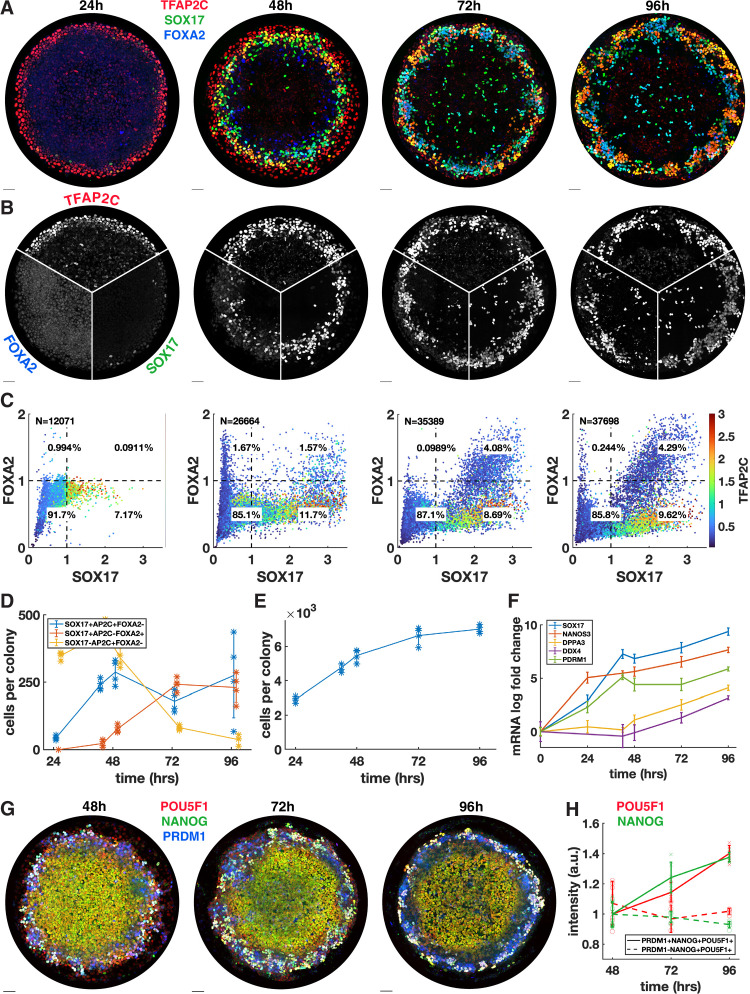
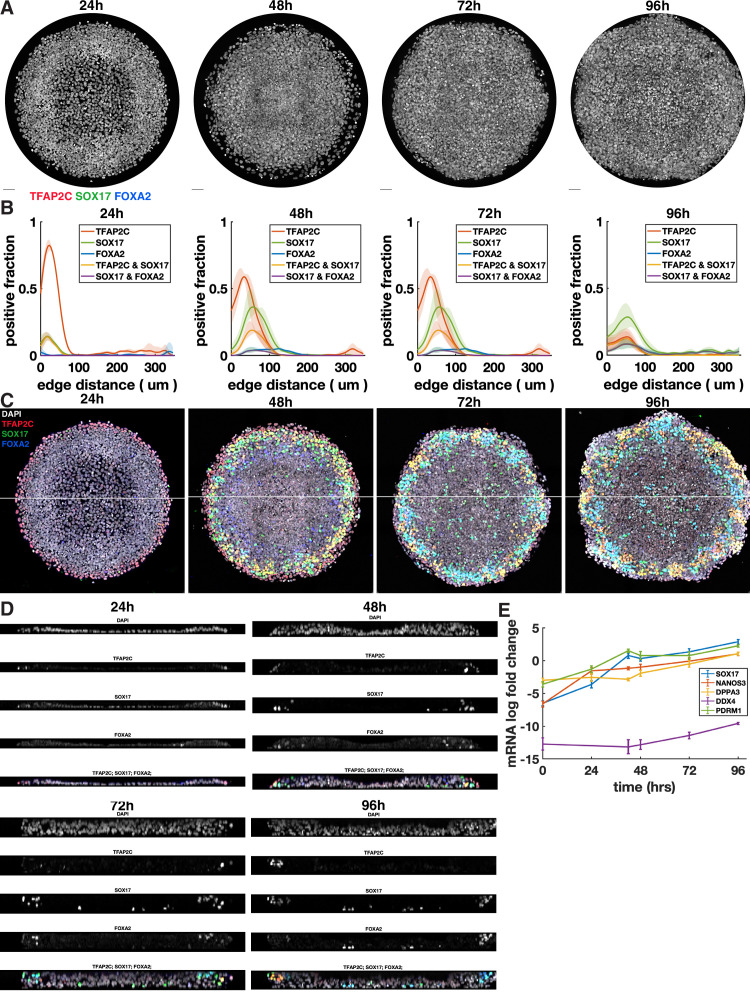
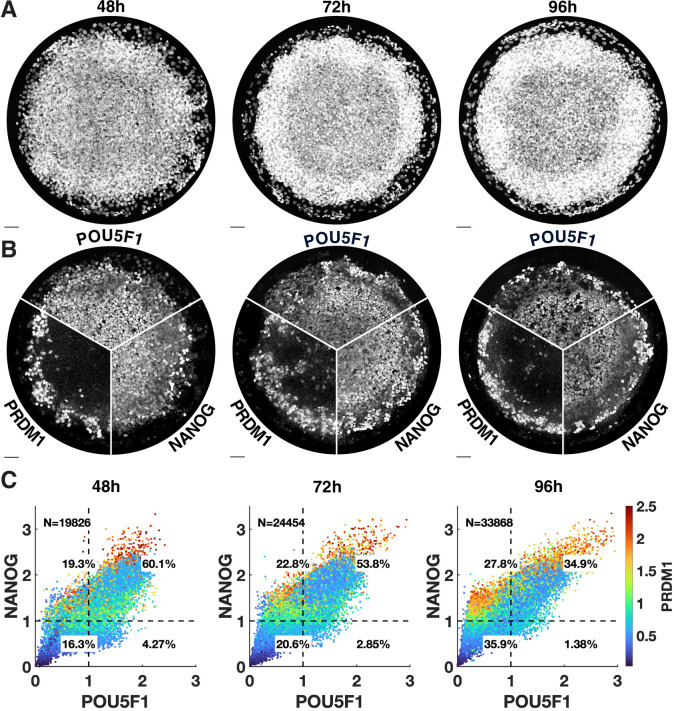
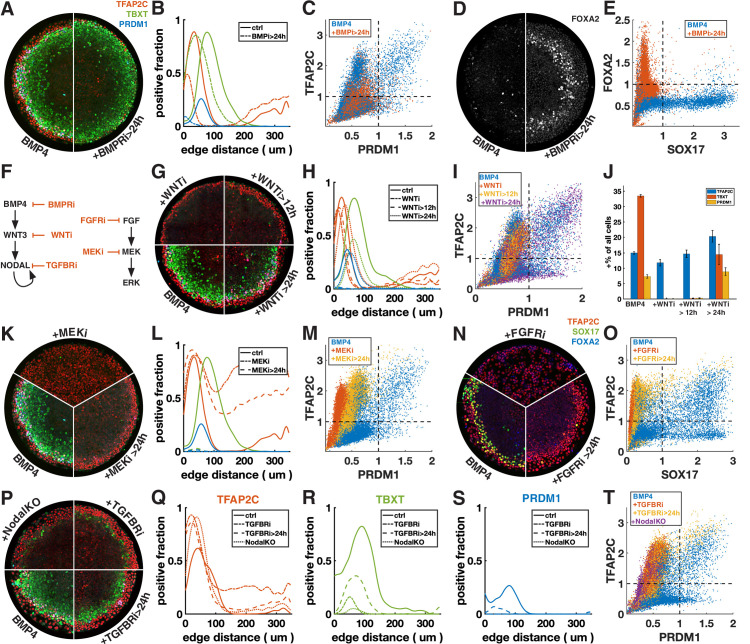
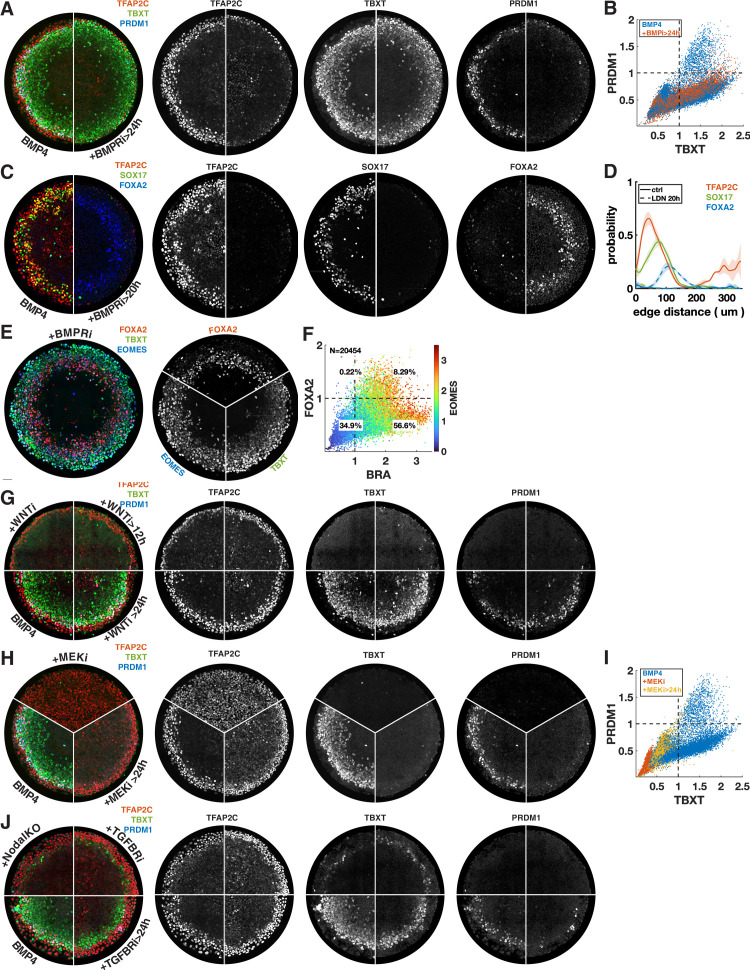
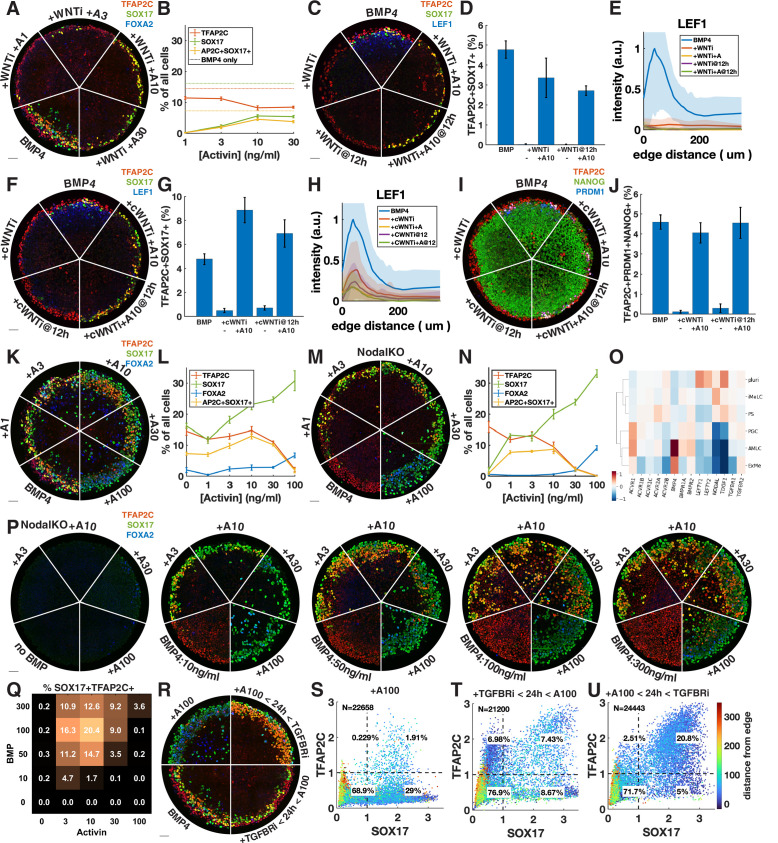
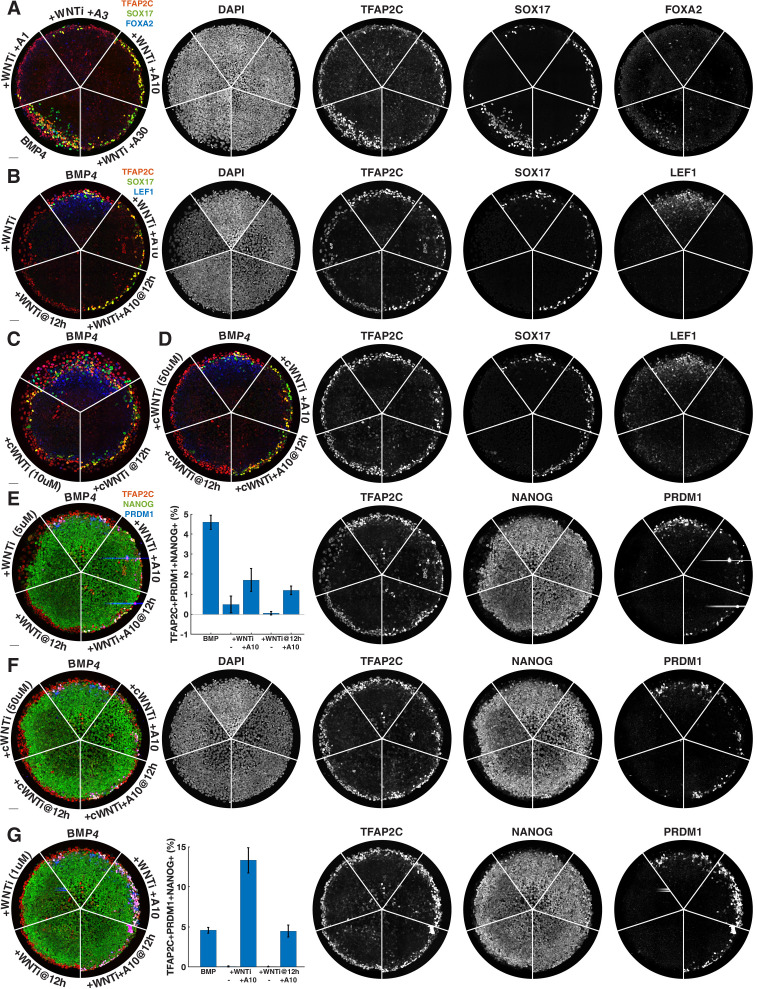
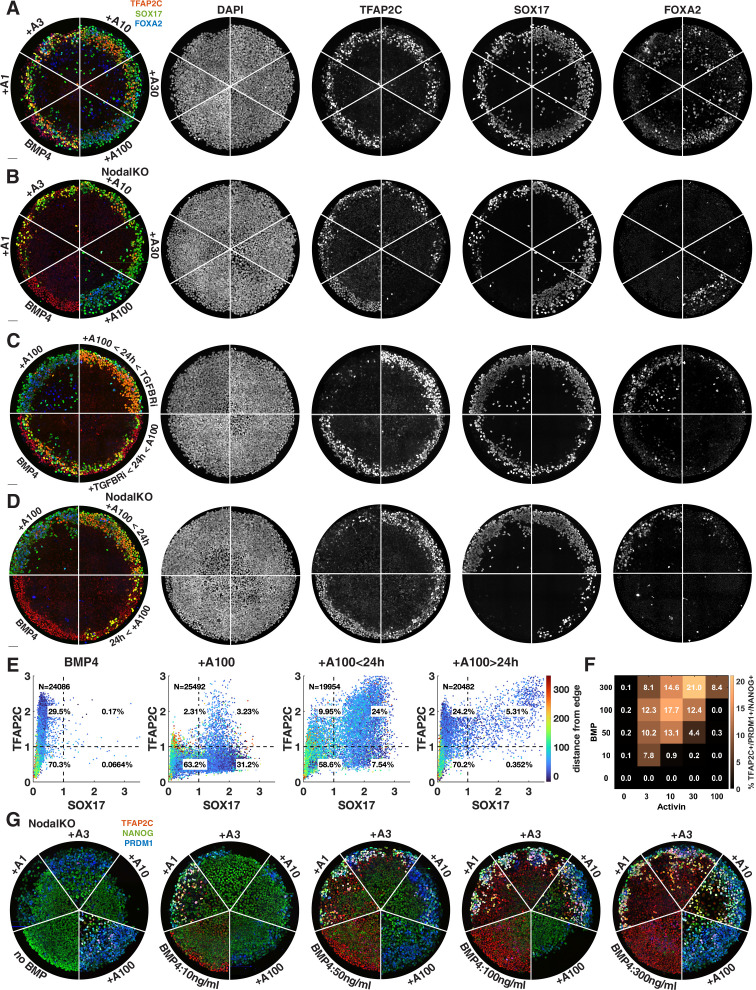
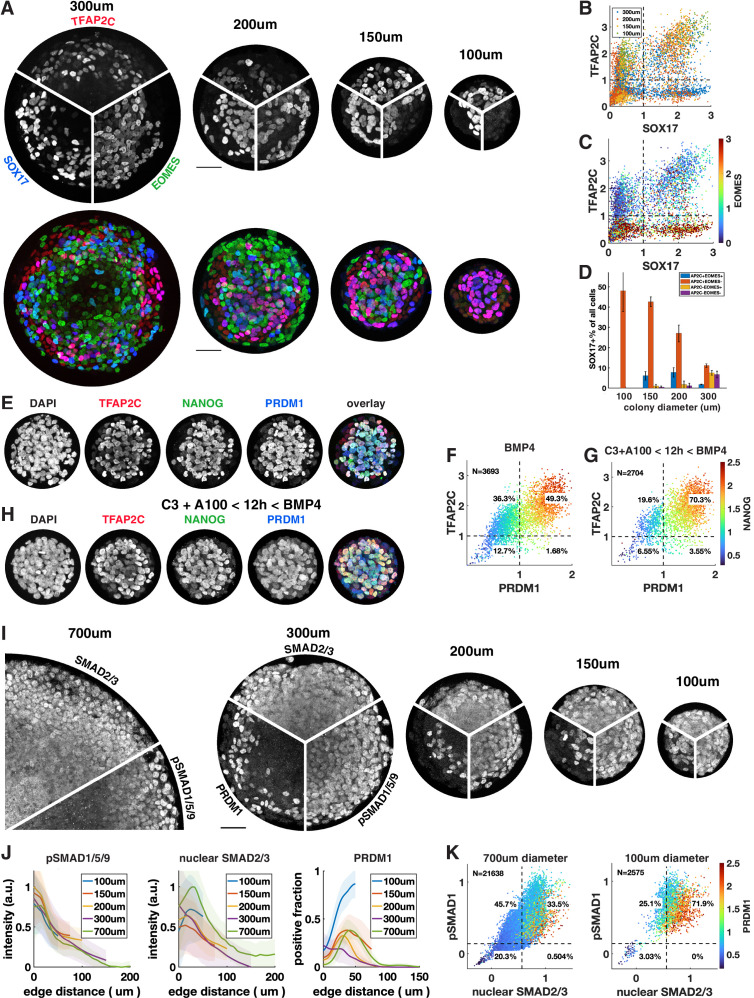
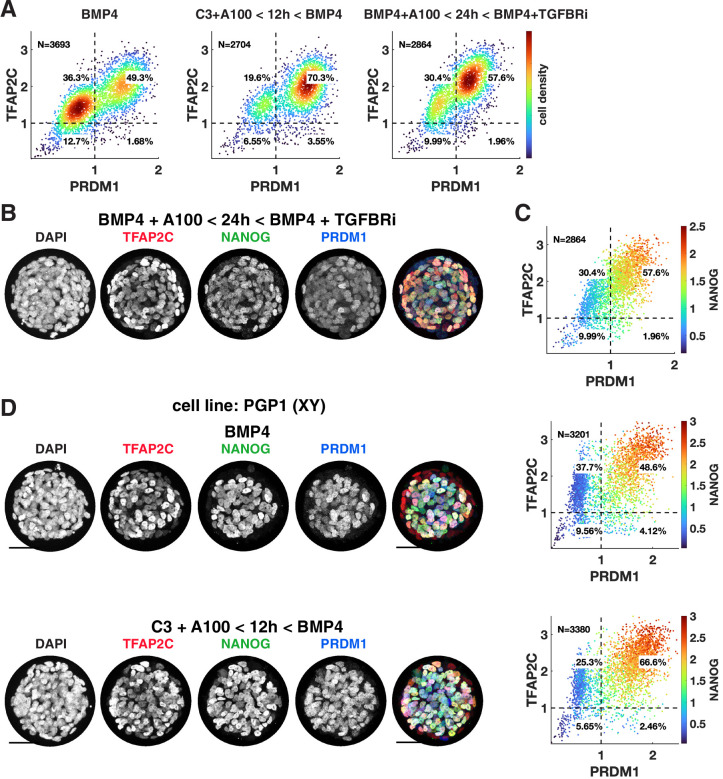
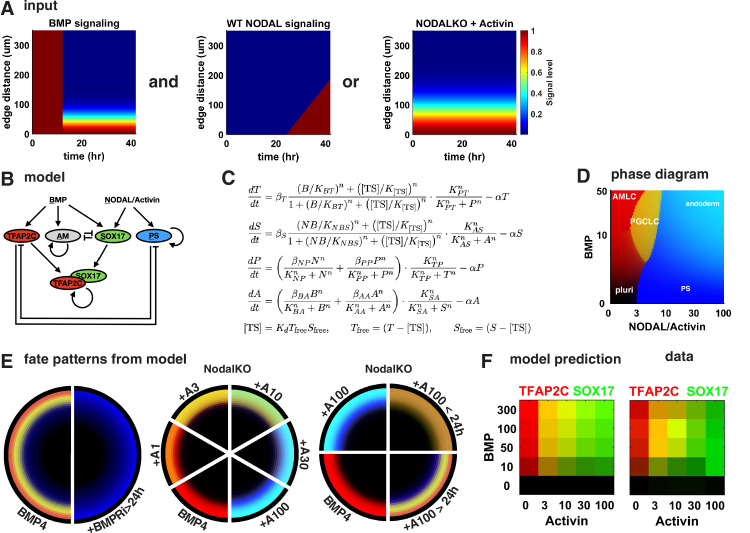
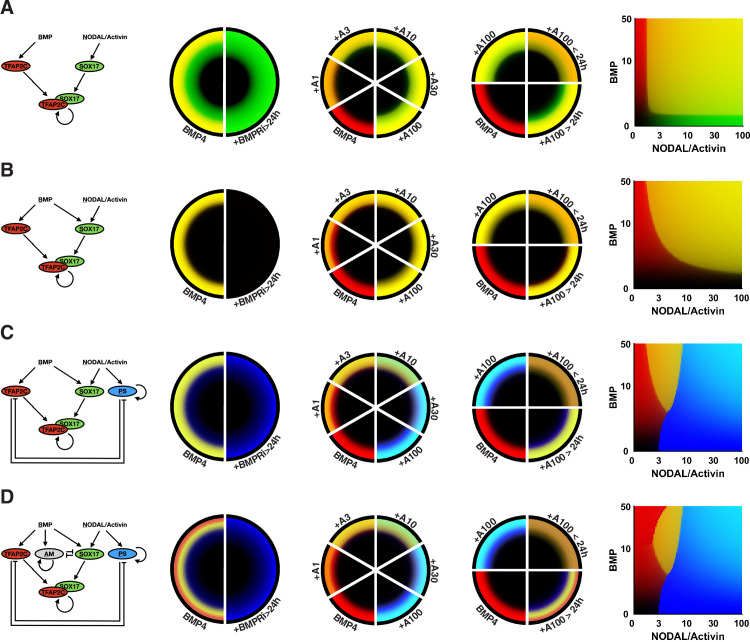
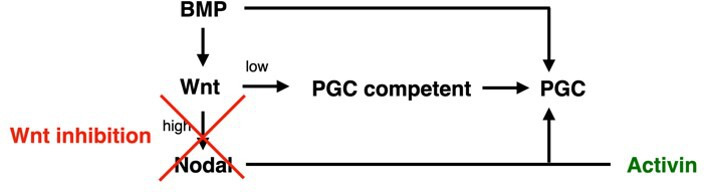
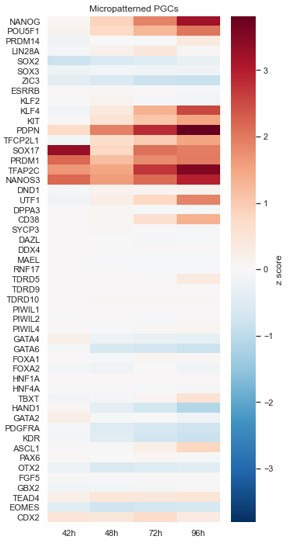
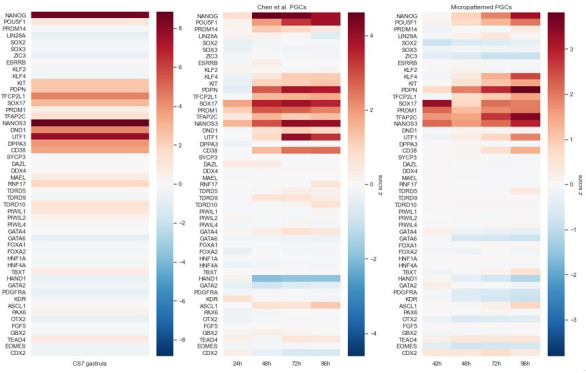
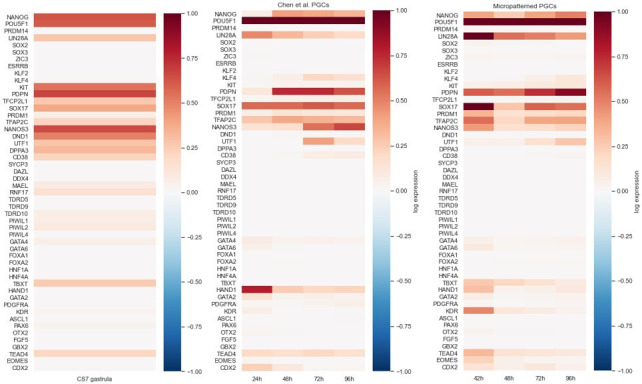
Human primordial germ cells (hPGCs) form around the time of implantation and are the precursors of eggs and sperm. Many aspects of hPGC specification remain poorly understood because of the inaccessibility of the early postimplantation human embryo for study. Here, we show that micropatterned human pluripotent stem cells (hPSCs) treated with BMP4 give rise to hPGC-like cells (hPGCLC) and use these as a quantitatively reproducible and simple in vitro model to interrogate this important developmental event. We characterize micropatterned hPSCs up to 96 hr and show that hPGCLC populations are stable and continue to mature. By perturbing signaling during hPGCLC differentiation, we identify a previously unappreciated role for Nodal signaling and find that the relative timing and duration of BMP and Nodal signaling are critical parameters controlling the number of hPGCLCs. We formulate a mathematical model for a network of cross-repressive fates driven by Nodal and BMP signaling, which predicts the measured fate patterns after signaling perturbations. Finally, we show that hPSC colony size dictates the efficiency of hPGCLC specification, which led us to dramatically improve the efficiency of hPGCLC differentiation.

Keywords: cell fate patterning; cell signaling; computational biology; developmental biology; human; human pluripotent stem cells; micropatterning; primordial germ cells; systems biology.

Plain language summary

In humans and other animals, eggs and sperm are unique cells that pass on genetic material to the next generation. They originate from a small group of cells called primordial germ cells that form early in life in the developing embryo. Several different signal molecules including ones known as BMP4, Wnt, and Nodal, instruct certain cells in the embryo to become primordial germ cells. The process by which primordial germ cells are made in humans is very different to how primordial germ cells are made in mice and other so-called model animals that are commonly used in research. This has made it more challenging to uncover the details of the process in humans. Fortunately, new methods have recently been created that mimic aspects of how human embryos develop using human stem cells in a laboratory dish, providing an opportunity to gain a deeper understanding of how human germ cells form. Jo et al. used a technique called micropatterning to control the shape and size of groups of human stem cells growing in a laboratory dish. Treating these cells with a signal known as BMP4 gave rise to cells that resembled primordial germ cells. The team then used this system as a model to study how primordial germ cells form in humans. The experiments found that reducing Wnt signals in stem cells stopped primordial germ cells from forming in response to BMP4, confirming that Wnt signals made by the cells in response to BMP4 are essential. However, this block was overcome by providing the stem cells with another signal called Nodal. This suggests that the role of Wnt signaling in primordial germ cell formation is in part indirect by switching on Nodal in stem cells. Defects in eggs and sperm may lead to infertility, therefore, the findings of Jo et al. have the potential to help researchers develop new fertility treatments that use eggs or sperm grown in a laboratory from the patients’ own stem cells. Such research would benefit from first developing a better understanding of how to make primordial germ cells.


Conflict of interest statement

KJ, ST, BC, HK, EF, HL, BL, RR, JS, IH No competing interests declared

Figures

Figure 1.
Figure 1.. Primordial germ cell-like cells (PGCLCs) form at the interface between extraembryonic and primitive streak-like cells.
(A, B) Immunofluorescence for different marker genes (maximal intensity projection along z). Yellow arrowhead in (B) points to higher NANOG expression in PGCLCs than pluripotent cells in the colony center. (C) Segmentation of nuclei based on DAPI staining. (D–F) Scatterplots of marker expression colored for radial position, normalized to threshold and log(1 + x) transformed, (D) corresponds to (A); (E, F) correspond to (B). (G) Scatterplot of PRDM1 vs. SOX17 colored for TFAP2C. (H, I) Spatial distribution of positive cells, dark lines represent the mean kernel density estimate of the positive fraction over four colonies, colored bands represent the standard deviation. (J) Clusters generated by Louvain. (K) Heatmap of differential expression between clusters (average z-scores) of genes associated with gastrulation. (I) PHATE visualization of scRNA-seq data showing denoised expression of markers used in (BI) (raw in Figure 1—figure supplement 2D). (M) Scatterplot of TFAP2C vs. SOX17 from denoised scRNA-seq data (raw in Figure 1—figure supplement 1P), with colors matching clusters in (J). Scale bars 50 µm. All colonies are 700 µm diameter.
Figure 1—figure supplement 1.
Figure 1—figure supplement 1.. Quantitative relationships between marker genes with immunofluorescence (IF) and scRNA-seq.
(A–F) Additional stainings of micropatterned colonies and spatial distribution of positive cells. (G) Breakdown of cell populations corresponding to Figure 1G and (E, F). (H, I) Normalized radial intensity profiles corresponding to Figure 1A and B. (J–L) Scatterplots comparing the relationship between ISL1, EOMES, SOX17 measured with IF (K) and denoised (K) vs. raw (L) scRNA-seq. (M–O) Scatterplots comparing the relationship between TFAP2C, TBXT, PRDM1 measured with IF (M) and denoised (N) vs. raw (O) scRNA-seq. (P) Scatterplot of TFAP2C vs. SOX17 from scRNA-seq data before denoising with MAGIC, compare with Figure 1M.
Figure 1—figure supplement 2.
Figure 1—figure supplement 2.. Additional scRNA-seq analysis, including correlation with CS7 human gastrula.
(A, B) Comparison of immunofluorescence (IF) for ISL1, TBXT, SOX2 with their expression on the PHATE visualization of the scRNA-seq data. (C) Primordial germ cells (PGCs) budding off as a lineage along diffusion component 3. (D) Visualization of raw expression corresponding to (L). (E) Expression of amnion and PGC markers on PHATE visualization with and without denoising. (F) Differential expression of gastrula markers from (K) in subclusters of CS7 human gastrula from Tyser et al. (G) Correlation of highly variable genes between the clusters from micropatterned human pluripotent stem cells (hPSCs) and clusters from human gastrula with and without integration using Seurat.
Figure 1—figure supplement 3.
Figure 1—figure supplement 3.. Primordial germ cell-like cell (PGCLC) differentiation in different male and female cell lines.
Each row shows immunofluorescence (IF) and quantification for PGC markers in different cell lines. (A–C) ESI017, also shown in Figure 1B, shown here for comparison. (E–F) PGP1, male induced pluripotent stem cell (iPSC). (G–I) WTC11, male iPSC. (J–L) MR30, female iPSC. WTC11, a widely used iPSC line deviates from the norm. It consistently expresses TFAP2C throughout the colony and gives rise to higher numbers of PGCLCs.
Figure 2.
Figure 2.. Primordial germ cells (PGCs) are specified by 42 hr but continue to mature while endoderm arises between 42 and 72 hr.
(A, B) Immunofluorescence over time showing a stable PGC population and later emergence of endoderm. (C) Quantification of marker expression at different times showing the emergence of endoderm starting at 48 hr. (D) Absolute numbers of cell-expressing marker combinations corresponding to endoderm (red, SOX17+ AP2C-FOXA2+) primordial germ cell-like cells (PGCLCs) (blue, SOX17+ AP2C+ FOXA2-) and SOX17-AP2C+ FOXA2- (yellow). (E) Average cell number per colony over time. (F) qPCR data for PGC markers over time. (G, H) Immunofluorescence and quantification of pluripotency markers in PGCs over time. DAPI stainings corresponding to (A, B) are shown in Figure 2—figure supplement 1. Scale bar 50 µm.
Figure 2—figure supplement 1.
Figure 2—figure supplement 1.. Additional images and quantification for time series up to 96 hr.
(A) DAPI staining for colonies shown in Figure 2A and B. (B) Radial profile of marker expression at different times. (C) Overlay of colonies from Figure 2A and B, including DAPI, showing location of cross section in (D). (D) Cross sections through colonies at different times. (E) qPCR data for primordial germ cell (PGC) markers over time without normalization to pluripotent cells (CT values relative to GAPDH).
Figure 2—figure supplement 2.
Figure 2—figure supplement 2.. Additional images for pluripotency markers over time.
(A, B) Separate channels for Figure 2G. (C) Scatterplots of corresponding quantification.
Figure 3.
Figure 3.. Primordial germ cell-like cells (PGCLCs) require sustained BMP, Nodal, and FGF but only brief Wnt signaling.
Each row shows staining and quantification of PGC markers after perturbation of different pathways. Error bands in spatial distributions are omitted for clarity but are similar in magnitude to Figure 1C and E. (A–E) BMP4-treated colonies with or without BMP-receptor inhibition after 24 hr (BMPRi, LDN193189, 250 nM) shows loss of PGCLCs (A–C) and emergence of FOXA2+ SOX17- population. (F) Diagram of signaling hierarchy (black) and perturbations in this figure (red). (G–J) Wnt inhibition using IWP2 5 µM after 0, 12, and 24 hr showing PGCLC specification only requires Wnt signaling between 12 and 24 hr. (K–O) Inhibition of FGFR (PD-173074, 1 µM) or MEK (PD-0325901, 5 µM) at 0 and 24 hr showing complete loss of PGCLCs in both cases. (P–T) Inhibition of Nodal receptors (TGFBRi, SB-431542, 10 µM) at 0 and 24 hr and Nodal knockout (NodalKO) showing complete loss or severe reduction of PGCLCs. Images of each channel separately are shown in Figure 2—figure supplement 2. Scale bar 50 µm.
Figure 3—figure supplement 1.
Figure 3—figure supplement 1.. Additional images and quantification for signaling perturbations in Figure 3.
(A) Overlay and separate channels for Figure 3A. (B) scatterplot of PRDM1 vs. TBXT for BMP4-treated colonies with or without BMP-receptor inhibition after 24 hr, colored for the condition. (C) Overlay and separate channels for Figure 3D. (D) Corresponding radial expression profile. (E, F) Staining and quantification for FOXA2, TBXT, EOMES of BMP4-treated colony treated with BMPRi after 24 hr, showing co-expression of FOXA2 and TBXT, which, together with lack of SOX17 in (C), suggests axial mesoderm. (G) Additional staining for TFAP2C, SOX17, FOXA2 of Wnt inhibition after 0 and 24 hr compared to BMP4 only. (H) Overlay and separate channels for Figure 3K. (I) Scatterplot of PRDM1 vs. TBXT for BMP4-treated colonies with or without MEK inhibition after 0 or 24 hr, colored for the condition. (J) Overlay and separate channels for Figure 3P.
Figure 4.
Figure 4.. Exogenous Activin rescues primordial germ cells (PGCs) in the absence of endogenous Wnt or Nodal in a dose- and time-dependent manner.
(A, B) Wnt inhibition (WNTi, IWP2, 5 µM) with different doses of Activin, for example, A3 = 3 ng/ml Activin. (C–E) Activin rescue of WNTi at 0 hr vs. 12 hr with LEF1 staining. (F–H) Like (C–E) but with canonical WNT inhibitor (cWNTi, IWR-1, 50 µM). (I, J) Like (F–H) stained for additional PGC markers. (K–N) Effect of treatment with Activin in WT and NodalKO cells on expression of PGC and endoderm markers. (O) Differential expression from scRNA-seq for Nodal and BMP receptors, as well as Nodal, BMP, and Lefty. (P, Q) Effect of Activin treatment on PGC differentiation of NodalKO cells for different doses of BMP and quantification. (R–U) Effect of 100 ng/ml Activin for 42 hr, only during the first 24 hr, or only after 24 hr. Images of each channel separately are shown in Figure 3—figure supplement 1. Scale bar 50 µm.
Figure 4—figure supplement 1.
Figure 4—figure supplement 1.. Additional images of primordial germ cell (PGC) rescue by Activin after WNT inhibition.
(A, B) Individual channels for Figure 4A and C. (C) IWR-1 does not block PGC specification at 10 µM. (D) Individual channels for Figure 4F (IWR-1 inhibition at 50 µM and rescue of PGCs by Activin). (E) Like Figure 4C but with TFAP2C, NANOG, PRDM1 staining (PGC rescue by Activin after 5 µM IWP2 treatment). (F) Individual channels for Figure 4I. (G) Increased rescue of PGCs by Activin after inhibition with 1 µM IWP2.
Figure 4—figure supplement 2.
Figure 4—figure supplement 2.. Additional images of the effect of Activin timing and dose on primordial germ cell (PGC) specification.
(A–C) Images of individual channels for Figure 4K, M, and R. (A) corresponds to Figure 4K, (B) to Figure 4M, (C) to Figure 4R. (D, E) Effect of exogenous Activin timing on cell fate in NodalKO cells. (F, G) TFAP2C, NANOG, PRDM1 staining of effect of Activin treatment on PGC differentiation of NodalKO cells for different doses of BMP and quantification.
Figure 5.
Figure 5.. Control of colony size dramatically impacts the fraction of primordial germ cell-like cells (PGCLCs).
(A–D) Different diameter colonies stained for TFAP2C, SOX17, EOMES at 42 hr and quantification, (B) SOX17 vs. TFAP2C scatterplot colored for colony size. (C) Same plot colored for EOMES expression. (D) SOX17+ subpopulations for each colony diameter. (E–G) 100 µm colonies differentiated with BMP only or with incipient mesoderm-like state (iMeLC) pre-differentiation stained for TFAP2C, NANOG, PRDM1 at 48 hr and quantification. C3 = 3 µM CHIR-99021, other notation is like in Figure 4. (I–K) Stainings and quantification of pSMAD1 and SMAD2/3 for different size colonies. Scale bars 50 µm.
Figure 5—figure supplement 1.
Figure 5—figure supplement 1.. Additional images of primordial germ cell (PGC) specification on small micropatterns.
(A, B) Staining for PGC markers and quantification after treatment with Activin for 24 hr followed by inhibition of TGFb signaling by SB431542 (compare Figure 4R). (C) Scatterplots corresponding to (B) and Figure 5F and G colored for cell density show clusters. (D) Differentiation of PGP1 (a male induced pluripotent stem cell [hiPSC] line) on small micropatterns.
Figure 6.
Figure 6.. A network of cross-repressive cell fates qualitatively explains Nodal perturbations.
(A) Input signaling profile in space and time. (B) Diagram of the model. (C) Definition of the model. (D) Phase diagram showing predicted expression of cell fate markers at steady state for different levels constant of BMP and Nodal activation (i.e., behavior of the cells on the very edge at late times). (E) Cell fate patterns predicted by the model from the input signaling profiles with different perturbations. Compare with data in Figures 3A and 4M, and Figure 4—figure supplement 2D. Colors match (B, D). (F) Predicted and measured expression of TFAP2C and SOX17 in a 100-µm-wide ring from the edge for different doses of BMP and Activin. .
Figure 6—figure supplement 1.
Figure 6—figure supplement 1.. Simpler mathematical models.
Each row shows a model and its predicted patterns for the perturbations we wanted to explain. (A) Stable primordial germ cell-like cells (PGCLCs) through autoregulation of SOX17 in combination with TFAP2C and SOX17 activated by Nodal. (B) Activation of SOX17 by BMP and Nodal. (C) Inclusion of a stable primitive streak (PS)-like state activated by Nodal, which cross-represses with TFAP2C. (D) Full model including a stable amnion-like state that cross-represses with SOX17.
Author response image 1.
Author response image 2.
Author response image 2.. Micropatterned PGCLCs.
Author response image 3.
Author response image 4.
Author response image 5.
Author response image 6.

Similar articles

Cited by

References

    1. Arnold SJ, Hofmann UK, Bikoff EK, Robertson EJ. Pivotal roles for eomesodermin during axis formation, epithelium-to-mesenchyme transition and endoderm specification in the mouse. Development (Cambridge, England) 2008;135:501–511. doi: 10.1242/dev.014357. - DOI - PMC - PubMed
    1. Azioune A, Storch M, Bornens M, Théry M, Piel M. Simple and rapid process for single cell micro-patterning. Lab on a Chip. 2009;9:1640–1642. doi: 10.1039/b821581m. - DOI - PubMed
    1. Bertsimas D, Tsitsiklis J. Simulated Annealing. Statistical Science. 1993;8:10–15. doi: 10.1214/ss/1177011077. - DOI
    1. Chen D, Gell JJ, Tao Y, Sosa E, Clark AT. Modeling human infertility with pluripotent stem cells. Stem Cell Research. 2017a;21:187–192. doi: 10.1016/j.scr.2017.04.005. - DOI - PMC - PubMed
    1. Chen D, Liu W, Lukianchikov A, Hancock GV, Zimmerman J, Lowe MG, Kim R, Galic Z, Irie N, Surani MA, Jacobsen SE, Clark AT. Germline competency of human embryonic stem cells depends on eomesodermin. Biology of Reproduction. 2017b;97:850–861. doi: 10.1093/biolre/iox138. - DOI - PMC - PubMed

Publication types

Associated data