. 2022 Jun 1;28(11):2461-2473.
doi: 10.1158/1078-0432.CCR-21-3207.

Distinct Immune Gene Programs Associated with Host Tumor Immunity, Neoadjuvant Chemotherapy, and Chemoimmunotherapy in Resectable NSCLC

Affiliations

Distinct Immune Gene Programs Associated with Host Tumor Immunity, Neoadjuvant Chemotherapy, and Chemoimmunotherapy in Resectable NSCLC

Pedro Rocha et al. Clin Cancer Res. .

Abstract

Purpose: Our understanding of the immunopathology of resectable non-small cell lung cancer (NSCLC) is still limited. Here, we explore immune programs that inform of tumor immunity and response to neoadjuvant chemotherapy and chemoimmunotherapy in localized NSCLC.

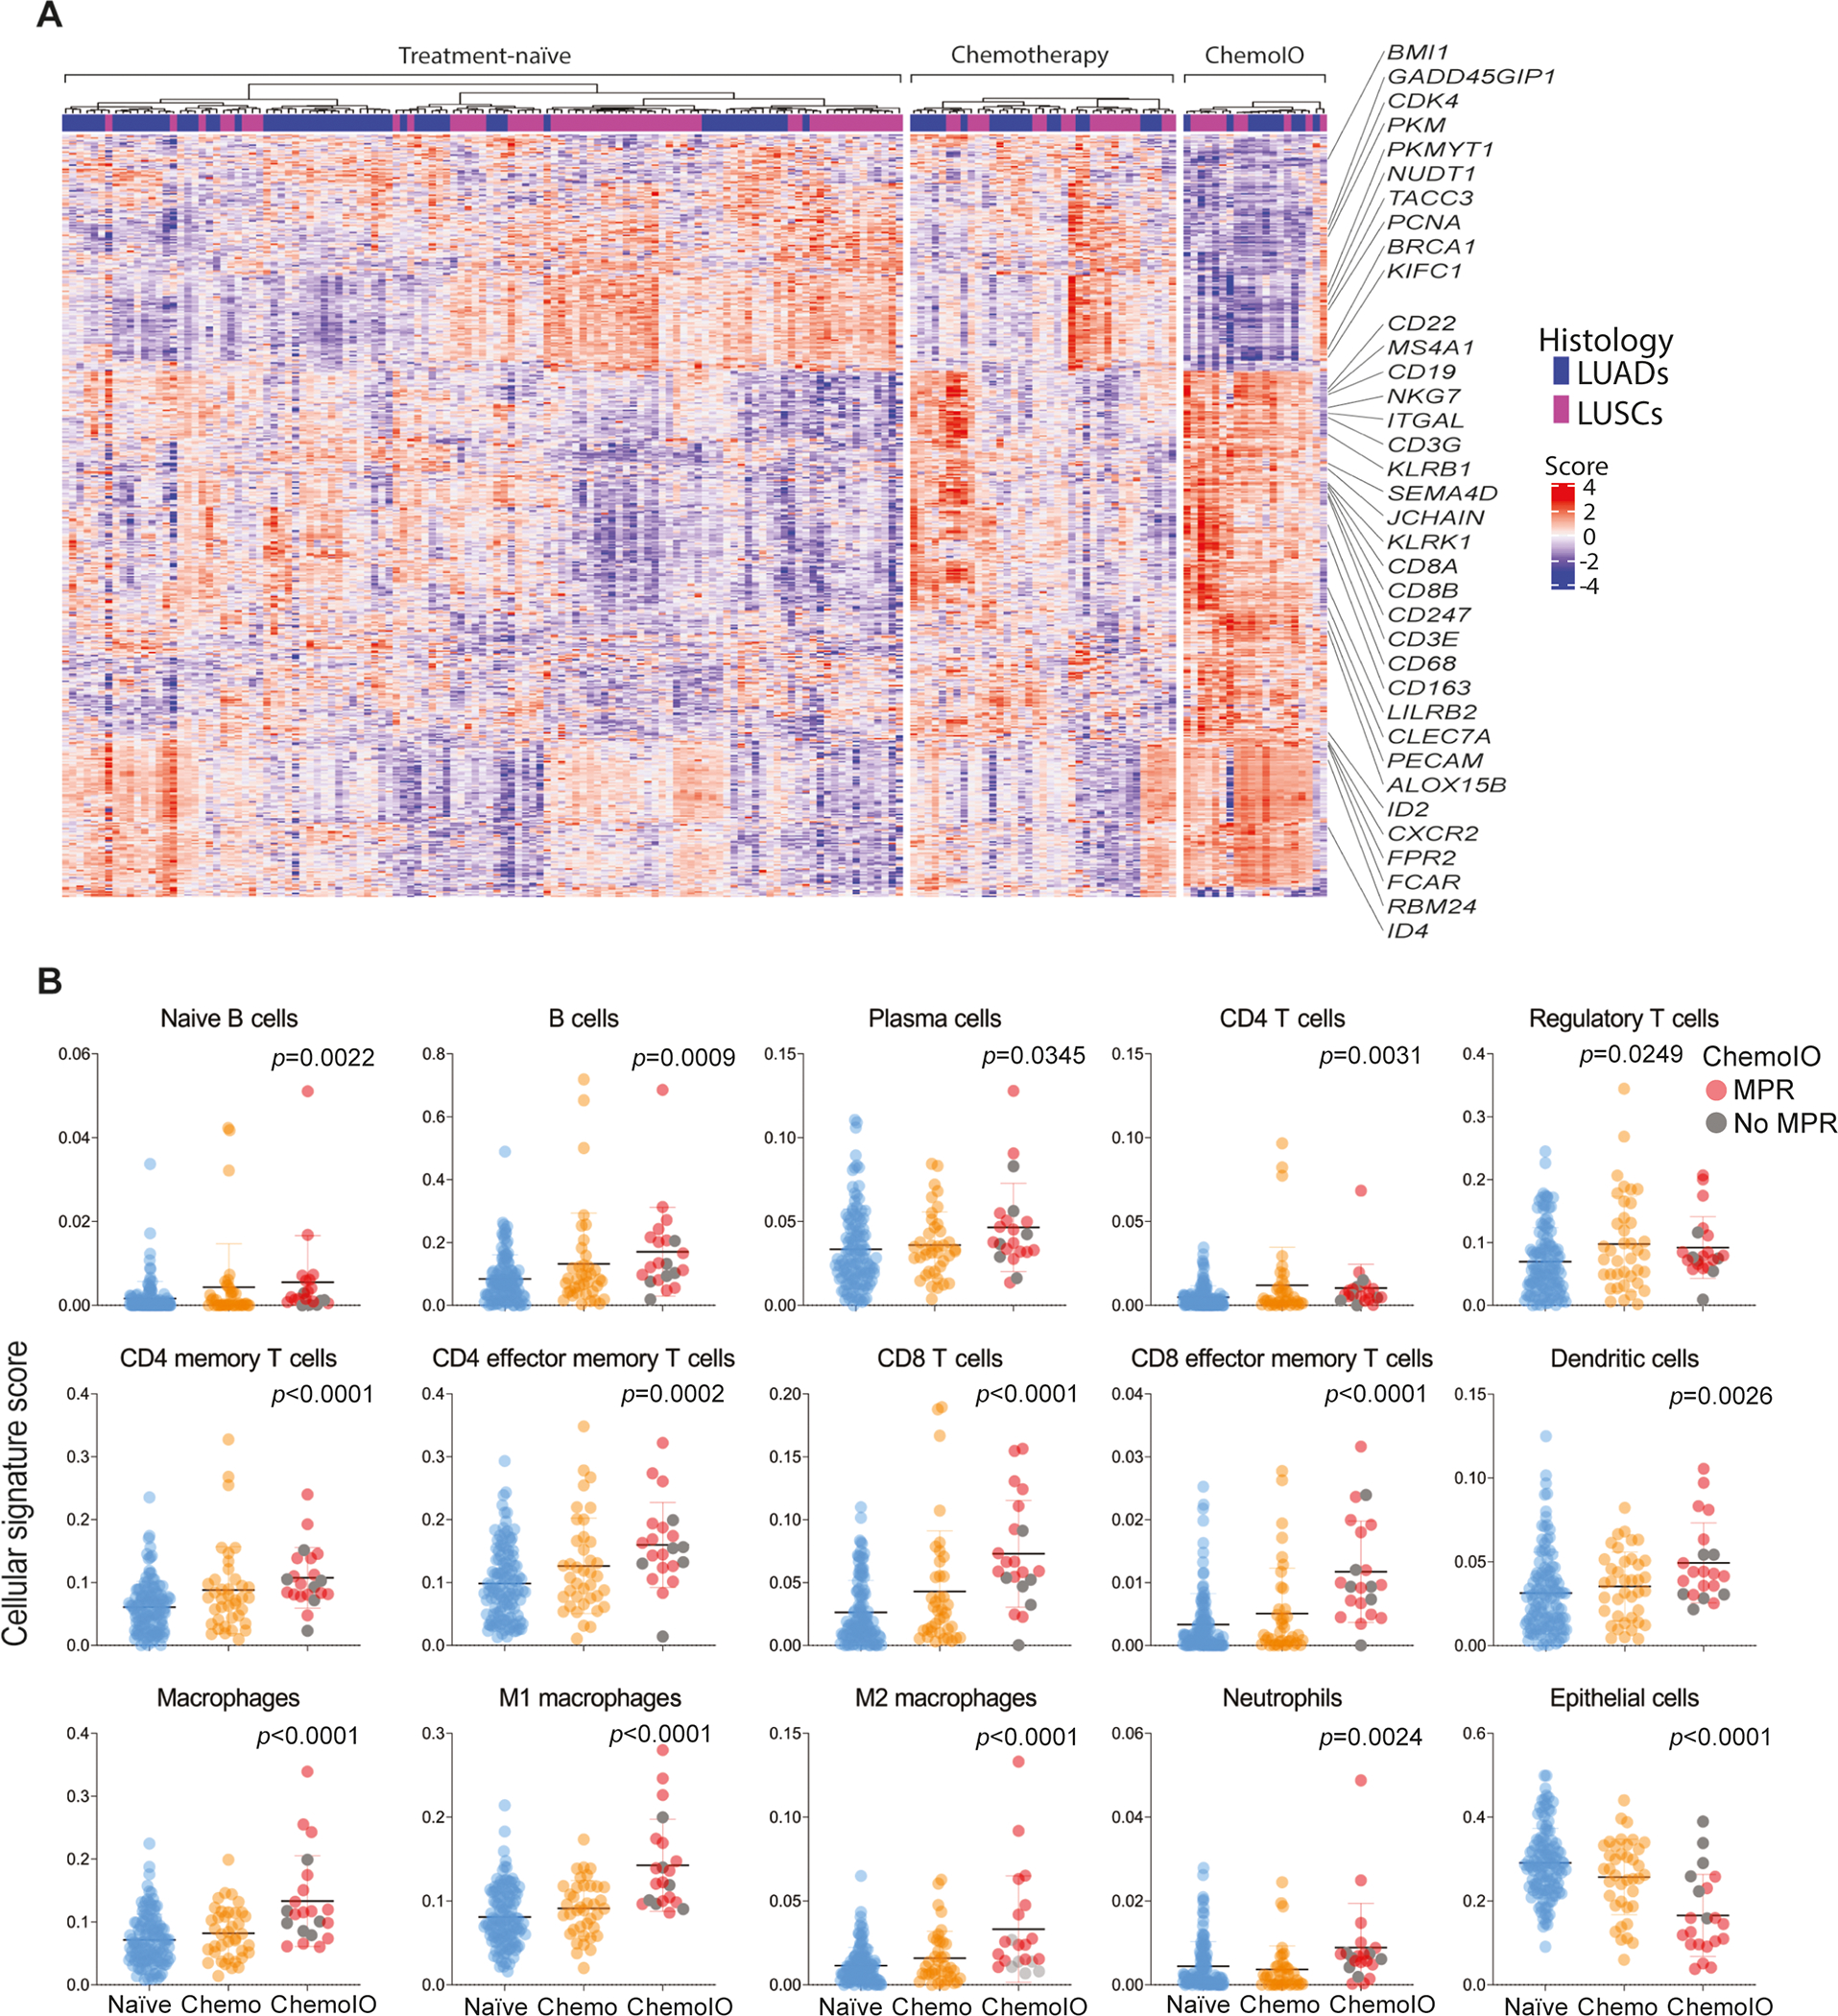
Experimental design: Targeted immune gene sequencing using the HTG Precision Immuno-Oncology panel was performed in localized NSCLCs from three cohorts based on treatment: naïve (n = 190), neoadjuvant chemotherapy (n = 38), and neoadjuvant chemoimmunotherapy (n = 21). Tumor immune microenvironment (TIME) phenotypes were based on the location of CD8+ T cells (inflamed, cold, excluded), tumoral PD-L1 expression (<1% and ≥1%), and tumor-infiltrating lymphocytes (TIL). Immune programs and signatures were statistically analyzed on the basis of tumoral PD-L1 expression, immune phenotypes, and pathologic response and were cross-compared across the three cohorts.

Results: PD-L1-positive tumors exhibited increased signature scores for various lymphoid and myeloid cell subsets (P < 0.05). TIME phenotypes exhibited disparate frequencies by stage, PD-L1 expression, and mutational burden. Inflamed and PD-L1+/TILs+ NSCLCs displayed overall significantly heightened levels of immune signatures, with the excluded group representing an intermediate state. A cytotoxic T-cell signature was associated with favorable survival in neoadjuvant chemotherapy-treated NSCLCs (P < 0.05). Pathologic response to chemoimmunotherapy was positively associated with higher expression of genes involved in immune activation, chemotaxis, as well as T and natural killer cells (P < 0.05 for all). Among the three cohorts, chemoimmunotherapy-treated NSCLCs exhibited the highest scores for various immune cell subsets including T effector and B cells (P < 0.05).

Conclusions: Our findings highlight immune gene programs that may underlie host tumor immunity and response to neoadjuvant chemotherapy and chemoimmunotherapy in resectable NSCLC.


Figures

Figure 1.
Figure 1.. Immune expression programs differentially expressed in PD-L1 positive and negative treatment-naïve LUADs.
A) Heat map showing DEGs between PD-L1 positive (≥1%) and PD-L1 negative (<1%) treatment-naïve LUADs. DEGS were selected based on a statistical threshold of adjusted p<0.05. Columns denote samples which were annotated with clinicopathological and molecular features, and rows represent DEGs (red, relatively higher expression; blue, relatively lower expression). B) Differential expression of functional gene signatures (red, higher expression; blue, relatively lower expression; adjusted p<0.05) between PD-L1 positive and negative LUADs. C) Violin plots for cellular signatures scores in PD-L1 positive (≥1%, orange) and PD-L1 negative (<1%, blue) tumors. P-values were calculated based on the Mann Whitney test, black lines represent the median, and gray lines correspond to 95% confidence interval (CI). LUADs, lung adenocarcinomas; DEGs, differently expressed genes.
Figure 2.
Figure 2.. Gene expression programs associated with immunologically inflamed, cold, and excluded TIME phenotypes in treatment-naïve LUADs.
A) Scatter plot showing distribution of LUADs based on tumoral cell densities of CD8+ T cells (y-axis) and peritumoral/tumoral ratios for CD8+ T cells (x-axis). LUADs were classified into inflamed (red rectangle), cold (blue rectangle), and excluded (yellow rectangle) phenotypes (top), along with representative images for the three different phenotype patterns at the bottom (P, peritumoral; T, tumor area). LUADs were also color coded by PD-L1 expression (orange, (≥1%; blue, <1%). B) Frequencies of TIME phenotypes in LUAD by pathological stage, tumoral PD-L1 expression, as well as somatic mutational burden (TMB; TMB high, ≥ median (171); TMB low, < median). P-values were calculated based on the Fisher’s exact test. C) Violin plots depicting cellular signature scores across the three TIME phenotypes. P-values were calculated based on the Kruskal-Wallis test, black lines represent median levels, and gray lines correspond to 95% confidence interval (CI). D) Heat map showing 94 DEGs (adjusted p<0.05) between the three TIME phenotypes. Rows represent single genes and columns denote samples (red, relatively higher expression; blue, relatively lower expression).
Figure 3.
Figure 3.. Immune expression changes linked with pathological response after neoadjuvant chemotherapy in early-stage NSCLC.
A) Heat map showing 29 DEGs (un-adjusted p<0.01) that are associated with the percent of viable tumor cells in early-stage NSCLCs treated with neoadjuvant chemotherapy. Columns denote NSCLCs that are annotated with clinicopathological and molecular features and rows represent DEGs (red, relatively higher expression; blue, relatively lower expression). B) Scatter plot showing statistically positive correlation of the identified DEGs (left) and an epithelial cell signature (right) with percent viable tumor cells. Correlation was statistically assessed using Spearman correlation. C) Analysis of the association of signature score for cytotoxic T lymphocytes with overall survival (OS) using Kaplan-Meier method for estimation of survival probability and of a D) Adenosine signature with recurrence (p-value was calculated based on the Mann Whitney test, black lines represent the median, and gray lines correspond to 95% confidence interval (CI).
Figure 4.
Figure 4.. Chemoimmunotherapy elicits pronounced immune-wide expression changes in resectable NSCLC.
A) Violin plots for cellular signatures scores in patients with (% of viable tumor cells ≤10%, orange) and without pCR / MPR (>10% of viable tumor cells, blue). P-values were calculated based on the Mann Whitney test; black lines represent median values, and gray lines correspond to 95% confidence interval (CI). B) Heat map showing 223 DEGs (adjusted p<0.05) that are associated with percent viable tumor cells in early-stage NSCLCs treated with neoadjuvant chemoimmunotherapy. C) Radar plot highlighting differences between pre- (red) and post-treatment samples (blue) for the cellular signature scores. D) Heat map showing 128 DEGs between pre- and post-treatment samples (adjusted p<0.05). Columns denote samples and rows represent single genes and (red, relatively higher expression; blue, relatively lower expression). P-values were calculated using Wilcoxon matched-pairs signed rank test. pCR: pathologic complete response, MPR: major pathologic response.
Figure 5.
Figure 5.. Immune gene programs that are differentially modulated between treatment-naïve NSCLCs and those treated with neoadjuvant chemotherapy and chemoimmunotherapy.
A) Heat map showing 532 DEGs between treatment-naïve, treated with neoadjuvant chemotherapy (Chemotherapy), and those treated with chemoimmunotherapy (ChemoIO) NSCLCs (adjusted p<0.05). Columns denote samples and rows represent single genes (red, relatively higher expression; blue, relatively lower expression). B) Dot plots for cellular signature scores across the three cohort (blue, treatment-naïve; orange, neoadjuvant chemotherapy; red, neoadjuvant chemoimmunotherapy. P-values were calculated based on Kruskal-Wallis test, bars correspond to median values +/− 95% CI).

References

    1. Siegel RL, Miller KD, Fuchs HE & Jemal A Cancer statistics, 2022. CA. Cancer J. Clin. 72, 7–33 (2022). - PubMed
    1. Siegel RL, Miller KD, Fuchs HE & Jemal A Cancer Statistics, 2021. CA. Cancer J. Clin 71, 7–33 (2021). - PubMed
    1. National Lung Screening Trial Research Team et al. Results of initial low-dose computed tomographic screening for lung cancer. N. Engl. J. Med. 368, 1980–91 (2013). - PMC - PubMed
    1. Timmerman R et al. Stereotactic body radiation therapy for inoperable early stage lung cancer. JAMA 303, 1070–6 (2010). - PMC - PubMed
    1. Felip E et al. Adjuvant atezolizumab after adjuvant chemotherapy in resected stage IB-IIIA non-small-cell lung cancer (IMpower010): a randomised, multicentre, open-label, phase 3 trial. Lancet (London, England) 398, 1344–1357 (2021). - PubMed

Publication types