. 2022 Aug 5;20(8):1305-1319.
doi: 10.1158/1541-7786.MCR-21-0994.

KRAS Mutants Upregulate Integrin β4 to Promote Invasion and Metastasis in Colorectal Cancer

Affiliations

KRAS Mutants Upregulate Integrin β4 to Promote Invasion and Metastasis in Colorectal Cancer

Seo-Hyun Choi et al. Mol Cancer Res. .

Abstract

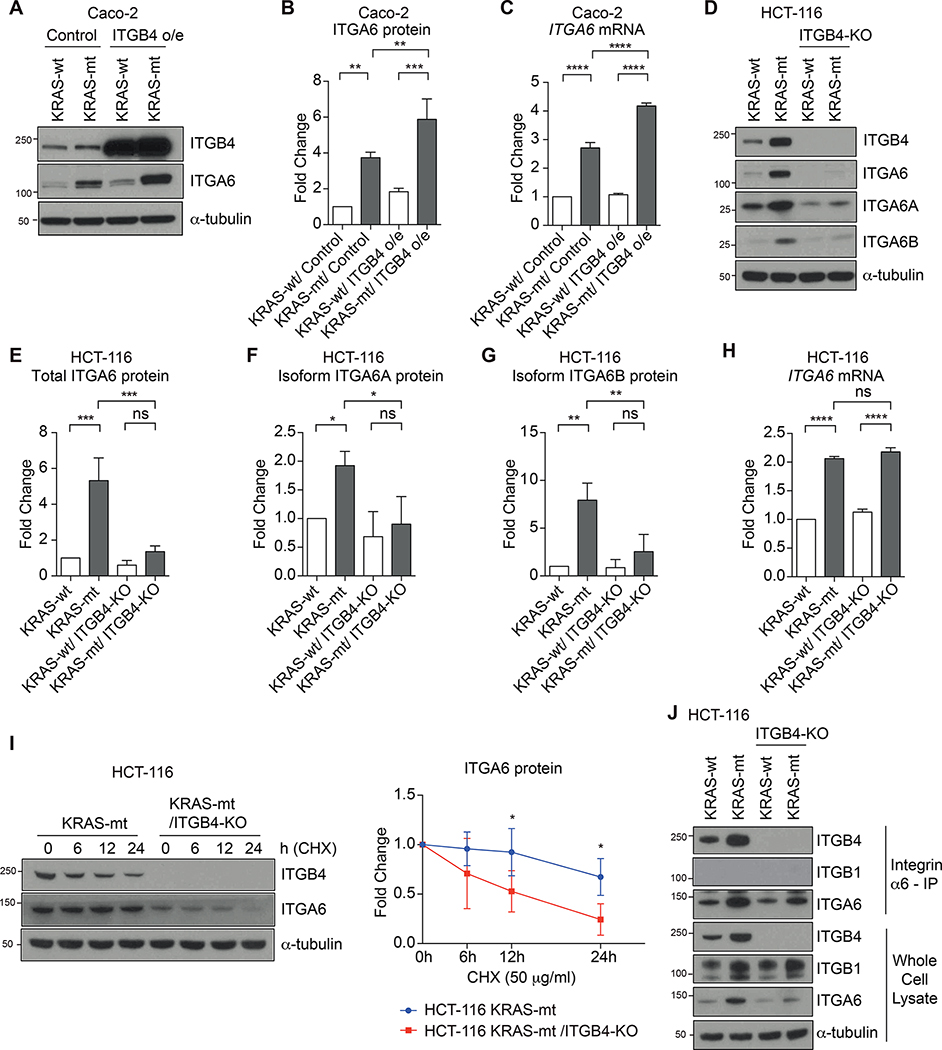
KRAS mutation in colorectal cancer is associated with aggressive tumor behavior through increased invasiveness and higher rates of lung metastases, but the biological mechanisms behind these features are not fully understood. In this study, we show that KRAS-mutant colorectal cancer upregulates integrin α6β4 through ERK/MEK signaling. Knocking-out integrin β4 (ITGB4) specifically depleted the expression of integrin α6β4 and this resulted in a reduction in the invasion and migration ability of the cancer cells. We also observed a reduction in the number and area of lung metastatic foci in mice that were injected with ITGB4 knockout KRAS-mutant colorectal cancer cells compared with the mice injected with ITGB4 wild-type KRAS-mutant colorectal cancer cells, while no difference was observed in liver metastases. Inhibiting integrin α6β4 in KRAS-mutant colorectal cancer could be a potential therapeutic target to diminish the KRAS-invasive phenotype and associated pulmonary metastasis rate.

Implications: Knocking-out ITGB4, which is overexpressed in KRAS-mutant colorectal cancer and promotes tumor aggressiveness, diminishes local invasiveness and rates of pulmonary metastasis.


Conflict of interest statement

Disclosure of Potential Conflicts of Interest:

JGA has received honorarium for being a consultant with the following: Medtronics, Ethicon J&J, Da Vinci Intuitive Surgical. JJS has received travel support from Intuitive Surgical Inc. for fellow education (2015) and has served as a clinical advisor for Guardant Health, Inc (2019). The other co-authors have no conflicts of interest to disclose.

Figures

Figure 1.
Figure 1.
Increased expression of ITGB4 in KRAS mutant CRC. A, The expression profile of ITGB4 mRNA across cancer types in TCGA PanCancer Atlas studies. B, ITGB4 mRNA expression in CRC by KRAS status in TCGA PanCancer Atlas studies. C, Western blot analysis of ITGB4 protein in human CRC cell lines. Caco-2 cells (5 × 10⁵ cells/100 mm dish) and HCT-116 cells (1 × 10⁶ cells/ 100 mm dish) were cultured for 3 days. Data are representative of three independent experiments. D, Quantitative RT-PCR analysis of Itgb4 mRNA expression in mouse colonic organoids. Bar graph shows the mean ± SD of four independent experiments. E, Western blot analysis of ITGB4 protein in mouse colonic organoids. Data are representative of three independent experiments. D and E, Mouse colonic organoids (at density of 3 × 10³ cells/ 50 μl of Matrigel/ 24 well) were cultured for 5 days. F, IF staining and quantification of ITGB4 and E-cadherin positive cells in human CRC tissues. Each dot represents one CRC patient. Bar graphs show the mean ± SD for each group (KRAS-wt, n=24; KRAS-mt, n=14). Scale bars, 100 μm. D and F, Student’s t test. *, P < 0.05; ns, not significant.
Figure 2.
Figure 2.
Mutant KRAS increases ITGB4 and ITGA6 expression in HCT-116 cells through the MEK/ERK signaling pathway. A-E, Western blot analysis (A) and quantitative RT-PCR analysis (B-E) of ITGB4 and ITGA6 expression in HCT-116 cells treated with MEK kinase inhibitor (PD0325901, 10 μM) or PI3K inhibitor (LY294002, 10 μM). HCT-116 cells (1 × 10⁶ cells/ 100 mm dish) were cultured for 2 days and treated with the inhibitors for 24 h. A, Data are representative of three independent experiments. B-E, Bar graphs show the mean ± SD of three independent experiments. Student’s t test. *, P < 0.05; **, P < 0.01; ***, P < 0.001.
Figure 3.
Figure 3.
ITGB4 is necessary for the stability of ITGA6 protein in HCT-116 cells. A and B, Western blot analysis (A) and quantification (B) of total ITGA6 protein in KRAS-wt and -mt Caco-2 cells with or without ITGB4 overexpression (ITGB4 o/e). B, Bar graphs show the mean ± SD of three independent experiments. C, Quantitative RT-PCR analysis of ITGA6 mRNA expression in Caco-2 cells. Bar graph shows the mean ± SD of three independent experiments. (A-C) Caco-2 cells (5 × 10⁵ cells/ 100 mm dish) were cultured for 3 days. D, Western blot analysis of total ITGA6 protein and two splice isoforms (ITGA6A and ITGA6B) in KRAS-wt and -mt HCT-116 cells with or without ITGB4-knockout (KO). E-G, Quantification of total ITGA6 protein (E), splice isoform ITGA6A protein (F), and splice isoform ITGA6B protein (G) in HCT-116 cells using western blot in (D). Bar graphs show the mean ± SD of three independent experiments. H, Quantitative RT-PCR analysis of ITGA6 mRNA expression in HCT-116 cells. Bar graph shows the mean ± SD of three independent experiments. D-H, HCT-116 cells (1 × 10⁶ cells/ 100 mm dish) were cultured for 3 days. I, Western blot analysis of ITGA6 protein stability in KRAS-mt HCT-116 cells with or without ITGB4-KO. HCT-116 cells (1 × 10⁶ cells/ 100 mm dish) were cultured for 2 days and treated with protein synthesis inhibitor, cycloheximide (CHX, 50 μg/ml), and harvested at indicated time points. Graph shows the mean ± SD of four independent experiments. Each ITGA6 protein level was normalized to respective untreated control (0 h). Multiple t-test. *, P < 0.05. J, Co-immunoprecipitation of ITGB4 and ITGB1 with anti-ITGA6 antibody from HCT-116 cells. HCT-116 cells (1 × 10⁶ cells/ 100 mm dish) were cultured for 3 days. Representative of three independent experiments. Whole cell lysates were used as input control. B, C and E-H, One-way ANOVA. *, P < 0.05; **, P < 0.01; ***, P < 0.001; ****, P < 0.0001; ns, not significant; o/e, overexpression.
Figure 4.
Figure 4.
Knock out of ITGB4 does not affect the proliferation rate and the tumor growth of KRAS mutant HCT-116 cells and mouse colonic organoids. A, Western blot analysis of ERK1/2 and AKT phosphorylation in ITGB4 knockout HCT-116 cells. HCT-116 cells (1 × 10⁶ cells/ 100 mm dish) were cultured for 3 days. Data are representative of three independent experiments. B-D, Proliferation rates of HCT-116 cells (B), mouse organoids (C), and Caco-2 (D) were determined at day3 by MTT, WST-1, and MTT, respectively. Bar graphs show the mean ± SD of three independent experiments. MTT or WST-1 values at day 3 were normalized to day 0 of each cell line. Student’s t test. *, P < 0.05; ns, not significant. E and F, HCT-116 cells were injected into the both flanks of nude mice subcutaneously. Tumor growths were measured on indicated days. E, Growth of HCT-116 KRAS-mt tumors with or without ITGB4-KO. Graph shows the mean ± SD for each group (HCT-116 KRAS-mt, n=10; HCT-116 KRAS-mt/ITGB4-KO, n=10 tumors from each 5 mice). F, Representative H&E staining images of tumor tissues. Scale bars, 50 μm. G and H, Mouse organoids were injected into both flanks of C57BL/6 mice subcutaneously. Tumor growths were measured on indicated days. G, Growth of APK and APK/ITGB4-KO in C57BL/6 mice. Graph shows the mean ± SD for each group (APK, n=8 tumors from 4 mice; APK/ITGB4-KO, n=9 tumors from 5 mice). H, Representative H&E staining images of tumor tissues. Scale bars, 50 μm.
Figure 5.
Figure 5.
Knock out of ITGB4 decreases migration and invasion of KRAS mutant HCT-116 cells in vitro. A-B, Transwell migration assay (A) and transwell invasion assay (B) of HCT116 cells. HCT-116 cells were seeded on the transwell membrane without (A) or with (B) matrigel coating. After 24 h, cells on the opposite surface of the transwell membrane were fixed, stained, and quantified. Bar graphs show the mean ± SD of four independent experiments. Representative images are shown below. Scale bars, 100 μm. C, 3D invasion assay of HCT-116 cells in organotypic culture system. HCT-116 cells were seeded onto 3D gels composed of collagen, matrigel, and fibroblasts. After 10–12 days, gels were fixed and paraffin-embedded, and cells invading into the gel were stained and quantified. Representative images of IF staining of E-cadherin, ITGB4, and Vimentin are shown. Scale bars, 100 μm. D-F, Quantification of maximum invasion depth (D), total invasion area (E), and total invaded cell numbers (F) of 3D invasion assay in (C). Bar graphs show the mean ± SD of five independent experiments. A, B and D-F, Student’s t test. *, P < 0.05; **, P < 0.01; ***, P < 0.001; ns, not significant.
Figure 6.
Figure 6.
Knock out of ITGB4 decreases orthotopic implantation rate of APK organoids. A-D, APK and APK/ITGB4-KO organoids were transplanted into the lumen of C57BL/6 mouse rectum. Tumor growth was assessed by endoscopy at 2 and 4 weeks after transplantation, and rectal tissues were collected after second endoscopy (APK, n=15; APK/ITGB4-KO, n=14). A, Schematic illustration of endoluminal tumor model. B, Representative endoscopic images and H&E staining of rectums with adenocarcinoma. Scale bar : 200 and 50 μm. C, Graph shows the percentage of tumor burden at 4 weeks after transplantation. Fisher’s exact test. P = 0.0421. D, Graph shows the percentage of tumor size within lumen. Mean ± SEM for each group (APK, n=5; APK/ITGB4-KO, n=14).
Figure 7.
Figure 7.
Knock out of ITGB4 decreases number of pulmonary metastatic foci of APK organoids. A-E, APK-LM and APK-LM/ITGB4-KO organoids derived from liver metastasis were transplanted into NSG mice via tail vein. Lung and liver tissues were collected at 5 weeks after transplantation. A, Schematic illustration of lung metastatic tumor model. B, Representative images of H&E staining and IF staining of lung tissues. GFP is a marker of transplanted organoids. Scale bar : 2000, 200, and 50 μm. C, Quantification of metastatic foci and metastatic area in (B) are shown. D, Representative images of H&E staining of liver. Scale bar : 2000, 500, and 50 μm. (E) Quantification of metastatic foci and metastatic area in (D) are shown. C and E, Each dot in the individual graphs represents one mouse. Bar graphs show the mean ± SD for each group (APK-LM, n=11; APK-LM/ITGB4-KO, n=11). Student’s t test. **, P < 0.01; ns, not significant.

References

    1. Hynes RO. Integrins: bidirectional, allosteric signaling machines. Cell. 2002;110:673–87. - PubMed
    1. Giancotti FG, Ruoslahti E. Integrin signaling. Science. 1999;285:1028–32. - PubMed
    1. Lipscomb EA, Mercurio AM. Mobilization and activation of a signaling competent alpha6beta4integrin underlies its contribution to carcinoma progression. Cancer Metastasis Rev. 2005;24:413–23. - PubMed
    1. Cancer Genome Atlas Network. Comprehensive molecular characterization of human colon and rectal cancer. Nature. 2012;487:330–7. - PMC - PubMed
    1. Serebriiskii IG, Connelly C, Frampton G, Newberg J, Cooke M, Miller V, et al. Comprehensive characterization of RAS mutations in colon and rectal cancers in old and young patients. Nat Commun. 2019;10:3722. - PMC - PubMed

Publication types

MeSH terms