. 2022 May 10;18(5):3239-3256.
doi: 10.1021/acs.jctc.2c00138. Epub 2022 Apr 8.

Accurate Sequence-Dependent Coarse-Grained Model for Conformational and Elastic Properties of Double-Stranded DNA

Accurate Sequence-Dependent Coarse-Grained Model for Conformational and Elastic Properties of Double-Stranded DNA

Salvatore Assenza et al. J Chem Theory Comput. .

Abstract

We introduce MADna, a sequence-dependent coarse-grained model of double-stranded DNA (dsDNA), where each nucleotide is described by three beads localized at the sugar, at the base moiety, and at the phosphate group, respectively. The sequence dependence is included by considering a step-dependent parametrization of the bonded interactions, which are tuned in order to reproduce the values of key observables obtained from exhaustive atomistic simulations from the literature. The predictions of the model are benchmarked against an independent set of all-atom simulations, showing that it captures with high fidelity the sequence dependence of conformational and elastic features beyond the single step considered in its formulation. A remarkably good agreement with experiments is found for both sequence-averaged and sequence-dependent conformational and elastic features, including the stretching and torsion moduli, the twist-stretch and twist-bend couplings, the persistence length, and the helical pitch. Overall, for the inspected quantities, the model has a precision comparable to atomistic simulations, hence providing a reliable coarse-grained description for the rationalization of single-molecule experiments and the study of cellular processes involving dsDNA. Owing to the simplicity of its formulation, MADna can be straightforwardly included in common simulation engines. Particularly, an implementation of the model in LAMMPS is made available on an online repository to ease its usage within the DNA research community.


Conflict of interest statement

The authors declare no competing financial interest.

Figures

Figure 1
Figure 1
Atomistic (left) and coarse-grained (right) description for a representative dsDNA molecule with leading sequence 5′-CGCTACTTCGAGG-3′ in the B-DNA form as obtained by employing the NAB software. In the coarse-grained cartoon, the color code is the following: sugar ↔ black; phosphate group ↔ red; adenine ↔ green; cytosine ↔ cyan; guanine ↔ yellow; thymine ↔ orange. The size of each bead is proportional to the WCA radius of the corresponding moiety.
Figure 2
Figure 2
Average values obtained by coarse-graining the atomistic simulations for the angles SBB (a) and the dihedrals SBBS (b). Vertical lines separate the distinct sequences, which are listed in Section S3.1 in the Supporting Information. In the legends, the various labels correspond to the particular bases involved in the local conformation under consideration. For instance, SAT considers a SBB angle in which an adenine is bound to the sugar. Note also that the dihedrals are symmetric with respect to the inversion of the involved bases, as it just corresponds to changing the arbitrary reference strand.
Figure 3
Figure 3
List of the various bonded interactions considered in the model, together with representative examples based on the same molecule as in Figure 1. Step-dependent bonded interactions are indicated by the presence of the tags 5′ and 3′ in their label. For interstrand interactions, the corresponding label is underlined. The letters present in the labels indicate sugars (S), phosphate groups (P), or generic bases (B). For clarity, all the selected examples involve beads belonging to the same strand, whose 5′-3′ direction is indicated by the arrow in the top-left panel.
Figure 4
Figure 4
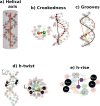
Sketches showing pictorially the definitions to characterize the geometry of DNA. (a) The helical axis is obtained as the axis of the best-fitting cylinder. (b) The crookedness is obtained by computing the arccosine of the ratio between the end-to-end distance (black arrow) and the contour-length of DNA (red line). These quantities are obtained along the line formed by the points Γi, which are determined as the centers between bases belonging to the same pair (inset). (c) Grooves are defined by considering the lines interpolating the phosphate beads (brown and black lines). For any couple of phosphates on the first strand (P1,i and P1,i+1 in this case), we define the midpoint (Mi). From the midpoint, we find the closest points on the second strand. The groove widths are obtained as the corresponding minimum distances (orange segments), suitably shifted to account for the excluded volume of the backbone. (d) The h-twist is defined by considering the vectors ζiS2,iS1,i joining the two sugars within each base. The vectors ζi are projected onto the plane perpendicular to the helical axis, thus obtaining ζir. The h-twist is then defined as the angle depicted in red, corresponding to cos h-twist = ζir·ζi+1r·e) The h-rise is defined by considering the geometrical centers of the sugars ξi ≡ (S1,i + S2,i)/2 and projecting the vector separating two consecutive centers onto the helical axis, thus obtaining h-rise = (ξi+1 – ξiĥ, corresponding to the red segment in the figure.
Figure 5
Figure 5
Scatter plot comparing atomistic and coarse-grained results at f = 1 pN for various structural features: crookedness β (panel a); helical diameter (b); helical rise (c); helical twist (d); width of major (e) and minor (f) groove; depth of major (g) and minor (h) groove; SBBS dihedrals (i). Training and testing sequences are denoted by red circles and green diamonds, respectively. Black lines indicate the bisector of the first and third quadrant. For each panel, the Pearson coefficient indicating the linear correlation between the two data sets is reported. The atomistic results were obtained by coarse-graining the trajectories obtained from all-atom simulations and performing the analysis reported in the Methods.
Figure 6
Figure 6
Scatter plot comparing atomistic and coarse-grained results for the effective stretching modulus (panel a), the crookedness rigidity kβ (b), the torsion modulus C (c), and the twist–stretch coupling constant g (d). Training and testing sequences are denoted by red circles and green diamonds, respectively. Black lines indicate the bisector of the first quadrant. For each panel, the Pearson coefficient indicating the linear correlation between the data sets corresponding to the testing sequences is reported.
Figure 7
Figure 7
(a) Schematic description of the simulation setup for the stretch–torsion simulations, prescribing a constant force and torque applied along a fixed direction. (b) Twist response to the external force in the absence of imposed torque for MADna (orange circles), oxDNA2 (green squares), 3SPN2C (blue diamonds), and rotor-bead experiments (gray triangles). The black dashed line indicates Δθ = 0; therefore, overwinding and unwinding responses are characterized by points lying above and below the line, respectively. The simulation data correspond to the average of the five sequences considered. (c) Effective stretching modulus , torsion modulus C, and twist–stretch coupling constant g obtained by the three models for the five sequences reported in Section S3.3 in the Supporting Information. Symbols are the same as in panel b. The gray triangles correspond to experimental measures obtained for unrelated sequences in refs (−20) for , refs (, , , and 92) for C, and refs (, , , and 93) for g. In the case of g, the dashed black line denotes g = 0, thus separating two regimes characterized by qualitatively different twist–stretch coupling.
Figure 8
Figure 8
Effective torsion modulus Ceff as a function of force for MADna (orange circles), oxDNA2 (green squares), 3SPN2C (blue diamonds), and experiments (gray triangles). Experimental data were extracted from refs ( and 34).
Figure 9
Figure 9
Comparison between experimental values and MADna predictions for the sequence dependence of the helical pitch (a) and the persistence length lp (b). The lines correspond to the linear fits of the scatter plots and are included as a guide to the eye. The value of the Pearson coefficient is reported in each plot.

References

    1. Rohs R.; Jin X.; West S. M.; Joshi R.; Honig B.; Mann R. S. Origins of specificity in protein-DNA recognition. Annu. Rev. Biochem. 2010, 79, 233–269. 10.1146/annurev-biochem-060408-091030. - DOI - PMC - PubMed
    1. Rohs R.; West S. M.; Sosinsky A.; Liu P.; Mann R. S.; Honig B. The role of DNA shape in protein-DNA recognition. Nature 2009, 461, 1248–1253. 10.1038/nature08473. - DOI - PMC - PubMed
    1. Segal E.; Widom J. Poly (dA: dT) tracts: major determinants of nucleosome organization. Curr. Opin. Struct. Biol. 2009, 19, 65–71. 10.1016/j.sbi.2009.01.004. - DOI - PMC - PubMed
    1. Haran T. E.; Mohanty U. The unique structure of A-tracts and intrinsic DNA bending. Q. Rev. Biophys. 2009, 42, 41–81. 10.1017/S0033583509004752. - DOI - PubMed
    1. Seol Y.; Hardin A. H.; Strub M.-P.; Charvin G.; Neuman K. C. Comparison of DNA decatenation by Escherichia coli topoisomerase IV and topoisomerase III: implications for non-equilibrium topology simplification. Nucleic Acids Res. 2013, 41, 4640–4649. 10.1093/nar/gkt136. - DOI - PMC - PubMed