. 2022 Apr 8;7(70):eabi8642.
doi: 10.1126/sciimmunol.abi8642. Epub 2022 Apr 8.

Cytotoxic granzyme C-expressing ILC1s contribute to antitumor immunity and neonatal autoimmunity

Affiliations

Cytotoxic granzyme C-expressing ILC1s contribute to antitumor immunity and neonatal autoimmunity

Briana G Nixon et al. Sci Immunol. .

Abstract

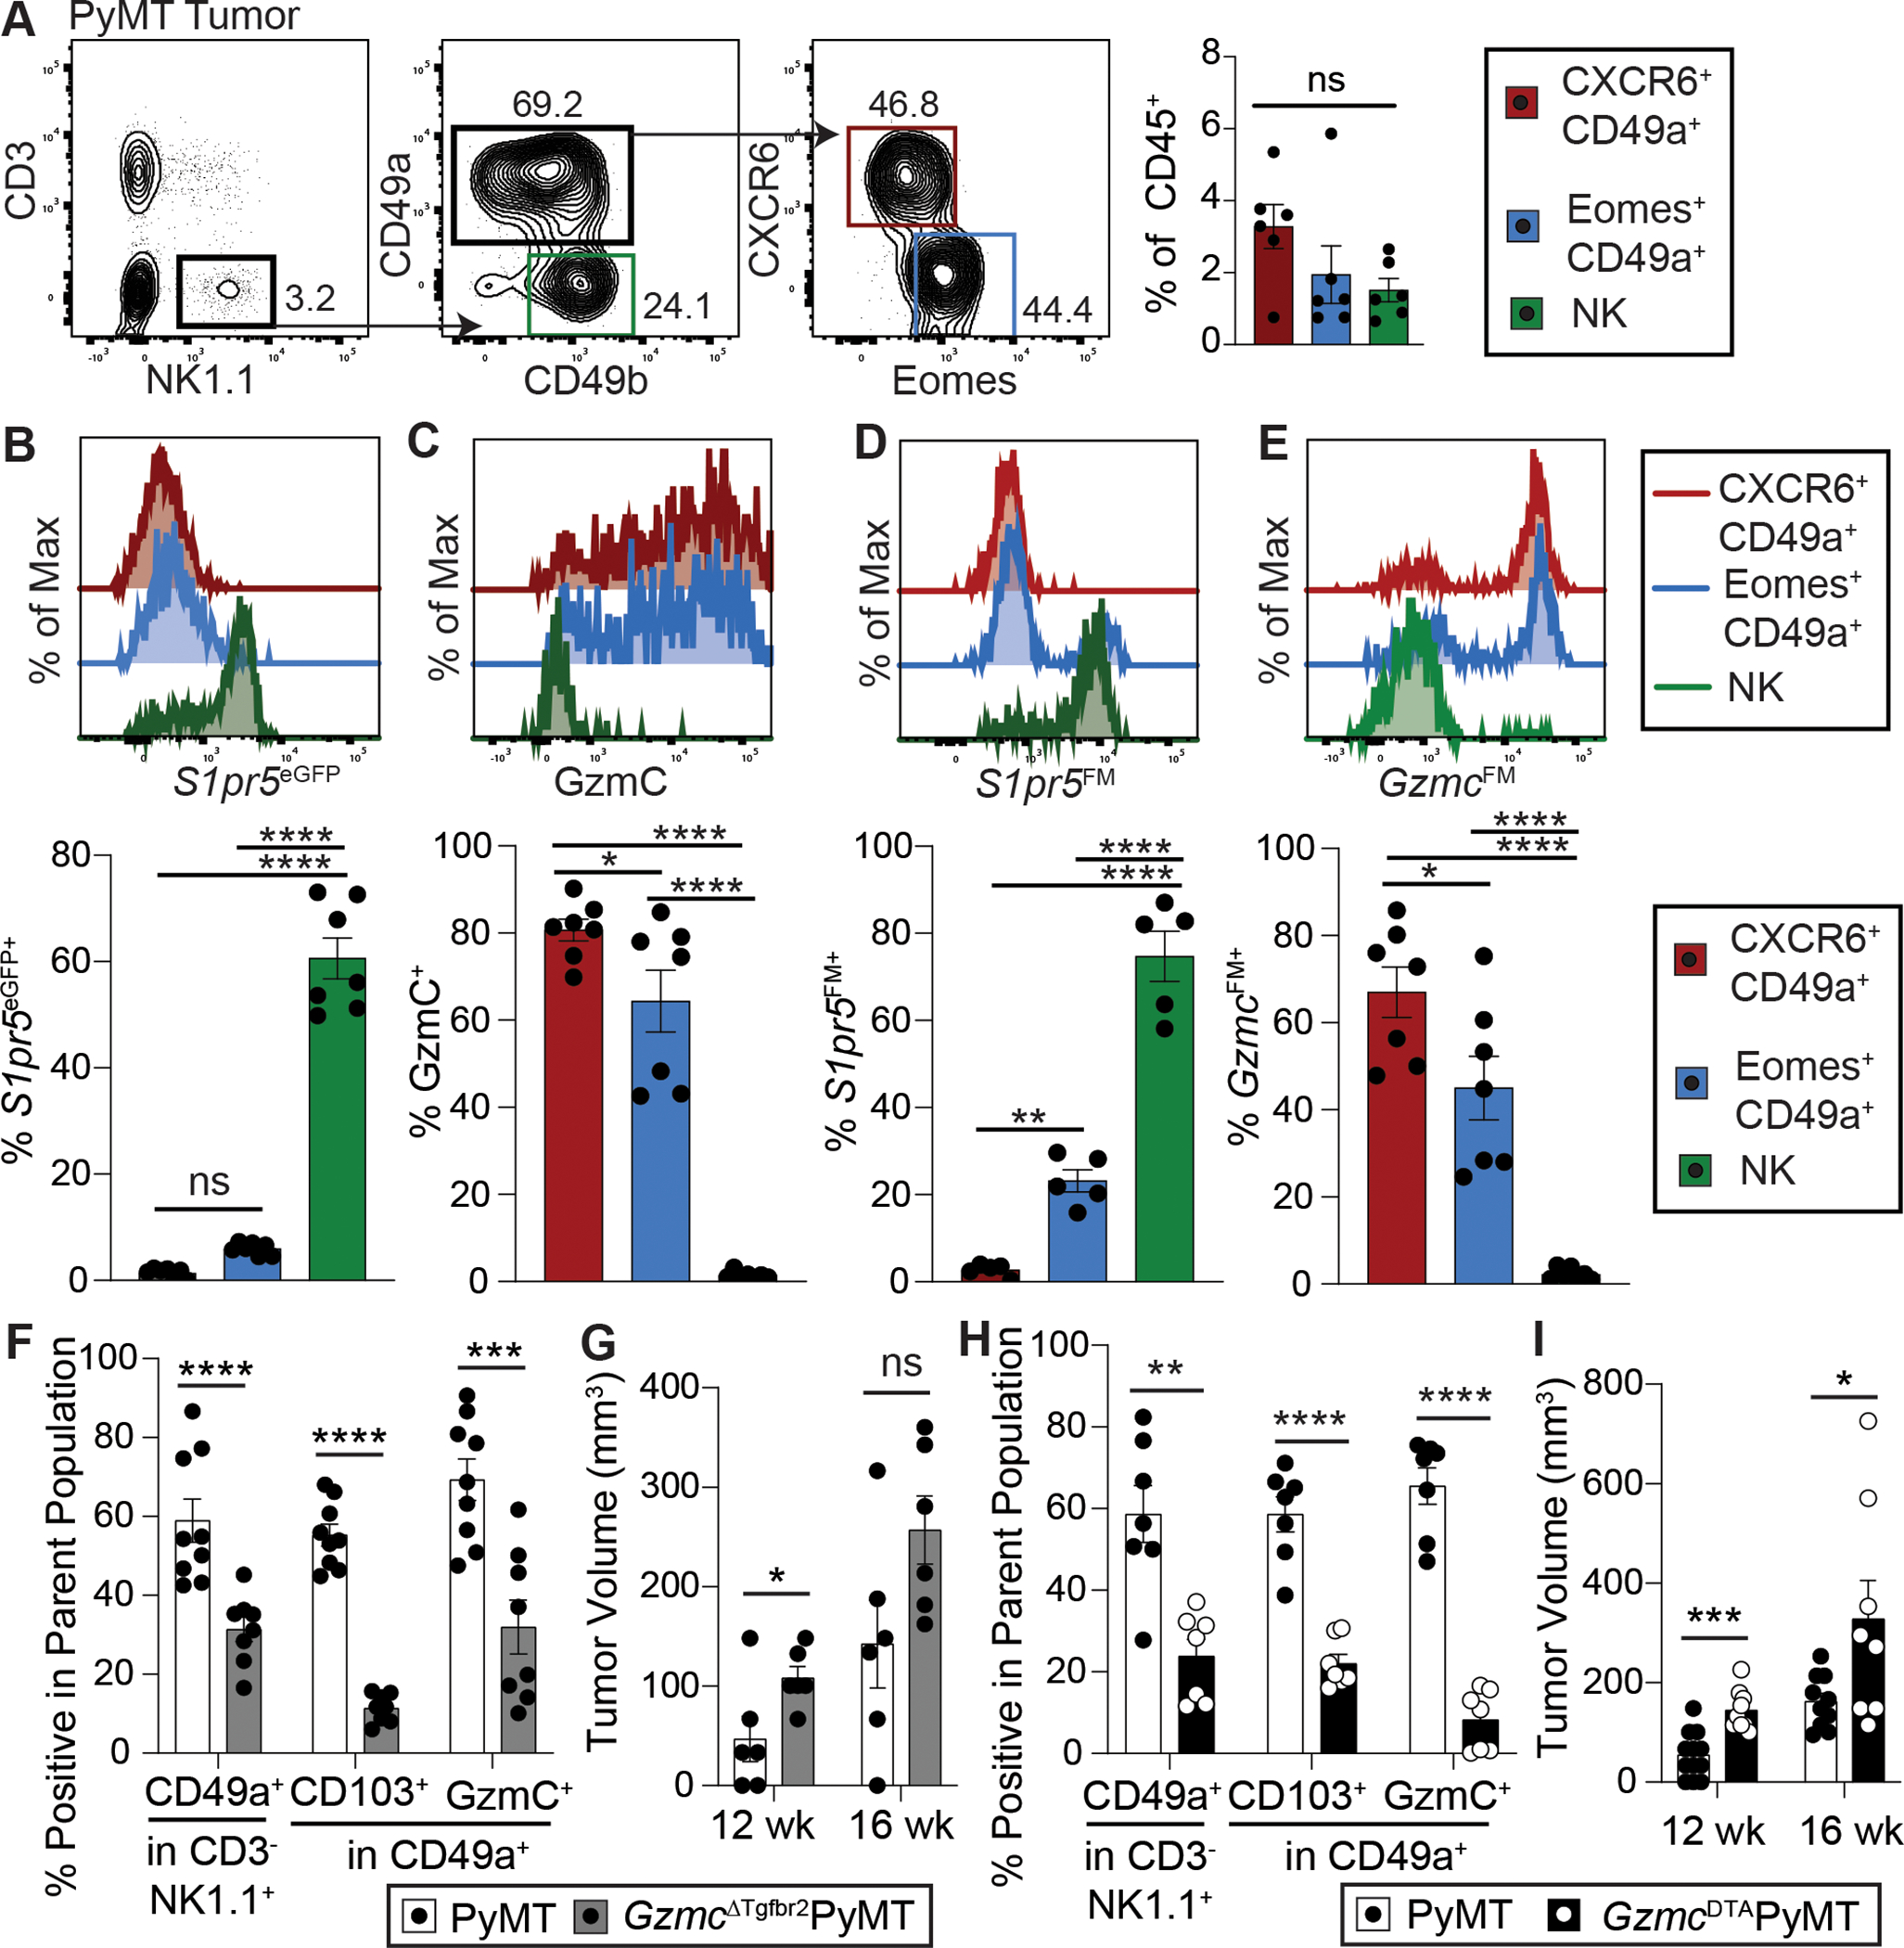
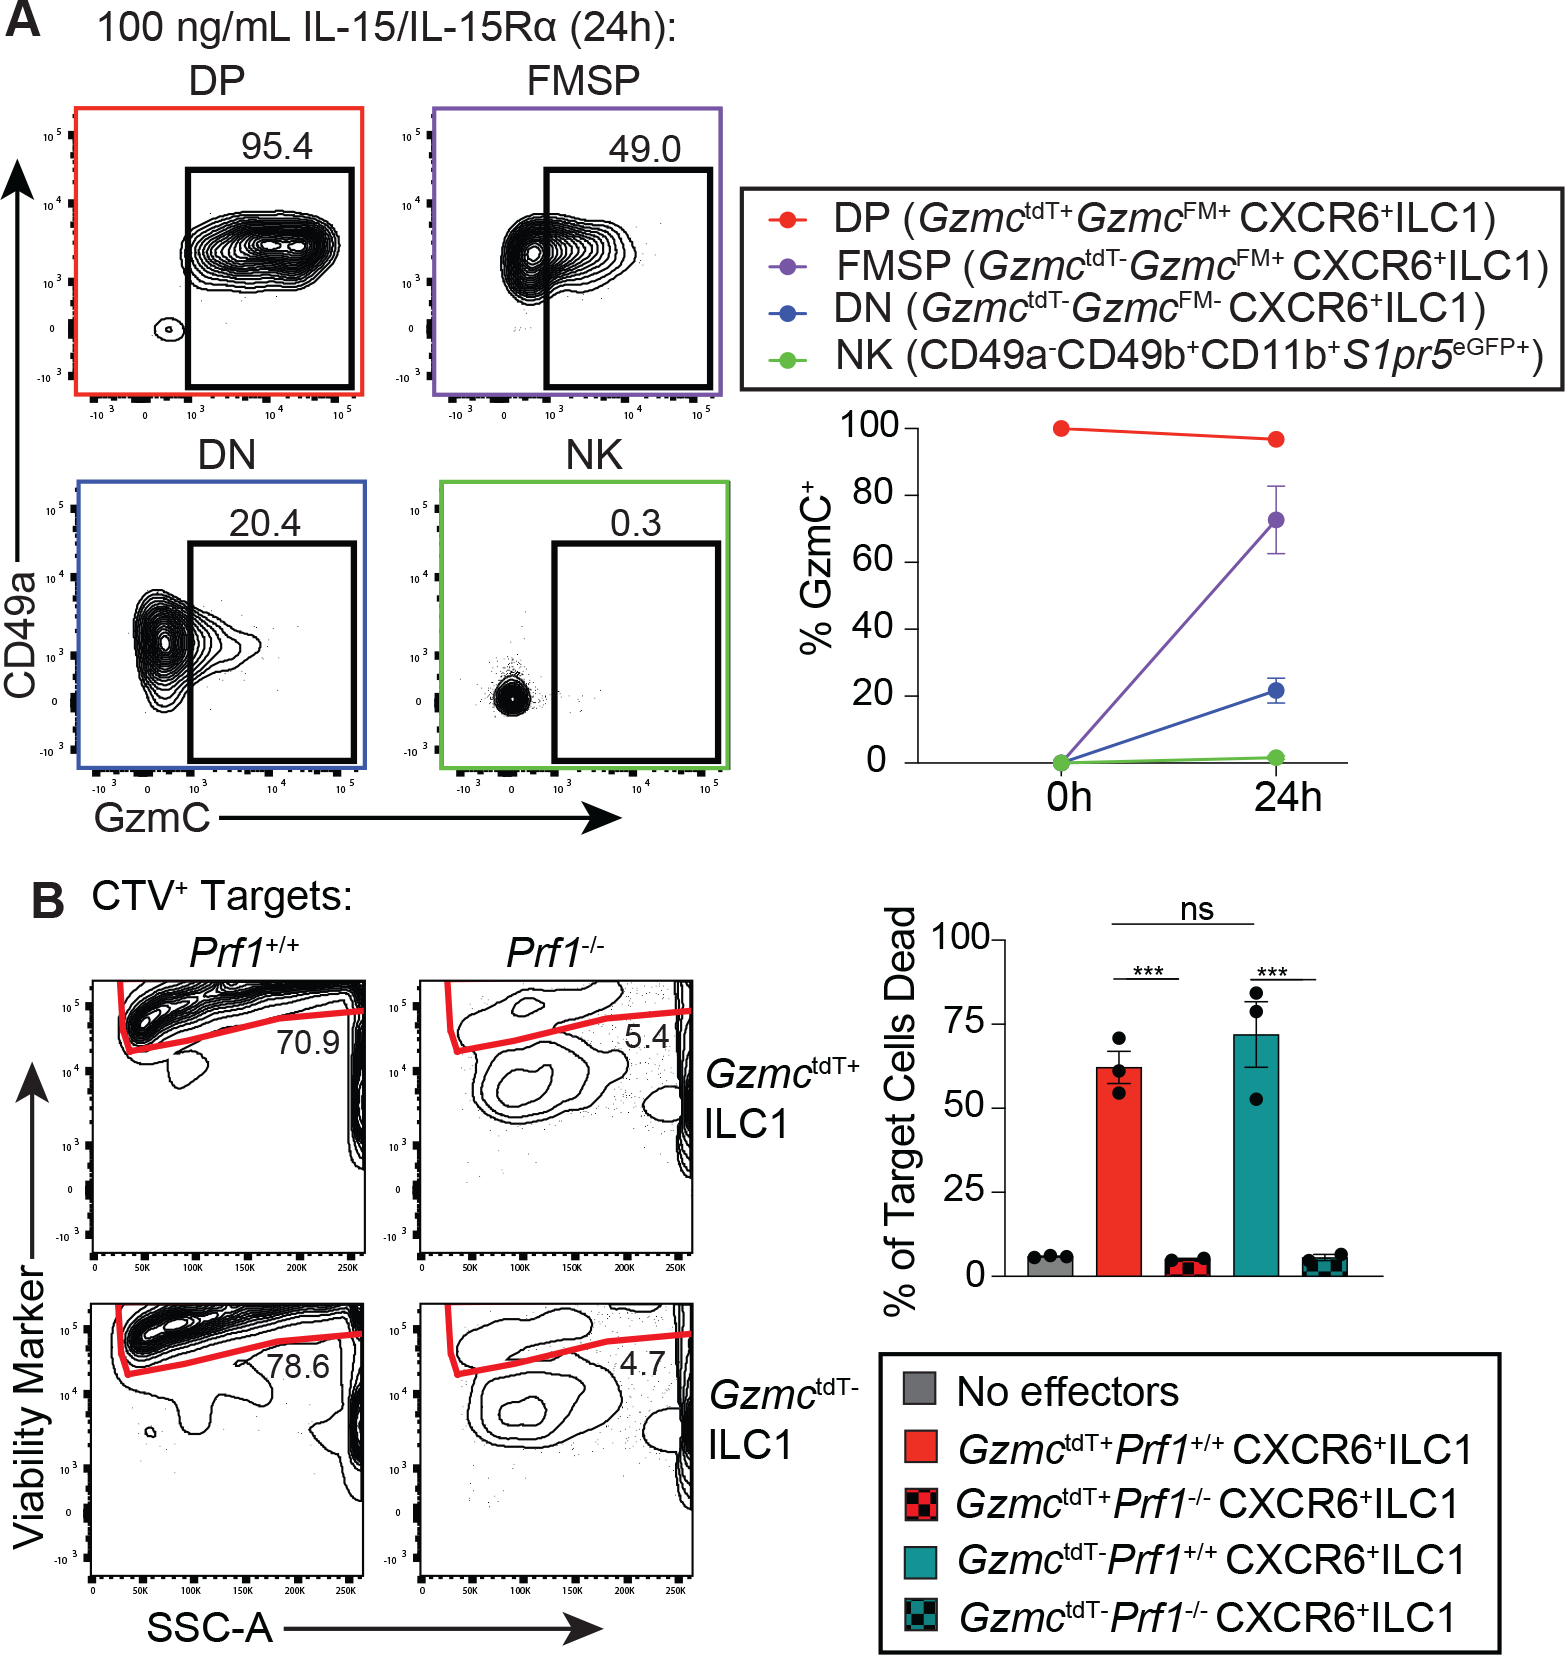
Innate lymphocytes are integral components of the cellular immune system that can coordinate host defense against a multitude of challenges and trigger immunopathology when dysregulated. Natural killer (NK) cells and innate lymphoid cells (ILCs) are innate immune effectors postulated to functionally mirror conventional cytotoxic T lymphocytes and helper T cells, respectively. Here, we showed that the cytolytic molecule granzyme C was expressed in cells with the phenotype of type 1 ILCs (ILC1s) in mouse liver and salivary gland. Cell fate-mapping and transfer studies revealed that granzyme C-expressing innate lymphocytes could be derived from ILC progenitors and did not interconvert with NK cells, ILC2s, or ILC3s. Granzyme C defined a maturation state of ILC1s. These granzyme C-expressing ILC1s required the transcription factors T-bet and, to a lesser extent, Eomes and support from transforming growth factor-β (TGF-β) signaling for their maintenance in the salivary gland. In a transgenic mouse breast cancer model, depleting ILC1s caused accelerated tumor growth. ILC1s gained granzyme C expression following interleukin-15 (IL-15) stimulation, which enabled perforin-mediated cytotoxicity. Constitutive activation of STAT5, a transcription factor regulated by IL-15, in granzyme C-expressing ILC1s triggered lethal perforin-dependent autoimmunity in neonatal mice. Thus, granzyme C marks a cytotoxic effector state of ILC1s, broadening their function beyond "helper-like" lymphocytes.


Conflict of interest statement

Competing Interests:

MSKCC has filed a patent application with the U.S. Patent and Trademark Office directed toward targeting ILC1 IL-15 signaling for cancer immunotherapy. MOL is an SAB member of and holds equity or stock options in Amberstone Biosciences Inc. AYR is an SAB member of and holds equity or stock options in Sonoma Biotherapeutic, Surface Oncology, RAPT Therapeutics, and Vedanta Biosciences. He is an SAB member of BioInvent. A.Y.R. holds IP rights for therapeutic Treg cell depleting antibodies licensed to Takeda that is unrelated to the content of the present study.

Figures

Figure 1.
Figure 1.. S1pr5 and granzyme C mark subsets of circulating and tissue-resident group 1 innate lymphocytes, respectively.
A. Log fold change (LFC) of gene expression from microarray of liver (Liv) ILC1s versus Liv NK cells (y-axis) versus mean accessibility LFC for Liv ILC1s versus Liv NK cells. Genes with significant differentially accessible peaks are included; genes with significant differential expression are shown in black, red (enriched in ILC1) or green (enriched in NK cell), and genes without significant differential expression are shown in gray. B. Gene accessibility tracks for S1pr5 and Gzmc, displaying average peaks for splenic (Spl) NK cell, Liv NK cell, Liv ILC1, and salivary gland (SG) ILC1, which had differential accessibility between overall ILC1 and NK cell as well as differential gene expression between Liv ILC1 and Liv NK cell. Differentially accessible peaks, as listed in Table S1, are highlighted in the red box. C. Representative histograms (left) and quantification (right) of CD49b, CD11b, KLRG1, CD49a, CD103, CXCR6, CD127, CD200R1, CD69, Eomes, Tbet, and IFN-γ expression in Spl, Liv, and SG S1pr5eGFP-positive or granzyme C (GzmC)-positive CD3NK1.1+NKp46+ cells of S1pr5eGFP-iCre mice, or fluorescence minus one (FMO) staining. Each dot represents one mouse, 3–12 mice per group. All data are combined from three or more independent experiments and shown as mean +/− SEM (one-way ANOVA with Tukey’s multiple comparisons test, “ns” = not significant, * = p<0.05, ** = p<0.01, *** = p<0.001, **** = p<0.0001).
Figure 2.
Figure 2.. Granzyme C-expressing innate lymphocytes differentiate from ILCps, but not from NK cells, ILC2s, or ILC3s.
A. Experimental design for S1pr5 fate-mapper (S1pr5FM) chimeric mice. Expression of S1pr5FM and granzyme C (GzmC) in splenic (Spl), liver (Liv), and salivary gland (SG) CD3NK1.1+ cells. B. Expression of S1pr5FM in Liv and SG CXCR6+CD49a+, SG Eomes+CD49a+, and Liv CD49aCD49b+ NK cells from S1pr5FM chimeric mice. C. Experimental design for ILCp (LinCD127+α4β7+Flt3CD25PD-1+) transfer. Expression of CD49a and GzmC in Liv ILCp-derived CD3NK1.1+NKp46+ cells. D. Experimental design for IL-5 fate-mapper (Il5FM) mice. Expression of Il5FM and GzmC in Liv, SG, and small intestine lamina propria (SI LP) LinThy1.2+ and/or NK1.1+ innate lymphocytes. E. Experimental design for IL-17A fate-mapper (Il17aFM) mice. Expression of Il17aFM and GzmC in Liv, SG, and SI LP LinThy1.2+ and/or NK1.1+ innate lymphocytes. F. Experimental design for IL-22 fate-mapper (Il22FM) mice. Expression of Il22FM and GzmC in Liv, SG, and SI LP LinThy1.2+ and/or NK1.1+ innate lymphocytes. Each dot represents one mouse, n = 3–6 mice per group. All data are combined from three or more independent experiments and shown as mean +/− SEM (one-way ANOVA with Tukey’s multiple comparisons test, “ns” = not significant, * = p<0.05, ** = p<0.01, *** = p<0.001, **** = p<0.0001).
Figure 3.
Figure 3.. Granzyme C-expressing cells are not precursors for NK cells, ILC2s, or ILC3s.
A. Representative flow cytometric analysis (left) and quantification (right) of granzyme C (GzmC) and S1pr5eGFP expression in NK1.1+NKp46+ innate lymphocytes in livers of 0.5 day-, 7 day-, 14 day-old and adult (8–12 weeks of age) mice. B. Representative plots of Gzmctd-Tomato and CD49a expression in splenic (Spl) and liver (Liv) NK phenotype and Liv and salivary gland (SG) ILC1 phenotype cells of GzmctdT-T2A-iCre mice. C. Experimental design of granzyme C fate-mapper (GzmcFM) mice. D. Quantification of GzmcFM expression in NK and ILC1-phenotype cells in the Spl, Liv and SG. E. Expression of GzmcFM and IL-5 in Liv, SG, and small intestine lamina propria (SI LP) LinThy1.2+ and/or NK1.1+ innate lymphocytes after four-hour PMA/Ionomycin/Golgi stop treatment. F. Expression of GzmcFM and IL-17A in Liv, SG, and SI LP LinThy1.2+ and/or NK1.1+ innate lymphocytes after four-hour PMA/Ionomycin/Golgi stop treatment. G. Expression of GzmcFM and IL-22 in Liv, SG, and SI LP LinThy1.2+ and/or NK1.1+ innate lymphocytes after four-hour PMA/Ionomycin/Golgi stop treatment. Each dot represents one mouse, n = 3–10 mice per group. All data are combined from three or more independent experiments and shown as mean +/− SEM (one-way ANOVA with Tukey’s multiple comparisons test, “ns” = not significant, * = p<0.05, ** = p<0.01, *** = p<0.001, **** = p<0.0001).
Figure 4.
Figure 4.. Differential regulation of ILC1 populations across tissues by T-bet, Eomes and TGF-β.
A. Representative (left) flow cytometric analysis of granzyme C (GzmC) and CD49a expression among NK1.1+CD3 cells in the liver (upper) and salivary gland (lower) of wild-type (WT), GzmCiCreTbx21fl/fl (GzmcΔTbx21) (yellow), GzmCiCreEomesfl/fl (GzmcΔEomes) (green), and GzmCiCreTbx21fl/flEomesfl/fl (GzmcΔTbx21Δeomes) (blue) mice. (Right) abundance of GzmC+NK1.1+CD3 (GzmC+) and CD49a+NK1.1+CD3 (ILC1) cells out of total CD45+ cells in liver and salivary gland. B. Representative (left) and quantification (right) of flow cytometric analysis of group 1 innate lymphocytes in liver (upper) and salivary gland (lower) of WT (white bar) and GzmCiCreTgfbr2fl/fl (GzmcΔTgfbr2) (gray bar) mice, quantifying CD49a+ cells among NK1.1+CD3 cells and CD103+ and GzmC+ cells among CD49a+NK1.1+CD3 cells in each organ. Each dot represents one mouse (n = 4–10 mice per group). All data are combined from three or more independent experiments and shown as mean +/− SEM (unpaired student’s t-test for two groups, one-way ANOVA with Tukey’s multiple comparisons test with more than two groups, “ns” = not significant, * = p<0.05, ** = p<0.01, *** = p<0.001, **** = p<0.0001).
Figure 5.
Figure 5.. Granzyme C-expressing ILC1s expand and mediate cancer immunosurveillance in the PyMT model of breast cancer
A. Abundance of CXCR6+CD49a+NK1.1+CD3 (CXCR6+CD49a+), Eomes+CD49a+NK1.1+CD3 (Eomes+CD49a+) and CD49aCD49b+NK1.1+CD3 (NK) cells out of total CD45+ cells in PyMT tumors. Expression of S1pr5eGFP (B), granzyme C (GzmC) (C), S1pr5FM (D), and GzmcFM (E) in CXCR6+CD49a+ ILC1 (red), Eomes+CD49a+ ILC1 (blue), and CD49aCD49b+ NK cell (green) populations in PyMT tumors of S1pr5eGFPPyMT (B), PyMT (C), S1pr5FMPyMT chimera (D), and GzmcFMPyMT (E) mice. F. Abundance of ILC1s in tumors of PyMT (white bar) and GzmCiCreTgfbr2fl/flPyMT (GzmcΔTgfbr2PyMT) (gray bar) mice, quantifying CD49a+ cells among NK1.1+CD3 cells and CD103+ and GzmC+ cells among CD49a+NK1.1+CD3 cells in the tumor. G. Tumor volume at 12 and 16 weeks of age from PyMT (white bar) and GzmcΔTgfbr2PyMT (gray bar) mice. H. Abundance of ILC1s in tumors of PyMT (white bar) and GzmCiCreRosa26LSL-DTA/+ PyMT (GzmcDTAPyMT) (black bar) mice, quantifying CD49a+ cells among NK1.1+CD3 cells and CD103+ and GzmC+ cells among CD49a+NK1.1+CD3 cells in the tumor. I. Tumor volume at 12 and 16 weeks of age from PyMT (white bar) and GzmcDTAPyMT (black bar) mice. Each dot represents one mouse (n = 5–9 mice per group). All data are combined from three or more independent experiments and shown as mean +/− SEM (unpaired student’s t-test for two groups, one-way ANOVA with Tukey’s multiple comparisons test with more than two groups, “ns” = not significant, * = p<0.05, ** = p<0.01, *** = p<0.001, **** = p<0.0001).
Figure 6.
Figure 6.. ILC1s broadly express cytotoxic molecules and granzyme C expression marks a mature effector state.
A. Representative (upper) and quantification (lower) of granzyme B (GzmB) and perforin expression among splenic (Spl) and liver (Liv) NK cells as well as Liv and salivary gland (SG) ILC1s. B. Representative and quantification of GzmB and perforin protein expression among subsets of ILC1s in Liv (upper) and SG (lower) based on current and history of granzyme C expression (GzmCGzmcFM−, double-negative [DN], blue; GzmCGzmcFM+, fate-mapped single positive [FMSP], purple; GzmC+GzmcFM+, double positive [DP], red). C. The number of differentially expressed genes in each of six pairwise comparisons conducted between the four sequenced populations. The color indicates direction of higher expression. D. 62 of 74 genes significantly differentially expressed between DP and DN ILC1s with higher expression in DP, grouped by function and localization. 12 genes could not be grouped due to unknown cellular localization of the proteins they encode and are listed in Table S3. Each dot represents one mouse (n = 4–5 mice per group). Flow cytometry data are combined from three or more independent experiments and shown as mean +/− SEM (one-way ANOVA with Tukey’s multiple comparisons test, “ns” = not significant, * = p<0.05, ** = p<0.01, *** = p<0.001, **** = p<0.0001).
Figure 7.
Figure 7.. CXCR6+ ILC1s from liver can mediate perforin-dependent cytotoxicity regardless of initial granzyme C expression.
A. Expression of granzyme C (GzmC) in group 1 innate lymphocyte subsets sorted based on expression of GzmC protein and/or GzmcFM and cultured in 100 ng/mL IL-15/IL-15Rα for 24 hours (h). Sorted populations included DP (CD49a+CXCR6+GzmctdT+GzmcFM+) (red), FMSP (CD49a+CXCR6+GzmctdT−GzmcFM+) (purple), DN (CD49a+CXCR6+GzmctdT−GzmcFM−) (blue), and NK (CD49aCD49b+CD11b+) (green) cell subsets. Data are combined from four independent experiments. B. Killing assay, displaying death rate of RMA-S target cells after coincubation with subsets of CXCR6+ ILC1s from the liver. Effector cells were either GzmctdT+ or GzmctdT− ILC1s (CXCR6+CD49a+NK1.1+CD3) and were sorted from the livers of GzmctdT-T2A-iCre/+Prf1+/+ or GzmctdT-T2A-iCre/+Prf1−/− mice. Effectors were expanded in 100 ng/mL IL-15/IL-15Rα and cocultured with CTV-labeled RMA-S target cells for 16h at a 10:1 effector:target ratio in media supplemented with 100 ng/mL IL-15/IL-15Rα. Data are representative from one of three independent experiments. Each dot represents one mouse (n = 3–6 mice per group). All data are shown as mean +/− SEM (one-way ANOVA with Tukey’s multiple comparisons test for more than two groups, “ns” = not significant, * = p<0.05, ** = p<0.01, *** = p<0.001, **** = p<0.0001).
Figure 8.
Figure 8.. Constitutively active IL-15 signaling in granzyme C-expressing ILC1s causes perforin-dependent lethal autoimmunity.
A. Granzyme C (GzmC) expression in liver (Liv) and salivary gland (SG) CD3NK1.1+NKp46+ cells of wild-type (WT) and Il15−/− mice. B. Experimental design of GzmcStat5b-CA mice. C. Kaplan-Meier survival curves for GzmcStat5b-CA/+, GzmcStat5b-CA/+Rag1−/−, and littermate control mice. D. GzmC+NK1.1+NKp46+ cells per gram of Liv tissue from seven-day-old WT and GzmcStat5b-CA/+ mice. E. Representative images of hematoxylin and eosin staining (H&E, first row) and NKp46 (second row) and cleaved caspase 3 (CC3, third row) immunoreactivities (indicated by arrows) of Liv sections from 14-day-old WT, GzmcStat5b-CA/+, and GzmcStat5b-CA/+Prf1−/− mice. Images and inserts are 200X and 400X, respectively. NKp46 and CC3 immunoreactivity was also quantified on serial sections as percent of total tissue using digital pathology software (Halo). Scale bar indicates 100 μm. F. Kaplan-Meier survival curves for GzmcStat5b-CA/+ and GzmcStat5b-CA/+Prf1−/− littermate control mice (n = 15–18 per group). Each dot represents one mouse; A, D, E: n = 3–4 mice per group, C: n = 7–18 per group, F: n = 15–18 mice per group. All data are combined from three or more independent experiments and shown as mean +/− SEM (A, D, E: one-way ANOVA with Tukey’s multiple comparisons test, C, F: Log-rank [Mantel Cox] test; “ns” = not significant, * = p<0.05, ** = p<0.01, *** = p<0.001, **** = p<0.0001)

Comment in

  • ILC killer: Qu'est-ce que c'est?
    Withers DR, Hepworth MR. Withers DR, et al. Sci Immunol. 2022 Apr 8;7(70):eabo2159. doi: 10.1126/sciimmunol.abo2159. Epub 2022 Apr 8. Sci Immunol. 2022. PMID: 35394813

References

    1. Fan X, Rudensky AY, Hallmarks of Tissue-Resident Lymphocytes. Cell 164, 1198–1211 (2016). - PMC - PubMed
    1. Vivier E, Artis D, Colonna M, Diefenbach A, Di Santo JP, Eberl G, Koyasu S, Locksley RM, McKenzie ANJ, Mebius RE, Powrie F, Spits H, Innate Lymphoid Cells: 10 Years On. Cell 174, 1054–1066 (2018). - PubMed
    1. Dadi S, Chhangawala S, Whitlock BM, Franklin RA, Luo CT, Oh SA, Toure A, Pritykin Y, Huse M, Leslie CS, Li MO, Cancer Immunosurveillance by Tissue-Resident Innate Lymphoid Cells and Innate-like T Cells. Cell 164, 365–377 (2016). - PMC - PubMed
    1. Friedrich C, Taggenbrock R, Doucet-Ladeveze R, Golda G, Moenius R, Arampatzi P, Kragten NAM, Kreymborg K, Gomez de Aguero M, Kastenmuller W, Saliba AE, Grun D, van Gisbergen K, Gasteiger G, Effector differentiation downstream of lineage commitment in ILC1s is driven by Hobit across tissues. Nat Immunol 22, 1256–1267 (2021). - PMC - PubMed
    1. Di Censo C, Marotel M, Mattiola I, Muller L, Scarno G, Pietropaolo G, Peruzzi G, Laffranchi M, Mazej J, Hasim MS, Asif S, Russo E, Tomaipitinca L, Stabile H, Lee SH, Vian L, Gadina M, Gismondi A, Shih HY, Mikami Y, Capuano C, Bernardini G, Bonelli M, Sozzani S, Diefenbach A, Ardolino M, Santoni A, Sciume G, Granzyme A and CD160 expression delineates ILC1 with graded functions in the mouse liver. Eur J Immunol 51, 2568–2575 (2021). - PMC - PubMed

Publication types