. 2022 Apr 8;8(14):eabk0942.
doi: 10.1126/sciadv.abk0942. Epub 2022 Apr 8.

Mutation of SLC7A14 causes auditory neuropathy and retinitis pigmentosa mediated by lysosomal dysfunction

Affiliations

Mutation of SLC7A14 causes auditory neuropathy and retinitis pigmentosa mediated by lysosomal dysfunction

Kimberlee P Giffen et al. Sci Adv. .

Abstract

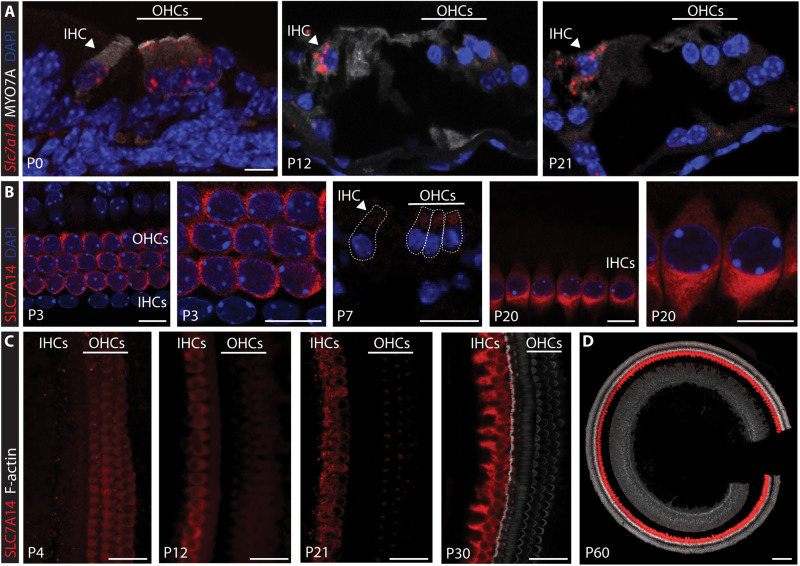
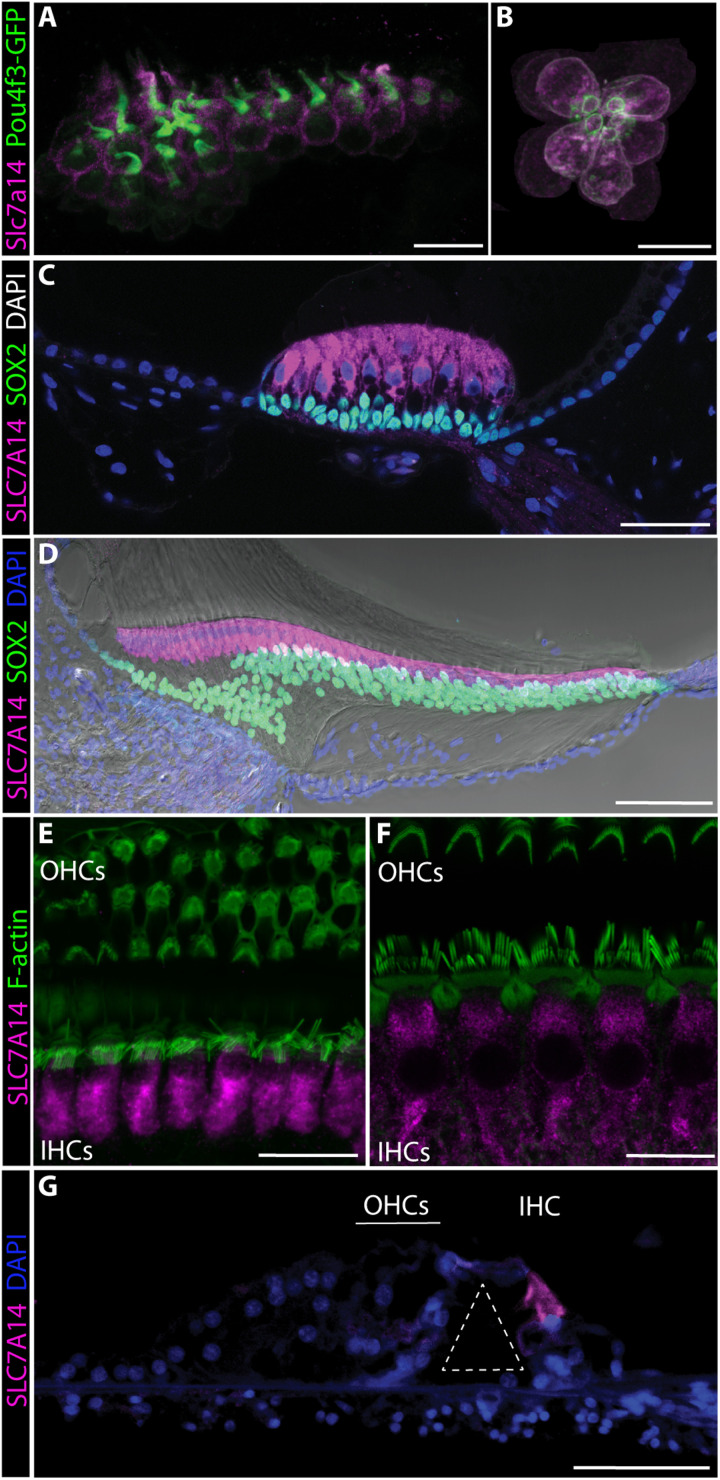
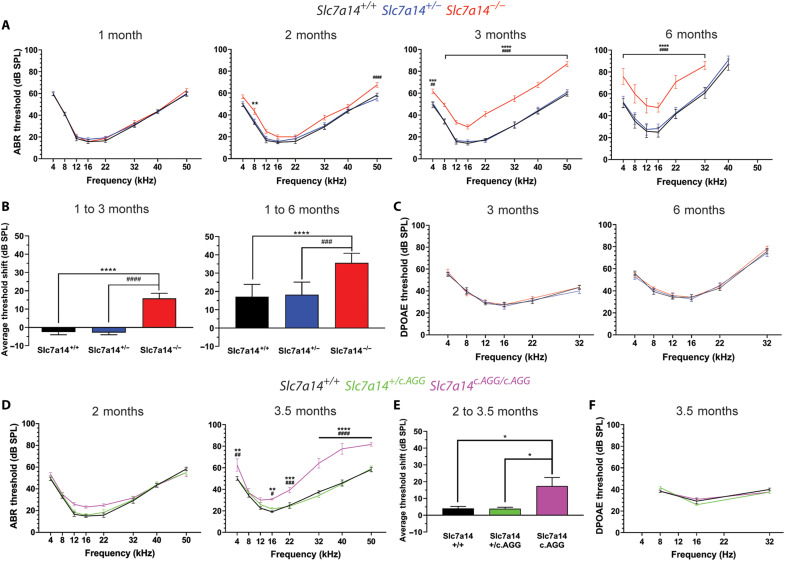
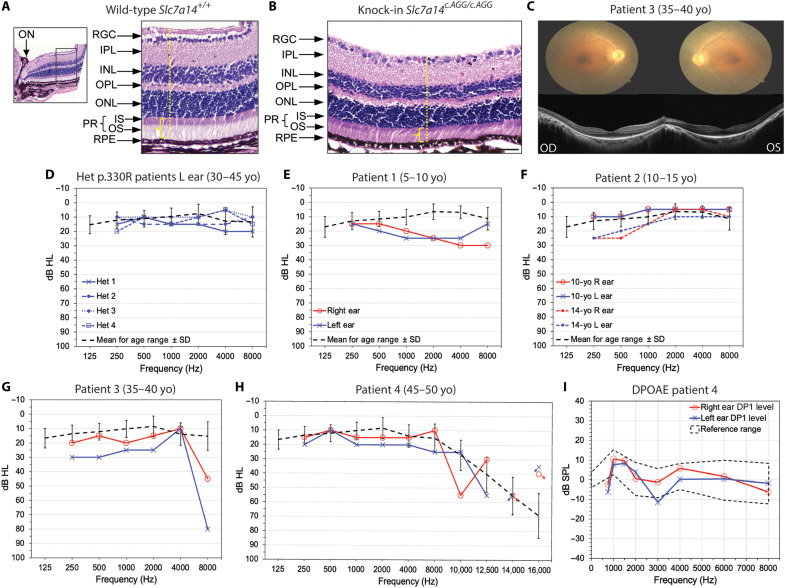
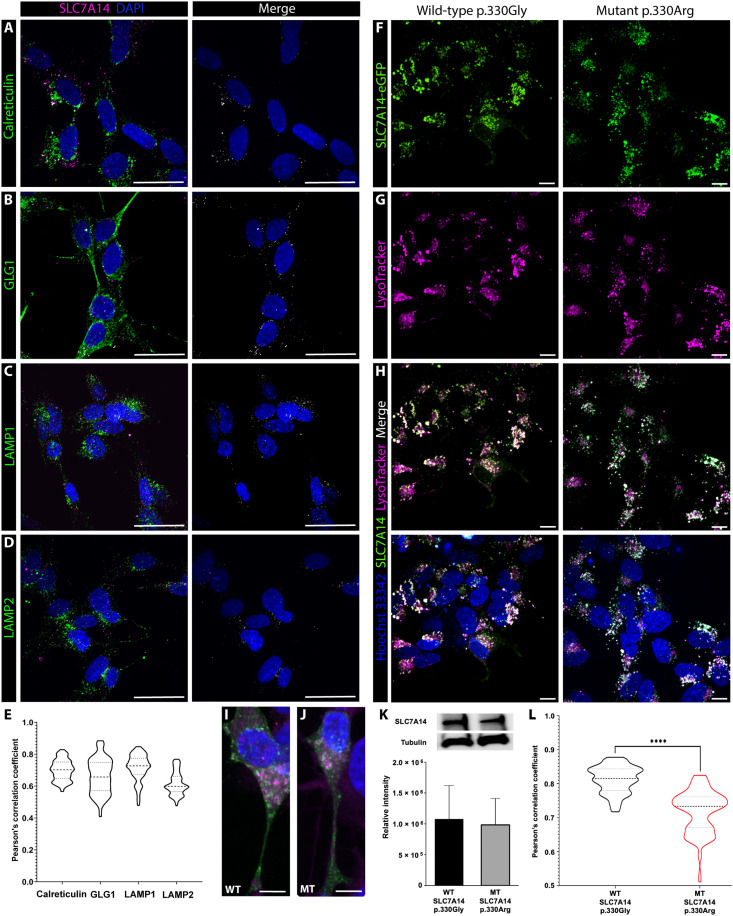
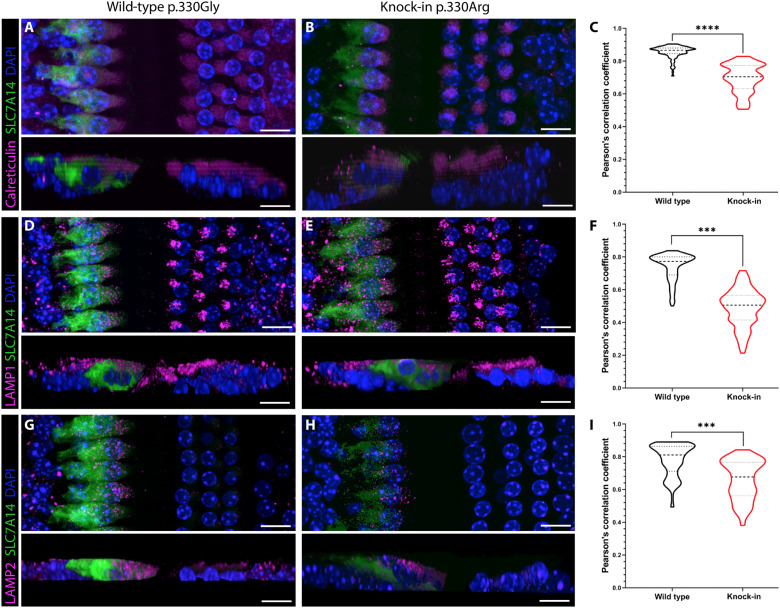
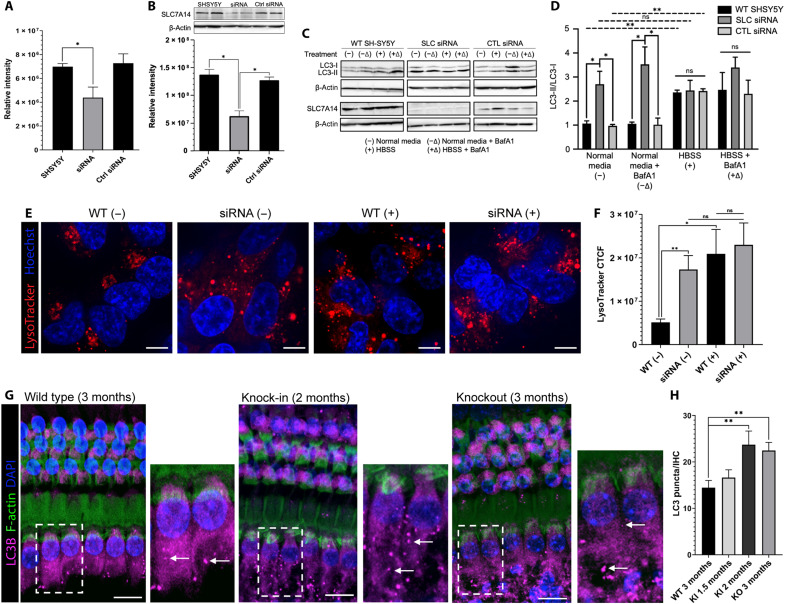
Lysosomes contribute to cellular homeostasis via processes including macromolecule degradation, nutrient sensing, and autophagy. Defective proteins related to lysosomal macromolecule catabolism are known to cause a range of lysosomal storage diseases; however, it is unclear whether mutations in proteins involved in homeostatic nutrient sensing mechanisms cause syndromic sensory disease. Here, we show that SLC7A14, a transporter protein mediating lysosomal uptake of cationic amino acids, is evolutionarily conserved in vertebrate mechanosensory hair cells and highly expressed in lysosomes of mammalian cochlear inner hair cells (IHCs) and retinal photoreceptors. Autosomal recessive mutation of SLC7A14 caused loss of IHCs and photoreceptors, leading to presynaptic auditory neuropathy and retinitis pigmentosa in mice and humans. Loss-of-function mutation altered protein trafficking and increased basal autophagy, leading to progressive cell degeneration. This study implicates autophagy-lysosomal dysfunction in syndromic hearing and vision loss in mice and humans.


Figures

Fig. 1.
Fig. 1.. Expression of Slc7a14/SLC7A14 in developing mouse organ of Corti.
(A) RNAscope smFISH of Slc7a14 (red probe) in developing mouse organ of Corti, with IHCs and OHCs identified on the basis of MYO7A expression and indicated labels. Scale bar, 10 μm. (B) SLC7A14 expression in mouse (C57BL/6) OHCs observed at P3 and P7 and distinctive expression in IHCs at P20. Scale bars, 10 μm. (C) Immunofluorescent labeling of SLC7A14 in wild-type IHCs and OHCs from P4 to P30. Scale bars, 20 μm. (D) Expression of SLC7A14 observed in mature P60 IHCs. Scale bar, 100 μm.
Fig. 2.
Fig. 2.. Conserved expression of SLC7A14 orthologs among vertebrate sensory hair cells.
SLC7A14 labeled by immunofluorescence in (A) zebrafish saccule and (B) neuromast hair cells (72 hours postfertilization; scale bars, 10 μm); (C) turtle auditory papilla hair cells (adult; scale bar, 20 μm); (D) chicken basilar papilla hair cells (7 days posthatch; scale bar, 50 μm); (E) mouse cochlear hair cells (P60; scale bar, 20 μm); (F) rat cochlear hair cells (P20; scale bar, 20 μm); and (G) adult human cochlear IHC (tunnel of Corti identified by dashed white line) (scale bar, 50 μm).
Fig. 3.
Fig. 3.. Measurement of auditory function in Slc7a14 KO and KI mice.
(A) ABR threshold measurements of Slc7a14+/+ (black line), Slc7a14+/− (blue line), and Slc7a14−/− (KO, red line) mice at 1, 2, 3, and 6 months of age (n = 6). (B) ABR threshold shifts at 3 and 6 months, compared to 1-month baseline. (C) DPOAE threshold measurements of Slc7a14+/+, Slc7a14+/−, and Slc7a14−/− mice at 3 and 6 months (n = 6). (D) ABR thresholds of Slc7a14+/+ (black line), Slc7a14+/c.AGG (green), and Slc7a14c.AGG/c.AGG (KI, magenta line) mice at 2 months (n = 6) and 3.5 months of age (n = 6). (E) ABR threshold shifts in KI mice at 3.5 months compared to 2-month baseline. (F) DPOAE threshold measurements in Slc7a14+/+, Slc7a14+/ c.AGG, and Slc7a14c.AGG/c.AGG mice at 3.5 months (n WT = 6 and KI = 6). Means from the indicated number of biological repeats were statistically compared by two-way analysis of variance (ANOVA) with repeated measures, followed by post hoc analysis with Tukey’s multiple comparisons test (α = 0.05). Symbols: Wild type to KO/KI, *P < 0.05, **P < 0.005, ***P < 0.0005, and ****P < 0.0001; heterozygous to KO/KI, #P < 0.05, ##P < 0.005, ###P < 0.0005, and ####P < 0.0001; error bars, ±SE. SPL, sound pressure level.
Fig. 4.
Fig. 4.. Morphology of KO and KI mouse cochlear hair cells.
SEM of 3-month-old cochleae (low apical turn). (A) Wild-type IHC and OHC bundles with no signs of degeneration or absent bundles. Scale bars, 50, 10, and 5 μm. (B and C) Slc7a14−/− (KO) cochlea; yellow arrows indicate absent IHC bundles. Scale bars, 50 and 10 μm. (D) Representative images of KO IHC and (E) OHC stereocilia bundles. Scale bars, 5 μm. (F and G) Slc7a14c.AGG/c.AGG (KI) cochlea; yellow arrows indicate absent IHC bundles. Scale bars, 50 and 10 μm. (H) Representative images of KI IHC and (I) OHC stereocilia bundles. Scale bars, 5μm. Immunofluorescence of wild-type and KI mouse cochlea at 2 and 3 months. (J) Low apical turn region. Scale bars, 20 μm. (K) Whole-mount images of low apical turn hair cells; white arrows indicate absent IHCs. Scale bars, 10 μm.
Fig. 5.
Fig. 5.. Syndromic phenotype associated with SLC7A14 loss-of-function mutation.
(A and B) Hematoxylin and eosin–stained retinal cross sections from 3.5-month-old wild-type and homozygous KI mice. Inset in (A) shows location of images, medial to the optic nerve (ON). Decreased retinal thickness (yellow dotted line) and thinning of the photoreceptor layer (yellow bracket) were observed in KI mouse retina. Retinal layers: RGC, retinal ganglion cells; IPL, inner plexiform layer; INL, inner nuclear layer; OPL, outer plexiform layer; ONL, outer nuclear layer; PR, photoreceptor layer; IS and OS, inner segment and outer segment of rods and cones; RPE, retinal pigment epithelium. Scale bars, 50 μm. (C) Fundoscopic images and OCT scans of the retinas of patient 3, previously diagnosed with RP. (D) Audiogram measurements (left ear) of four heterozygous SLC7A14 c.988G<A patients aged 30 to 45 years. Threshold levels are shown in decibels in hearing level (dB HL), with the age-matched mean dB HL shown for comparison (±SD). (E to H) Audiogram measurements of four probands with homozygous SLC7A14 c.988G<A mutation. Threshold levels are shown in dB HL, with the age-matched mean dB HL shown for comparison (±SD). (E) Patent 1: 5 to 10 years old (yo). (F) Patient 2: 10 to 15 years old; audiogram measurements at two time points, 4 years apart, are shown. (G) Patient 3: 35 to 40 years old. (H) Patient 4: 45 to 50 years old; disconnected data points with arrow indicate no response. (I) Representative DPOAE measurement (patient 4). F1 level, 65 dB; F2 level, 55 dB; normal range outlined in black. L, left; R, right.
Fig. 6.
Fig. 6.. Localization of wild-type and mutant SLC7A14 in SH-SY5Y cells.
Immunofluorescence of SH-SY5Y cells shows colocalization of endogenous SLC7A14 and (A) calreticulin to label the endoplasmic reticulum, (B) GLG1 to label the Golgi body, and (C) LAMP1 and (D) LAMP2 to label lysosomes. Scale bars, 10 μm. (E) Violin plot of colocalization of each respective organelle membrane label and SLC7A14 quantified by PCC. Mean individual PCC values for >100 z-stack images (n = 3 technical replicates per label) were compared by one-way ANOVA, and no statistically significant difference among samples was detected (P > 0.05). (F to J) Live SH-SY5Y cells were transfected with (F) wild-type or mutant p.330Gly>Arg SLC7A14-eGFP plasmids and then incubated with (G) LysoTrackerRed99 to label lysosomes. Scale bars, 10μm. (H) Colocalization between SLC7A14-eGFP and LysoTracker shown in white; nuclei labeled with Hoechst 33342. Magnified images of cells expressing (I) wild-type or (J) mutant SLC7A14-eGFP. Scale bars, 10 μm. (K) SLC7A14 protein expression in cells transfected with wild-type or mutant plasmids. Normalized intensity, relative to α-tubulin, quantified by Western blot showed no significant difference in SLC7A14 expression between wild-type and mutant samples (n = 3), unpaired, two-tailed t test (α = 0.05). (L) Violin plots of measured overlap of green and red channels based on PCC. The mean PCC values for >125 z-stack images (n = 3 WT or MT transfected technical replicates) were analyzed by unpaired, two-tailed t test (α = 0.05); ****P < 0.00001.
Fig. 7.
Fig. 7.. Localization of SLC7A14 in wild-type and KI mouse IHCs.
Immunofluorescent labeling of SLC7A14 and respective organelle labels: (A and B) endoplasmic reticulum marker calreticulin, (D and E) lysosome label LAMP1, and (G and H) lysosome label LAMP2. Scale bars, 10 μm. (C, F, and I) Violin plots of PCC showing quantified colocalization of each organelle label in wild-type and KI IHCs. Statistical differences between mean PCC values from >85 z-stack images (n = 3 technical replicates per genotype) were determined by unpaired t test (α = 0.05). ***P < 0.0001; ****P < 0.00001.
Fig. 8.
Fig. 8.. Autophagy activity in SH-SY5Y cell line and cochlear IHCs.
(A) SLC7A14 mRNA expression quantified by RT-PCR after gene knockdown in untreated, SLC7A14 siRNA–, or control siRNA–treated SH-SY5Y cells. Relative intensity normalized to GAPDH control. Statistical differences in mean intensity (n = 3) determined by unpaired t test (α = 0.05). (B) SLC7A14 protein expression in untreated, siRNA-, and control siRNA–treated SH-SY5Y cells, following a 96-hour incubation, calculated as mean intensity (normalized to β-actin) (n = 3). Statistical differences determined by two-way ANOVA (α = 0.05). Representative Western blot image shown. (C) Following SLC7A14 protein knockdown, untreated, siRNA, and control siRNA samples were incubated in normal medium (−), normal medium plus inhibitor BafA1 (−Δ), HBSS starvation media (+), or HBSS starvation media plus inhibitor BafA1 (+Δ). Representative Western blot image from treated samples. Mean intensity normalized to β-actin (n = 3). (D) Calculated LC3-II/LC3-I ratios (n = 3) from quantified samples in (C) compared by two-way ANOVA with repeated measures, followed by post hoc analysis with Tukey’s multiple comparisons test (α = 0.05). (E) Live-cell confocal microscopy of untreated (WT) and siRNA-treated cells labeled with LysoTracker and Hoechst. Scale bars, 5 μm. (F) CTCF of LysoTracker label in samples represented in (E). Fluorescence quantified with ImageJ (n = 10). Statistical differences determined by unpaired, two-tailed t test (α = 0.05). (G) Representative images of mouse cochleae depicting autophagy activity, indicated by LC3 puncta (white arrows). Scale bars, 10 μm. (H) Mean LC3B puncta in wild-type, KI, and KO IHCs (n = 18 IHCs per genotype from two cochlea; low apical turn region) compared by unpaired, two-tailed t test (α = 0.05). P values shown as follows: *P < 0.05; **P < 0.005; ns, not statistically significant; error bars, ±SE.

Similar articles

Cited by

References

    1. Luzio J. P., Pryor P. R., Bright N. A., Lysosomes: Fusion and function. Nat. Rev. Mol. Cell Biol. 8, 622–632 (2007). - PubMed
    1. Settembre C., Fraldi A., Medina D. L., Ballabio A., Signals from the lysosome: A control centre for cellular clearance and energy metabolism. Nat. Rev. Mol. Cell Biol. 14, 283–296 (2013). - PMC - PubMed
    1. Li P., Gu M., Xu H., Lysosomal ion channels as decoders of cellular signals. Trends Biochem. Sci. 44, 110–124 (2019). - PMC - PubMed
    1. Platt F. M., d’Azzo A., Davidson B. L., Neufeld E. F., Tifft C. J., Lysosomal storage diseases. Nat. Rev. Dis. Primers. 4, 1–25 (2018). - PubMed
    1. Dallos P., The active cochlea. J. Neurosci. 12, 4575–4585 (1992). - PMC - PubMed

Substances

Supplementary concepts