. 2022 Apr 8;18(4):e1010458.
doi: 10.1371/journal.ppat.1010458. eCollection 2022 Apr.

Identification of a two-component regulatory system involved in antimicrobial peptide resistance in Streptococcus pneumoniae

Affiliations

Identification of a two-component regulatory system involved in antimicrobial peptide resistance in Streptococcus pneumoniae

Aissatou Maty Diagne et al. PLoS Pathog. .

Abstract

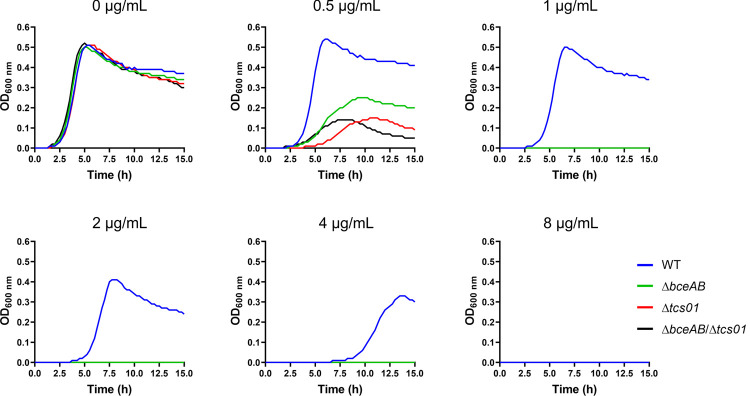
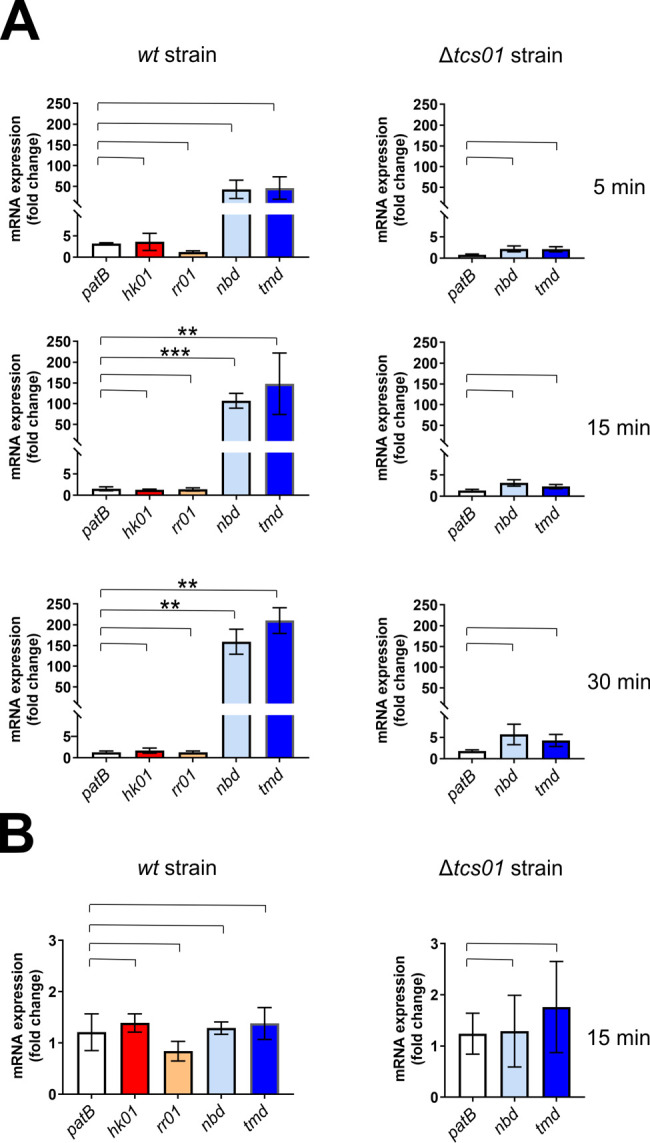
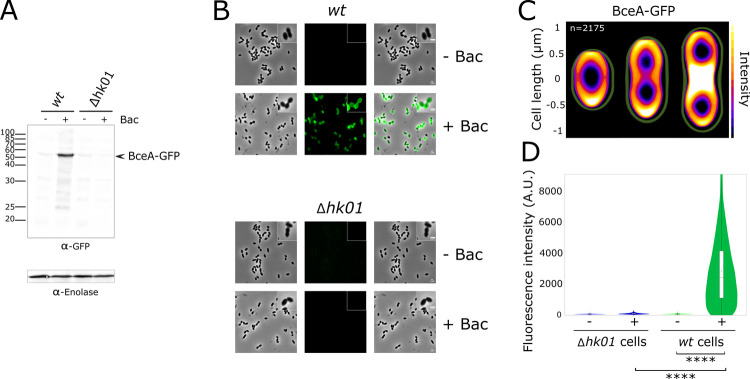
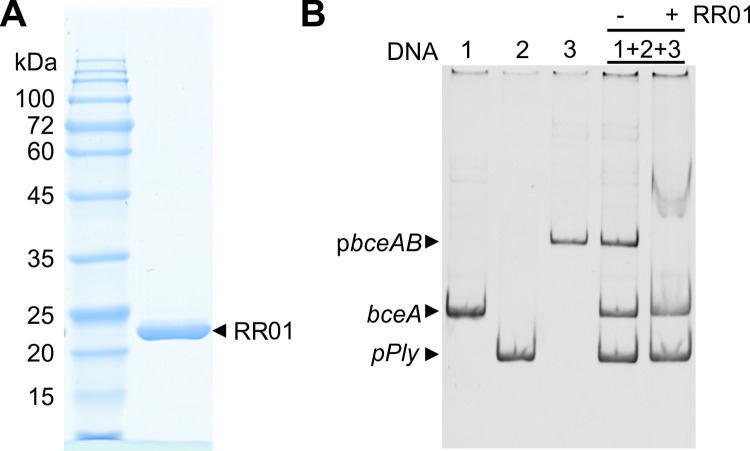
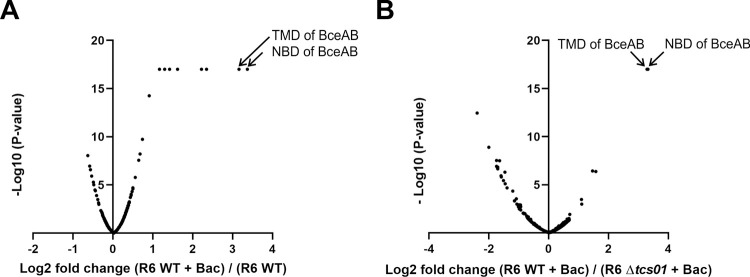
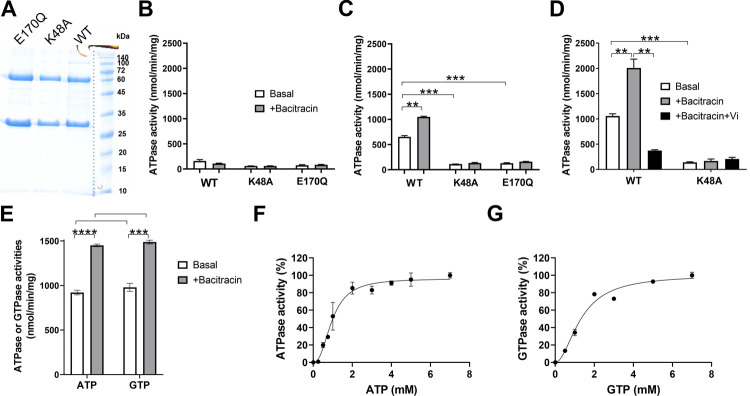
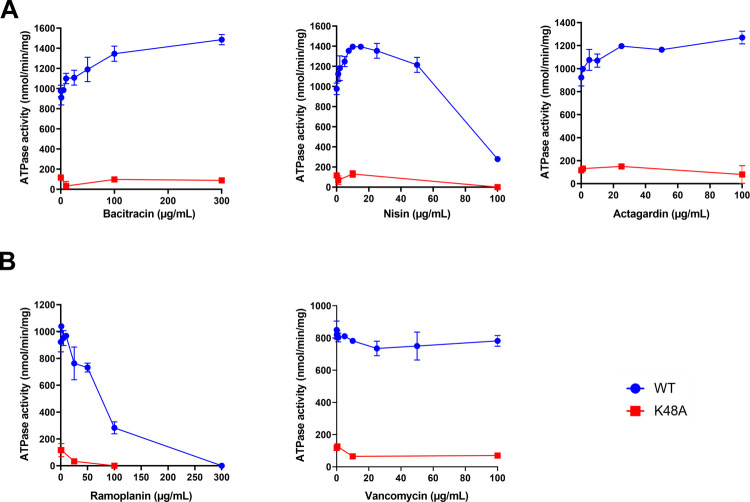
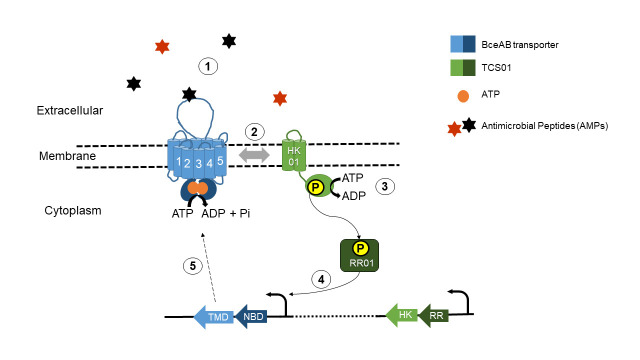
Two-component regulatory systems (TCS) are among the most widespread mechanisms that bacteria use to sense and respond to environmental changes. In the human pathogen Streptococcus pneumoniae, a total of 13 TCS have been identified and many of them have been linked to pathogenicity. Notably, TCS01 strongly contributes to pneumococcal virulence in several infection models. However, it remains one of the least studied TCS in pneumococci and its functional role is still unclear. In this study, we demonstrate that TCS01 cooperates with a BceAB-type ABC transporter to sense and induce resistance to structurally-unrelated antimicrobial peptides of bacterial origin that all target undecaprenyl-pyrophosphate or lipid II, which are essential precursors of cell wall biosynthesis. Even though tcs01 and bceAB genes do not locate in the same gene cluster, disruption of either of them equally sensitized the bacterium to the same set of antimicrobial peptides. We show that the key function of TCS01 is to upregulate the expression of the transporter, while the latter appears the main actor in resistance. Electrophoretic mobility shift assays further demonstrated that the response regulator of TCS01 binds to the promoter region of the bceAB genes, implying a direct control of these genes. The BceAB transporter was overexpressed and purified from E. coli. After reconstitution in liposomes, it displayed substantial ATPase and GTPase activities that were stimulated by antimicrobial peptides to which it confers resistance to, revealing new functional features of a BceAB-type transporter. Altogether, this inducible defense mechanism likely contributes to the survival of the opportunistic microorganism in the human host, in which competition among commensal microorganisms is a key determinant for effective host colonization and invasive path.


Conflict of interest statement

The authors have declared that no competing interests exist.

Figures

Fig 1
Fig 1. Growth of wild-type and mutant strains in the absence or presence of various concentrations of bacitracin.
The bacitracin concentrations are indicated on top of the graphs. Cultures were performed in microplates. This representative experiment of 4 biological replicates shows the average of technical duplicates grown in a 96-well microplate.
Fig 2
Fig 2. Quantification of gene expression in S. pneumoniae in the presence of bacitracin (A) or vancomycin (B).
(A) After bacitracin treatment (1 μg/ml for 5, 15 and 30 min), the amount of mRNAs extracted from D39 strains was quantified by qPCR relatively to a control without bacitracin. The ABC genes are in blue tone colors, while the tcs01 genes are shown in red and orange colors. The patB gene was used as a control that does not respond to bacitracin treatment in the experiment. Data are the average of biological replicates (n = 6 for time 5 and 30 min; n = 8 for time 15 min) and the standard deviation of the mean is shown. Statistical significance was calculated by Student´s t-test with Welch’s correction between the conditions indicated with brackets. In the absence of label above the bracket, the p value is above 0.05 and considered not significant, whereas statistically significant differences are indicated with ** (p≤0.01) and *** (p≤0.001). (B) After vancomycin (375 ng/ml for 15 min) treatment, the amount of mRNAs extracted from D39 strains was quantified by qPCR relatively to a control without vancomycin. Data are the average of biological replicates (n = 8) and the standard deviation of the mean is shown. Statistical significance was calculated by Student´s t-test with Welch’s correction as in A.
Fig 3
Fig 3. Analysis of BceAB-GFP overexpression in S. pneumoniae upon bacitracin treatment.
These experiments were conducted in R800 strains in which the hk01 gene was either intact (wt) or deleted (Δhk01). In both strains, the gfp gene was fused to the gene encoding the nucleotide-binding domain of BceAB. (A) Western blot analysis of BceAB-GFP expression in wt or Δhk01 cells previously bacitracin-treated (+ Bac) or untreated (- Bac). Crude bacterial extracts are revealed with anti-GFP and anti-Enolase antibodies, the later providing a protein loading control. The arrow indicates the position of GFP fused to the nucleotide-binding domain of BceAB. (B) Fluorescence microscopy of S. pneumoniae cells analyzing the bacitracin-dependent expression of BceAB-GFP in wt or Δhk01 strains. Phase contrast (left panel), GFP fluorescent signal (middle panel) and overlays between phase contrast and GFP images (right panel) are shown. Enlargement is shown on upper right corners of each panel. Scale bar, 1 μm. (C) Heat maps representing the localization patterns of BceAB-GFP during the cell cycle. The n-values represent the number of cells analyzed in a single representative experiment. The images and n values are representative of experiments performed in triplicate. (D) Violin plots showing the distribution of cellular fluorescence intensities in individual cells showed in panel B. The boxes in the violin plots indicate the 25th to the 75th percentile and the whiskers indicate the minimum and maximum value. The mean and the median are indicated with a dot and a line in the box, respectively. The P value (****, p<0.0001) was derived from a Mann-Whitney test. A total of 10, 442 cells were analyzed.
Fig 4
Fig 4. Electrophoretic mobility shift assays showing the binding of RR01 to the promoter of the BceAB genes.
(A) SDS-PAGE of the purified RR01 (D52E) mutant. (B) electrophoretic mobility shift assays. In this experiment, 100 ng of DNA fragments covering the promoter region of BceAB genes (pbceAB, 557 pb), the promoter region of the pneumolysin ply gene (pPly, 250-bp) and an internal region of the bceA gene (bceA, 379-bp) were incubated with an excess of the purified RR01 (D52E) mutant. A representative experiment of three independent ones is shown here.
Fig 5
Fig 5. Proteomic analysis of wild-type and Δtcs01 R6 strains with or without bacitracin treatment.
Data correspond to one biological replicate (experiment 2, see Material and Methods), while data from another biological replicate (experiment 1, see Material and Methods) are shown in S5 Fig. (A) volcano plot showing proteins differentially expressed in the wild-type strain upon bacitracin (Bac) treatment (1 μg/ml for 45 min). (B) volcano plot showing proteins differentially expressed in wild-type strain as compared to the Δtcs01 in the presence of bacitracin. Proteins are significantly overrepresented when Log2 (fold change) > 1 and–Log10 (P-value) > 1.3. Proteins are significantly underrepresented when Log2 (fold change) < -1 and–Log10 (P-value) > 1.3.
Fig 6
Fig 6. Functional features of BceAB after purification and reconstitution in liposomes.
(A) SDS-PAGE of the purified wild-type BceAB and catalytic mutants (K48A and E170Q). (B) ATPase activities of the transporters in LMNG detergent. In this experiment and in panels C-E, 5 mM of nucleotides and 300 μg/mL of bacitracin were used, where indicated. (C) ATPase activities of the transporters after reconstitution in liposomes. These activities were calculated according to the total amount of proteins added to the reconstitution mixture. (D) ATPase activities of the transporters after reconstitution in liposomes and further separation of the proteoliposomes by sucrose gradient. Where indicated, othovanadate (Vi) was used at 100 μM. (E) comparison of the ATPase and GTPase activities of the wild-type protein. (F) and (G), ATPase and GTPase activities of the wild-type transporter as a function of ATP and GTP concentrations, respectively. Data were fitted with positive cooperativity ((F), nH = 2.4, KM = 1 mM and (G), nH = 1.9, KM = 1.3 mM). Data shown are one representative experiment of at least two independent experiments and error bars indicate the standard deviation of triplicates. Statistical significance in panels C-E was calculated by Student´s t-test with Welch’s correction between the conditions indicated with brackets. Statistically significant differences are indicated with ** (p≤0.01) and *** (p≤0.001).
Fig 7
Fig 7. ATPase activity of BceAB in the presence of various antimicrobial peptides.
(A) antimicrobial peptides to which BceAB confer resistance. (B) antimicrobial peptides to which BceAB does not confer resistance. Data shown are one representative experiment of at least two independent experiments and error bars indicate the standard deviation of triplicates.
Fig 8
Fig 8. Functional module involving TCS01 in Streptococcus pneumoniae.
The BceAB/TCS01 module is able to sense the presence of antimicrobial peptides targeting undecaprenylpyrophosphate (UPP) or lipid II (step 1). The AMPs presumably bind to the extracellular domain of BceAB and stimulate the ATPase or GTPase activity of the transporter, triggering or enhancing the phosphorylation of TCS01 (steps 2 and 3). Consequently, the RR upregulates the operon containing the bceAB genes but does not regulate the tcs01 operon (step 4). The overexpression of BceAB mediates antimicrobial peptide resistance (step 5).

References

    1. Sitkiewicz I. How to become a killer, or is it all accidental? Virulence strategies in oral streptococci. Mol Oral Microbiol. 2018;33(1):1–12. doi: 10.1111/omi.12192 . - DOI - PubMed
    1. Weiser JN, Ferreira DM, Paton JC. Streptococcus pneumoniae: transmission, colonization and invasion. Nat Rev Microbiol. 2018;16(6):355–67. doi: 10.1038/s41579-018-0001-8 ; PubMed Central PMCID: PMC5949087. - DOI - PMC - PubMed
    1. Chao Y, Marks LR, Pettigrew MM, Hakansson AP. Streptococcus pneumoniae biofilm formation and dispersion during colonization and disease. Front Cell Infect Microbiol. 2014;4:194. doi: 10.3389/fcimb.2014.00194 ; PubMed Central PMCID: PMC4292784. - DOI - PMC - PubMed
    1. Wahl B, O’Brien KL, Greenbaum A, Majumder A, Liu L, Chu Y, et al. Burden of Streptococcus pneumoniae and Haemophilus influenzae type b disease in children in the era of conjugate vaccines: global, regional, and national estimates for 2000–15. Lancet Glob Health. 2018;6(7):e744–e57. doi: 10.1016/S2214-109X(18)30247-X ; PubMed Central PMCID: PMC6005122. - DOI - PMC - PubMed
    1. Cherazard R, Epstein M, Doan TL, Salim T, Bharti S, Smith MA. Antimicrobial Resistant Streptococcus pneumoniae: Prevalence, Mechanisms, and Clinical Implications. Am J Ther. 2017;24(3):e361–e9. doi: 10.1097/MJT.0000000000000551 . - DOI - PubMed

MeSH terms

LinkOut - more resources