. 2022 Aug;24(5):863-873.
doi: 10.1111/plb.13427. Epub 2022 May 8.

Spatial origin of the extracellular ATP-induced cytosolic calcium signature in Arabidopsis thaliana roots: wave formation and variation with phosphate nutrition

Affiliations

Spatial origin of the extracellular ATP-induced cytosolic calcium signature in Arabidopsis thaliana roots: wave formation and variation with phosphate nutrition

E Matthus et al. Plant Biol (Stuttg). 2022 Aug.

Abstract

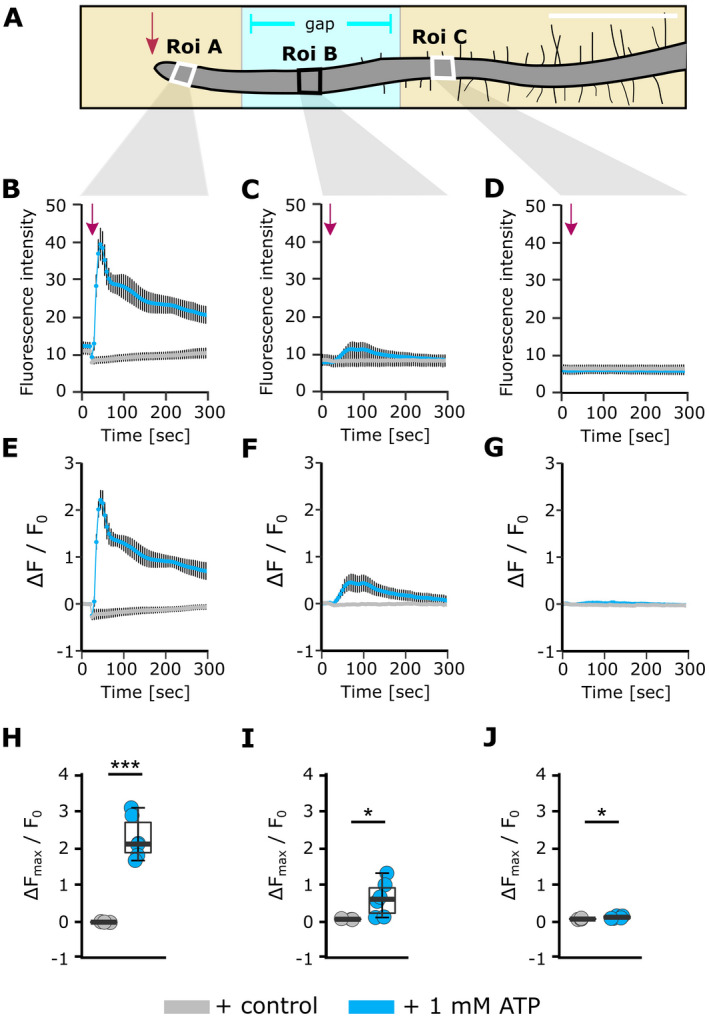
Extracellular ATP (eATP) increases cytosolic free calcium ([Ca2+ ]cyt ) as a specific second messenger 'signature' through the plasma membrane DORN1/P2K1 receptor. Previous studies revealed a biphasic signature in Arabidopsis thaliana roots that is altered by inorganic phosphate (Pi) deprivation. The relationship between the two phases of the signature and possible wave formation have been tested as a function of Pi nutrition. The bioluminescent aequorin and intensiometric GCaMP3 reporters were used to resolve the spatial origin of the eATP [Ca2+ ]cyt signature in Arabidopsis root tips. Application of eATP only to the root apex allowed [Ca2+ ]cyt wave resolution without the confounding effects of eATP delivery by superfusion. The first apical millimetre of the root generates the first [Ca2+ ]cyt increase by eATP, regardless of nutritional status. The second increase occurs sub-apically in the root hair zone, has some autonomy and is significantly reduced in Pi-starved roots. A significant component of the Pi-replete signature does not require DORN1/P2K1, but Pi-starved roots appear to have an absolute requirement for that receptor. Application of eATP specifically to the root apex provides evidence for cell-to-cell propagation of a [Ca2+ ]cyt wave that diminishes sub-apically. The apex maintains a robust [Ca2+ ]cyt increase (even under Pi starvation) that is the basis of a propagative wave, with implications for the ability of the root's eATP signalling systems to signal systemically. Partial autonomy of the sub-apical region may be relevant to the perception of eATP from microbes. eATP-induced [Ca2+ ]cyt increase may not have always have an obligate requirement for DORN1/P2K1.

Keywords: Arabidopsis; calcium; extracellular ATP; phosphate; root; signature; wave.


Figures

Fig. 1
Fig. 1
Schematic of [Ca2+]cyt analysis from aequorin time‐course data. Each value was calculated with the average baseline value (i) subtracted. Touch peak was the highest value of the touch response because of mechanical stimulus from the treatment application (ii; 35–41 s or 35–155 s for control solution). Maximum Peak 1 (iii; 42–63 s) and Maximum Peak 2 (iv; 64–155 s) were the maximum values for each peak. Total [Ca2+]cy accumulation (v) was obtained by integrating the area under the curve (AUC).
Fig. 2
Fig. 2
The [Ca2+]cyt response of Pi‐replete and Pi‐starved intact or cut root tips to control solution. Arabidopsis Col‐0 aequorin‐expressing seedlings were grown on full or zero Pi medium. Root tips (1 cm; 'root tip intact’) or cut root tips (1 cm of root tip with the apical 1 mm cut off) were challenged with control solution applied at 35 s, and [Ca2+]cyt was measured for 155 s. (A) Mechanical stimulation (caused by control solution): time course trace represents mean ± SEM from 2 independent trials, with n = 5 individual intact root tips, and 3 independent trials, with n = 15 individual cut root tips averaged per data point. Time course data were analysed for (B) touch maximum, (C) area under the curve (AUC), all baseline‐subtracted, with each dot representing an individual data point. In the boxplot, each dot represents an individual data point. The thick middle line denotes the median, separating the upper and lower half of the data; the hinges (box outline) denote median of the upper and the lower half of the data, respectively; bars denote entirety of data excluding outliers. anova with post‐hoc Tukey test was used to assess statistical differences. Significance ***P < 0.001, n.s. not significant.
Fig. 3
Fig. 3
The [Ca2+]cyt response of Pi‐replete and Pi‐starved intact or cut root tips to eATP. Arabidopsis Col‐0 aequorin‐expressing seedlings were grown on full or zero Pi medium. Root tips (1 cm; ‘root tip intact’) or cut root tips (1 cm of root tip with the apical 1 mm cut off) were challenged with 1 mM eATP applied at 35 s, and [Ca2+]cyt was measured for 155 s. (A) eATP; time course trace represents mean ± SEM from 2 independent trials, with n = 5 individual intact root tips, and 3 independent trials, with n = 19 individual cut root tips averaged per data point. Time course data were analysed for (B) touch maximum, (C) Peak 1 maxima, (D) Peak 2 maxima and (E) area under the curve (AUC), all baseline‐subtracted, with each dot representing an individual data point. In the boxplot, each dot represents an individual data point. The thick middle line denotes the median, separating the upper and lower half of the data; the hinges (box outline) denote median of the upper and the lower half of the data, respectively; the bars denote entirety of data excluding outliers. anova with post‐hoc Tukey test was used to assess statistical differences. Significance: ***P < 0.001, n.s. not significant.
Fig. 4
Fig. 4
The [Ca2+]cyt response to extracellular ATP requires DORN1/P2K1. Col‐0 and dorn1‐1 were grown on full or zero Pi. Root tips (1 cm) were challenged at 35 s. (A) Control solution; mean ± SEM time course from 3 independent trials, with n = 13–18 individual root tips averaged per data point. Maximum [Ca2+]cyt increase did not differ significantly between the genotypes for either Pi condition. (B) Time course data were analysed for area under the curve (AUC), baseline‐subtracted, with each dot representing an individual data point. Boxplot middle line denotes median. Comparisons shown are Col‐0 versus dorn1‐1 for full Pi and zero Pi. (C, D) Responses to 1 mM eATP (3 independent trials, n = 16–18 individual root tips per growth condition and genotype). In (C) pink arrowhead points to the significant [Ca2+]cyt increase in Pi‐replete dorn1‐1, an enlarged version of which is shown in the pink inset box. anova with post‐hoc Tukey test was used to assess statistical differences. Significance: ***P < 0.001, n.s. not significant.
Fig. 5
Fig. 5
The [Ca2+]cyt response to eATP in specific regions of root tips using an intensiometric reporter. Arabidopsis Col‐0 expressing cytosolic GCaMP3 was grown on either full or zero Pi medium for 10 days. Control or 1 mM eATP treatment solution was applied 20 s after the start of image acquisition to the root tip of a seedling resting on gel‐based growth medium, then imaged for 250 s in total. On the left, example root tip with annotated regions of interest (‘Roi’, white boxes), scale bar: 1 mm. (A, B): Roi C; (D, E): Roi A. (A, D) Mean GFP fluorescence intensity ± SEM, background subtracted, and (B, E) normalized GFP fluorescence (ΔF/F0) ± SEM; data from 3 independent trials, with n = 4–7 individual roots per growth condition and treatment. (C, F) Extracted normalized fluorescence maxima (ΔFmax/F0). Boxplot thick line denotes median. anova with post‐hoc Tukey test was used to assess statistical differences. Significance: ***P < 0.001, n.s. not significant.
Fig. 6
Fig. 6
Root dissection reveals that the sub‐apical [Ca2+]cyt response to eATP is not fully autonomous. Arabidopsis Col‐0 expressing the cytosolic GCaMP3 was grown on half MS growth medium (full Pi). Primary roots of 10‐day‐old seedlings were modified prior to the assays by excising 0.8–1.0 mm of apical root tip (‘cut root’) or left as ‘intact root’. At 20 s after the start of image acquisition, control or 1 mM eATP solution was applied to the root tip (and stump), which were then imaged for 250 s in total. (A) Root micrographs depicting cut root (yellow dashed line indicates site of cut, with root tip being placed next to root stump), and intact root, including regions of interest used for analysis (Roi A, Roi C; indicated by white boxes). Scale bar: 1 mm. (B) Mean GFP fluorescence intensity ± SEM, background subtracted, and (C) normalized GFP fluorescence (ΔF/F0) ± SEM; data from 3 independent trials, with n = 6–9 individual roots per root modification. (D) Extracted normalized fluorescence maxima (ΔFmax/F0) of individual Roi, each dot represents an individual data point, boxplot thick line denotes median. anova with post‐hoc Tukey test was used to assess statistical differences. Significance: ***P < 0.001, n.s. not significant.
Fig. 7
Fig. 7
Localized eATP application to the root tip causes progressive [Ca2+]cyt increases in the root. (A) Schematic of a 10‐day‐old Arabidopsis Pi‐starved Col‐0 seedling (expressing cytosolic GCaMP3) placed across a gap in the growth medium agar (Fig. S1). Annotated regions of interest (Roi) were used for analysis, scale bar: 1 mm. At 20 s after the start of image acquisition, 3 μl of control or 1 mM eATP solution was applied to the root tip (indicated by arrow), then imaged for a total 495 s. (B, C, D) Mean GFP fluorescence intensity±SEM, background subtracted, and (E, F, G) normalized GFP fluorescence (ΔF/F0) ± SEM for Roi A, B and C, respectively. Data are from 3 independent trials, with n = 3 individual roots for control treatments per growth condition, and n = 6–9 individual roots per eATP treatment and growth condition. (H, I, J) Extracted normalized fluorescence maxima (ΔFmax/F0) for Roi A, B and C, respectively. Each dot represents an individual data point, middle line denotes median. Significance (P‐values, Welch two sample t‐test) in H–J: ***P < 0.001, *P < 0.05, n.s. >0.05.

References

    1. Chehab E.W., Yao C., Henderson Z., Kim S., Braam J. (2012) Arabidopsis touch‐induced morphogenesis is jasmonate‐mediated and protects against stress. Current Biology, 22, 701–706. - PubMed
    1. Chen D., Cao Y., Li H., Kim D., Ahsan N., Thelen J., Stacey G. (2018) Extracellular ATP elicits DORN1‐mediated RBOHD phosphorylation to regulate stomatal aperture. Nature Communications, 18, 2265. - PMC - PubMed
    1. Chivasa S., Ndimba B.K., Simon W.J., Lindsey K., Slabas A.R. (2005) Extracellular ATP functions as an endogenous external metabolite regulating plant cell viability. The Plant Cell, 17, 3019–3034. - PMC - PubMed
    1. Choi J., Tanaka K., Cao Y., Qi Y., Qiu J., Liang Y., Lee S.Y., Stacey G. (2014a) Identification of a plant receptor for extracellular ATP. Science, 343, 290–294. - PubMed
    1. Choi W.G., Toyota M., Kim S.H., Hilleary R., Gilroy S. (2014b) Salt stress‐induced Ca2+ waves are associated with rapid, long‐distance root‐to‐shoot signalling in plants. Proceedings of the National Academy of Sciences, USA, 111, 6497–6502. - PMC - PubMed