. 2022 May;605(7910):522-526.
doi: 10.1038/s41586-022-04716-y. Epub 2022 Apr 8.

Phage anti-CBASS and anti-Pycsar nucleases subvert bacterial immunity

Affiliations

Phage anti-CBASS and anti-Pycsar nucleases subvert bacterial immunity

Samuel J Hobbs et al. Nature. 2022 May.

Abstract

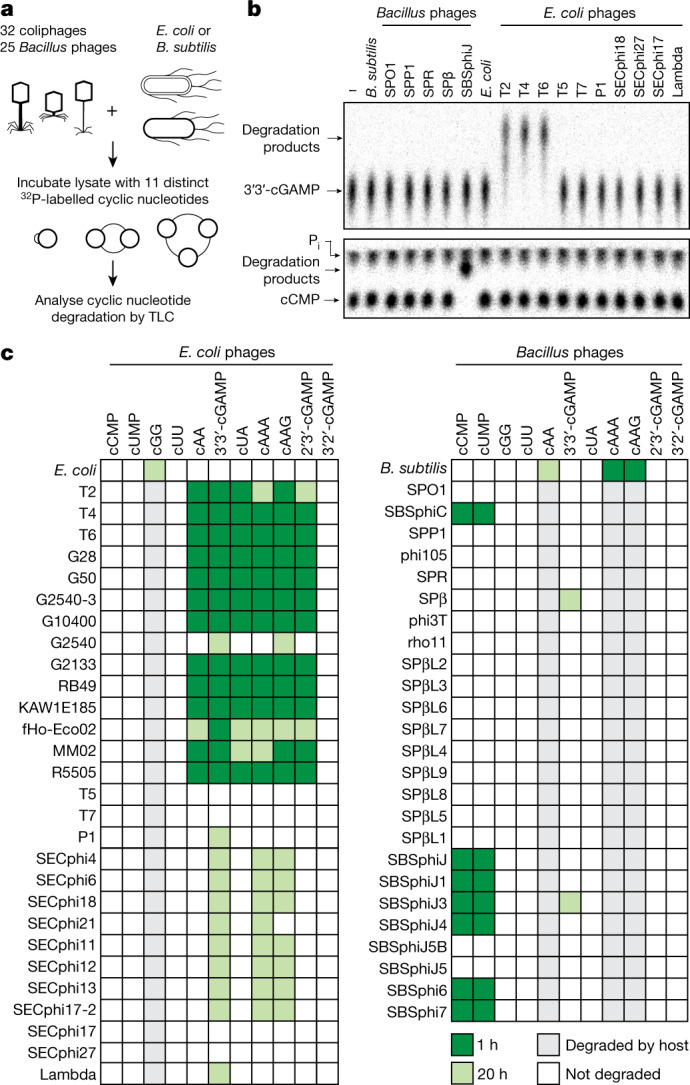
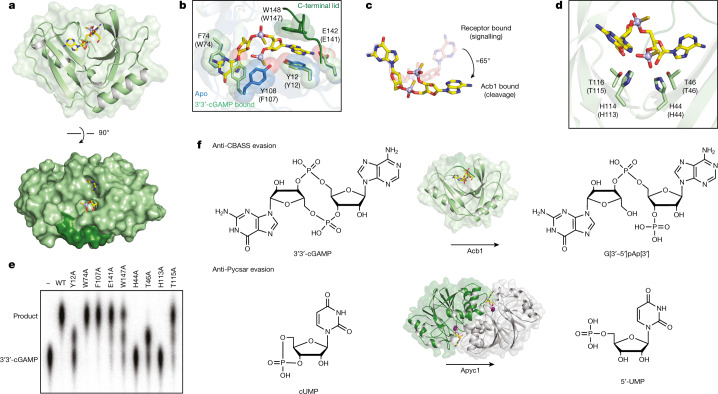
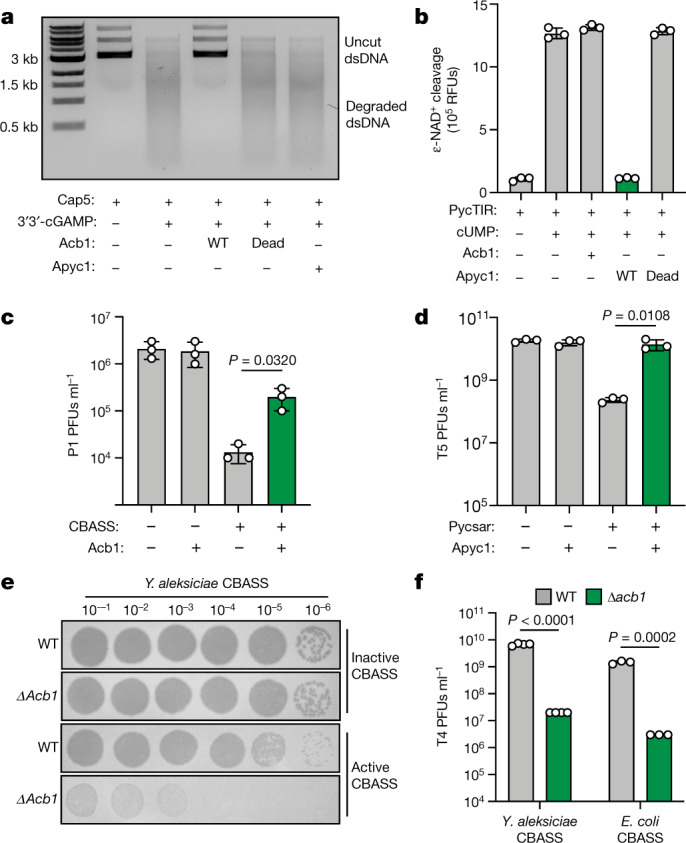
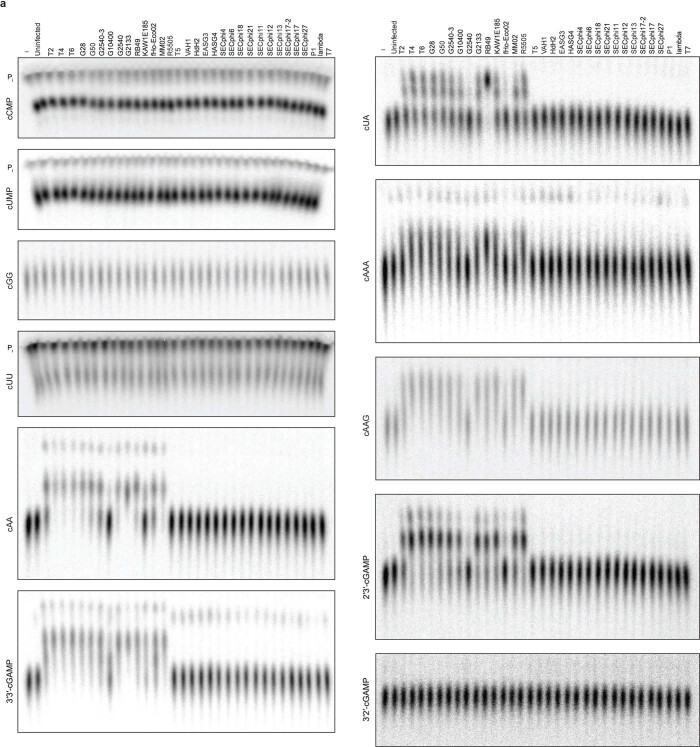
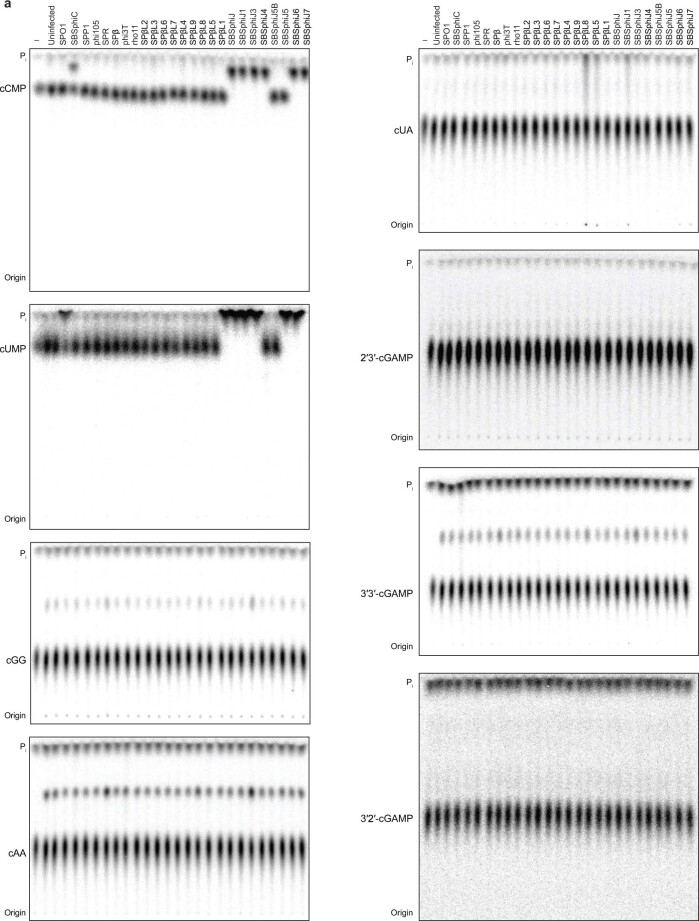
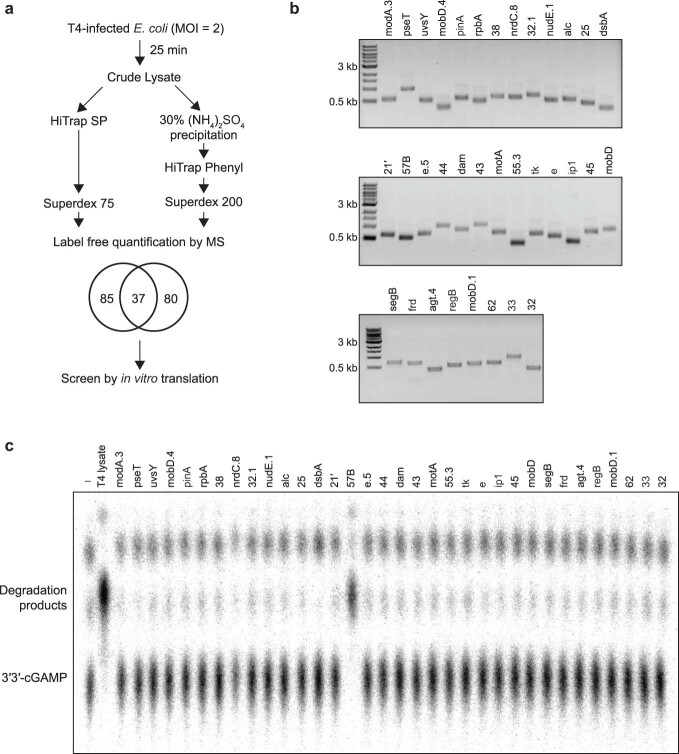
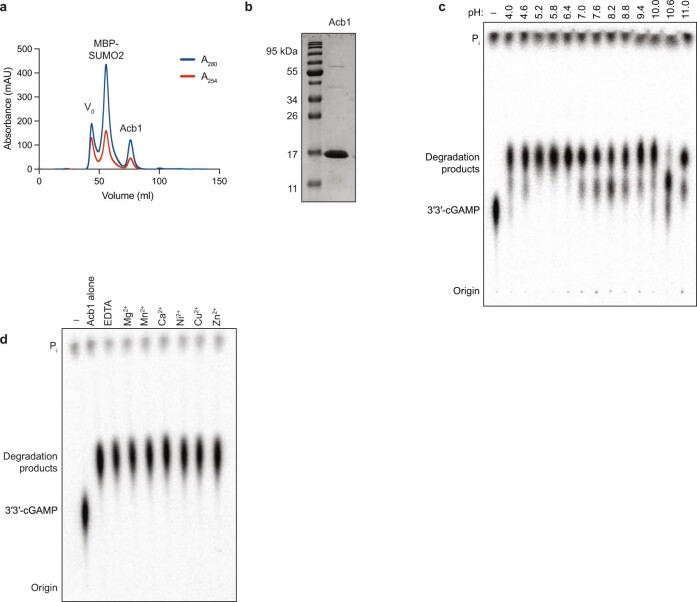
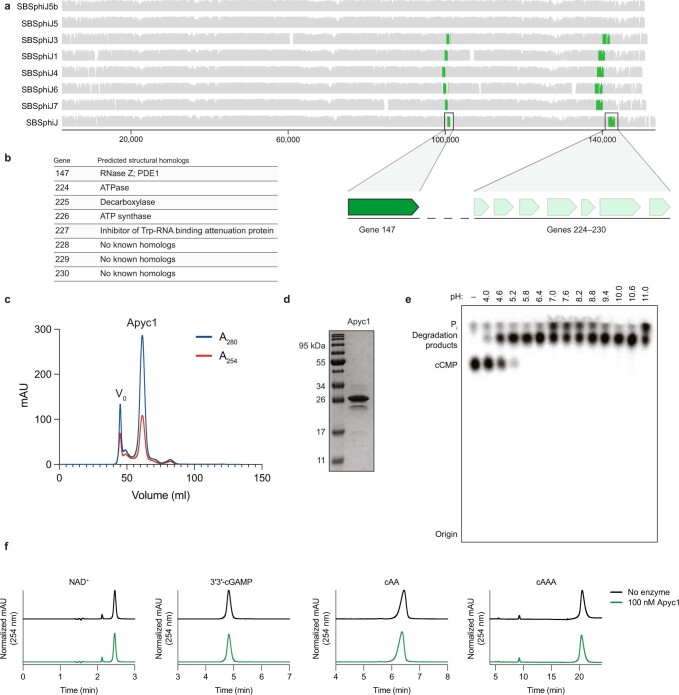
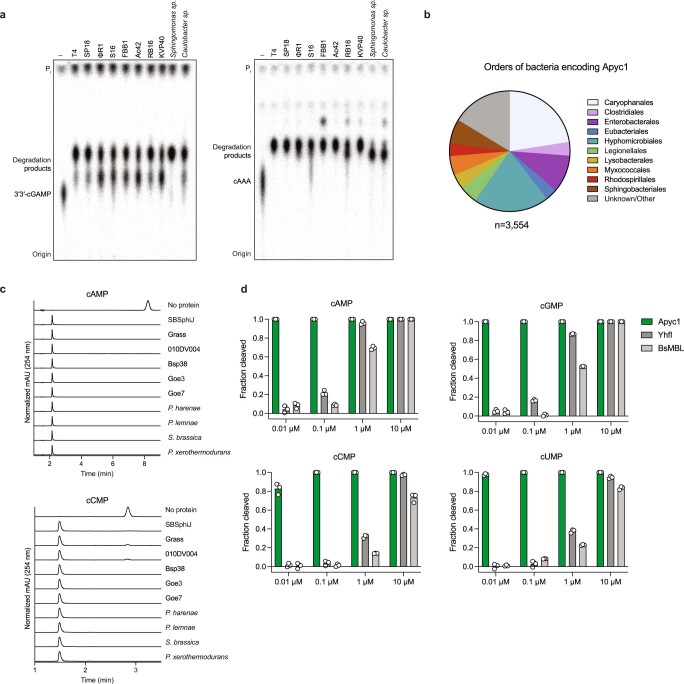
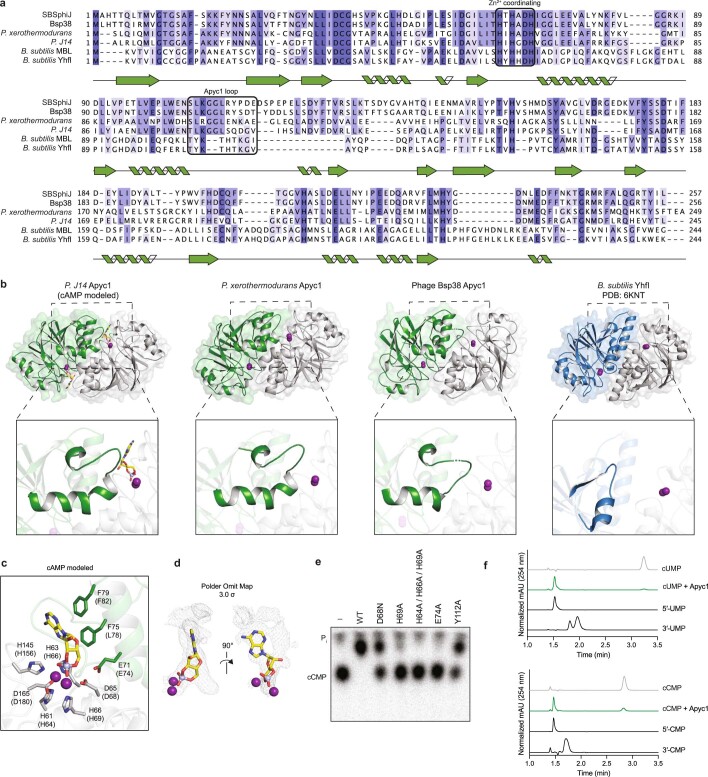
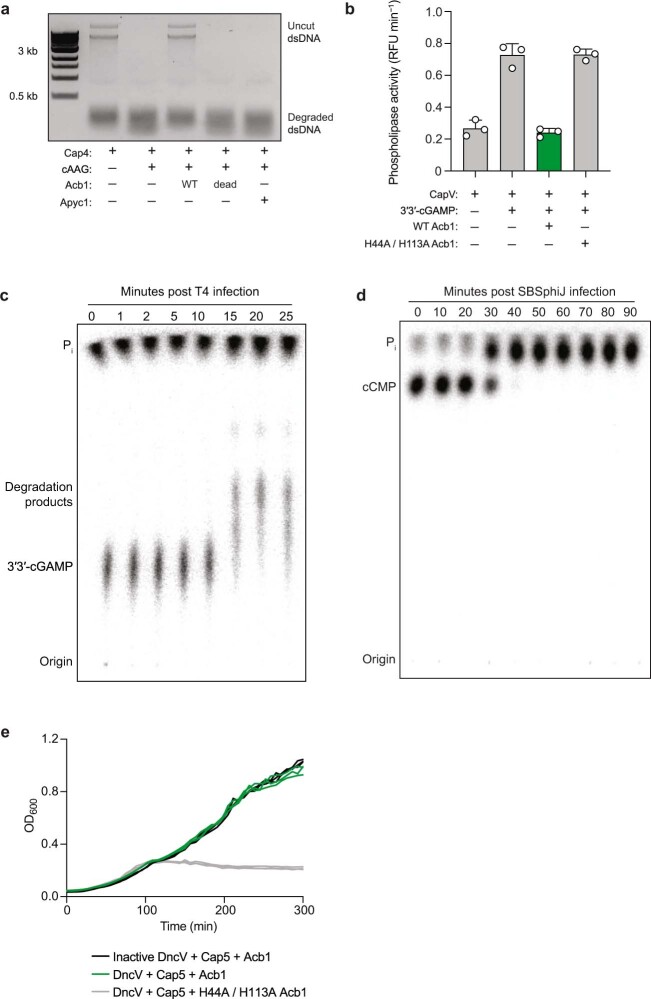
The cyclic oligonucleotide-based antiphage signalling system (CBASS) and the pyrimidine cyclase system for antiphage resistance (Pycsar) are antiphage defence systems in diverse bacteria that use cyclic nucleotide signals to induce cell death and prevent viral propagation1,2. Phages use several strategies to defeat host CRISPR and restriction-modification systems3-10, but no mechanisms are known to evade CBASS and Pycsar immunity. Here we show that phages encode anti-CBASS (Acb) and anti-Pycsar (Apyc) proteins that counteract defence by specifically degrading cyclic nucleotide signals that activate host immunity. Using a biochemical screen of 57 phages in Escherichia coli and Bacillus subtilis, we discover Acb1 from phage T4 and Apyc1 from phage SBSphiJ as founding members of distinct families of immune evasion proteins. Crystal structures of Acb1 in complex with 3'3'-cyclic GMP-AMP define a mechanism of metal-independent hydrolysis 3' of adenosine bases, enabling broad recognition and degradation of cyclic dinucleotide and trinucleotide CBASS signals. Structures of Apyc1 reveal a metal-dependent cyclic NMP phosphodiesterase that uses relaxed specificity to target Pycsar cyclic pyrimidine mononucleotide signals. We show that Acb1 and Apyc1 block downstream effector activation and protect from CBASS and Pycsar defence in vivo. Active Acb1 and Apyc1 enzymes are conserved in phylogenetically diverse phages, demonstrating that cleavage of host cyclic nucleotide signals is a key strategy of immune evasion in phage biology.


Conflict of interest statement

R.S. is a scientific cofounder and advisor of BiomX and Ecophage. The other authors declare no competing interests.

Figures

Fig. 1
Fig. 1. Phages selectively degrade cyclic nucleotide signals used in host defence.
a, Schematic depicting a screen of cyclic nucleotide degradation activity in phage-infected lysates using thin-layer chromatography (TLC). b, Representative TLC assays depicting cleavage of 3′3′-cGAMP following infection by T2, T4 and T6 phages, or cleavage of cCMP following infection with SBSphiJ phage. Data are representative of at least two independent replicates. Pi, inorganic phosphate; −, buffer only control. c, Summary of the complete results of the screen in b, with four phages closely related to T5 omitted for clarity (see Supplementary Table 1 for complete list of phages). The green shading represents the incubation times indicated in the key. T4-related phages degrade diverse CBASS signals and SBSphiJ-related phages degrade diverse Pycsar signals.
Fig. 2
Fig. 2. Distinct viral nucleases target CBASS and Pycsar immune signals.
a, Schematic and representative example of activity-guided biochemical fractionation and mass spectrometry (MS) to identify Acb1 candidate genes from phage T4. Fractions were collected from an S75 size-exclusion column and tested for 3′3′-cGAMP activity. In, crude lysate input. Data are representative of two independent experiments. b, Comparison of 3′3′-cGAMP cleavage by T4 lysate and recombinant Acb1. Data are representative of three independent experiments. c, Summary of HPLC analysis testing Acb1 substrate specificity (20-min incubation). Acb1 cleaves dinucleotide and trinucleotide CBASS signals containing one or more AMP. Data are presented as mean ± s.d. from n = 3 independent experiments. d, Bioinformatic analysis identifies candidate Apyc1 genes from genomic regions exclusive to cCMP-cleaving phages. TLC data are representative of two independent experiments. e, Comparison of cCMP cleavage by SBSphiJ lysate and recombinant Apyc1. Data are representative of three independent experiments. f, Summary of HPLC analysis testing Apyc1 substrate specificity (20-min incubation). Apyc1 cleaves all cNMP signals with equal efficiency. Data are presented as mean ± s.d. from n = 3 independent experiments. g, h, Schematics showing genes neighbouring T4 Acb1 (g) and SBSphiJ Apyc1 (h); dNMP, deoxyribosenucleoside monophosphate. i, Phylogenetic tree showing T4 Acb1 and 271 related protein sequences from phages, including 112 sequences derived from prophages. Colour strips indicate the order of the bacterial host. Red circles indicate proteins tested for cleavage of 3′3′-cGAMP and cAAA. j, Phylogenetic tree displaying SBSphiJ Apyc1 and 106 related protein sequences from phages. Colour strips indicate the genus of the bacterial host. Red circles indicate proteins tested for cleavage of cAMP and cCMP. Source Data
Fig. 3
Fig. 3. Structural basis of Acb1 3′3′-cGAMP degradation.
a, Overview of Acb1 from Erwinia phage FBB1 in complex with a hydrolysis-resistant phosphorothioate analogue of 3′3′-cGAMP. In the surface representation, C-terminal lid residues are coloured dark green. b, Detailed view of residues interacting with the bases of 3′3′-cGAMP. Parentheses indicate equivalent position in T4 Acb1. c, Conformations of 3′3′-cGAMP bound to STING (Protein Data Bank (PDB): 5CFM) or Acb1. d, Detailed view of catalytic residues. Parentheses indicate equivalent position in T4 Acb1. e, Thin-layer chromatography analysis of 3′3′-cGAMP cleavage by T4 Acb1 point mutants. Data are representative of three independent experiments. f, Schematic of reactions catalysed by Acb1 and Apyc1.
Fig. 4
Fig. 4. Acb1 and Apyc1 disrupt CBASS and Pycsar host defence.
a, Agarose gel analysis of uncut plasmid DNA incubated with the CBASS effector Cap5 and 3′3′-cGAMP that was treated with wild-type (WT) Acb1, catalytically inactive Acb1-H44A/H113A or WT Apyc1. Data are representative of three independent experiments. For unprocessed gels, see Supplementary Fig. 1. ds, double-stranded DNA. b, Release of fluorescent substrate from an NAD+ analogue incubated with the Pycsar effector PycTIR and cUMP that was treated with WT Acb1, WT Apyc1 or catalytically inactive Apyc1-H64A/H66A/H69A. Data are presented as mean ± s.d. from n = 3 independent experiments. RFUs, relative fluorescence units. c, E. coli carrying plasmids encoding a type III CBASS operon from E. coli KTE188 and/or T4 Acb1 were challenged with serial dilutions of P1 phage. Data are presented as mean ± s.d. from n = 3 independent experiments. PFUs, plaque-forming units. d, E. coli carrying plasmids encoding a Pycsar operon and/or SBSphiJ Apyc1 were challenged with serial dilutions of T5 phage. Data are presented as mean ± s.d. from n = 3 independent experiments. e, Representative plaque assays of E. coli carrying a plasmid encoding an active or catalytically inactive CBASS operon from Yersinia aleksiciae and challenged with WT phage T4 or phage T4 engineered to remove Acb1 (Δacb1). f, Summary of plaque assay results of WT or Δacb1 phage T4 infection of E. coli carrying CBASS operons from Y. aleksiciae or E. coli. Data are presented as mean ± s.d. from n = 4 (Y. aleksiciae operon) or n = 3 (E. coli operon) technical replicates and are representative of at least 3 biologically independent experiments. Statistical significance in c, d and f was determined using an unpaired two-tailed t-test. Source Data
Extended Data Fig. 1
Extended Data Fig. 1. A biochemical screen to discover coliphage anti-CBASS and anti-Pycsar evasion.
a, Representative TLC assays depicting coliphage degradation of radiolabeled cyclic nucleotides after 1 h incubation in infected E. coli lysates.
Extended Data Fig. 2
Extended Data Fig. 2. A biochemical screen to discover Bacillus phage anti-CBASS and anti-Pycsar evasion.
a, Representative TLC assays depicting Bacillus phage degradation of radiolabeled cyclic nucleotides after 1 h incubation in infected B. subtilis lysates.
Extended Data Fig. 3
Extended Data Fig. 3. Biochemical fractionation and mass spectrometry identification of phage T4 gene 57B as Acb1.
a, Schematic depicting strategies of biochemical fractionation to enrich 3′3′-cGAMP cleavage activity from crude T4 lysate. Mass spectrometry of active fractions revealed 37 candidate T4 proteins. b, Agarose gel analysis of 34 successfully PCR-amplified candidate T4 genes to be screened for 3′3′-cGAMP cleavage activity by in vitro translation. Data are representative of 2 independent experiments. For gel source data, see Supplementary Figure 1. c, Translation products from b were tested for 3′3′-cGAMP cleavage activity by TLC. Data are representative of 2 independent experiments.
Extended Data Fig. 4
Extended Data Fig. 4. Purification and biochemical characterization of recombinant T4 Acb1.
a, T4 Acb1 was expressed as an N-terminal 6×His-MBP-SUMO2 fusion and purified by Ni-NTA and separated from His-MBP-SUMO2 by size exclusion chromatography. b, Coomassie-stained SDS-PAGE analysis of fully purified T4 Acb1. c, TLC analysis of 3′3′-cGAMP degradation by T4 Acb1 at the indicated pH. d, TLC analysis of 3′3′-cGAMP degradation by T4 Acb1 supplemented with the indicated metal or EDTA at the following concentrations: 50 mM EDTA; 5 mM MgCl2; 1 mM MnCl2; 5 mM CaCl2; 1 μM NiCl2; 1 μM CuCl2; or 1 μM ZnSO4. Data in all panels are representative of at least 3 independent experiments.
Extended Data Fig. 5
Extended Data Fig. 5. Bioinformatic identification and biochemical characterization of phage SBSphiJ gene 147 as the anti-Pycsar nuclease Apyc1.
a, Genome schematic of SBSphiJ and 7 other closely related phages highlighting regions exclusive to cCMP-cleaving phages. b, Summary of HHpred analysis of candidate genes. c, Recombinant SBSphiJ Apyc1 was expressed as an N-terminal 6×His-SUMO2 fusion, purified by Ni-NTA, and separated from His-SUMO2 by size exclusion chromatography. d, Coomassie-stained SDS-PAGE analysis of fully purified SBSphiJ Apyc1. e, TLC analysis of cCMP degradation by SBSphiJ Apyc1 at the indicated pH. f, HPLC analysis of recombinant SBSphiJ Apyc1 incubated with the indicated substrates (100 μM) for 30 min at 37 °C. Data in c–f are representative of 3 independent experiments.
Extended Data Fig. 6
Extended Data Fig. 6. Substrate specificity of host and viral enzymes related to Acb1 and Apyc1.
a, Homologs of T4 Acb1 were expressed, purified, and tested for cleavage of 3′3′-cGAMP (left) and cAAA (right) by TLC. Data are representative of 2 independent experiments. b, Summary of the distribution of bacterial Apyc1 homologs among bacterial orders. c, Homologs of SBSphiJ Apyc1 were expressed, purified, and tested for cleavage of cAMP and cCMP by HPLC. Data are representative of 3 independent experiments. d, Summary of HPLC analysis of cNMP degradation by SBSphiJ Apyc1 and closely related B. subtilis MBL phosphodiesterases. Data are presented as mean ± s.d. from n = 3 independent replicates. Source Data
Extended Data Fig. 7
Extended Data Fig. 7. Structural analysis of Acb1 and mechanism of 3′3′-cGAMP cleavage.
a, Structure guided multiple sequence alignment of Acb1 proteins from the indicated phages. The strength of shading indicates degree of residue conservation. b, Overview of Acb1 in the apo state (blue) and bound to 3′3′-cGAMP (green). The C-terminal lid is unstructured in the apo state and encloses 3′3′-cGAMP upon binding. c, Summary of HPLC analysis of WT or E141A T4 Acb1 cleavage of the indicated substrate. Data are presented as mean ± s.d. from n = 3 independent experiments. d, HPLC analysis of cA4 cleavage by T4 Acb1. Data in graph are presented as mean ± s.d. from n = 3 independent experiments. e, Polder omit map of 3′3′-cGAMP contoured at 3.0 σ. f, Comparison of T4 Acb1 3′3′-cGAMP degradation products and synthetic 3′3′-cGAMP and GpAp standards by HPLC. Data are representative of 2 independent experiments. Source Data
Extended Data Fig. 8
Extended Data Fig. 8. Structural analysis of Apyc1 and mechanism of cNMP degradation.
a, Structure guided multiple sequence alignment of Apyc1 proteins from the indicated phages or bacterial species and B. subtilis MBL phosphodiesterases. The strength of shading indicates degree of residue conservation. b, Overview of P. J14 Apyc1, P. xerothermodurans Apyc1, Bsp38 Apyc1, and B. subtilis YhfI crystal structures, with one monomer in colour and one monomer in grey. Detailed area highlights an Apyc1-specific loop that extends into the cNMP binding pocket. c, Detailed view of the residues coordinating the Zn2+ ions with cAMP modeled into the cNMP binding pocket. Numbers in parentheses indicate equivalent residue in SBSphiJ Apyc1. d, P. J14 Apyc1 crystallized in the presence of a hydrolysis-resistant phosphorothioate analog of cAMP resulted in clear phosphate and ribose density in the binding pocket and sparse density corresponding to the nucleobase. Polder omit map of cAMP contoured at 3.0 σ. e, TLC analysis of cCMP cleavage by SBSphiJ Apyc1 point mutants. f, HPLC analysis of Apyc1 cCMP and cUMP reaction products compared to synthesized 5′-CMP, 5′-UMP and 3′-CMP or 3′-UMP standards. Data are representative of 2 independent experiments.
Extended Data Fig. 9
Extended Data Fig. 9. Effector inhibition and time course analysis of Acb1 and Apyc1 activity.
a, Agarose gel analysis of uncut plasmid DNA incubated with Cap4 and cAAG that was treated with WT Acb1, catalytically inactive Acb1 H44A, or WT Apyc1. Data are representative of 3 independent experiments. For gel source data, see Supplementary Figure 1. b, Release of fluorescent dye from a phospholipid substrate incubated with recombinant CapV and 3′3′-cGAMP that was treated with WT or catalytically inactive H44A/H113A Acb1. Data are presented as mean ± s.d. from n = 3 independent experiments. c, T4-infected cells were collected at the indicated time point, and lysates were tested for 3′3′-cGAMP cleavage activity by TLC. Data are representative of 3 independent experiments. d, SBSphiJ-infected cells were collected at the indicated time point and lysates were tested for cCMP cleavage activity. Data are representative of 2 independent experiments. e, Bacterial growth in cells expressing Cap5, WT or D132A/D134A catalytically inactive DncV, and WT or H44A/H113A catalytically inactive T4 Acb1. Technical replicates are plotted and the data are representative of 3 independent experiments. Source Data
Extended Data Fig. 10
Extended Data Fig. 10. Generation and validation of phage T4 Δacb1.
a, Sequencing reads of WT and Δacb1 phage T4. b, TLC analysis of cyclic nucleotide cleavage by WT or Δacb1 phage T4 lysate. Data are representative of 2 independent experiments. c, Representative plaque assays of E. coli carrying a plasmid encoding an active or catalytically inactive CBASS operon from Y. aleksiciae d, Summary of plaque assay results of WT or Δacb1 phage T4 infection of E. coli carrying catalytically inactive CBASS operons from Y. aleksiciae or E. coli. Data are presented as mean ± s.d. from n = 4 (Y. aleksiciae operon) or n = 3 technical replicates (E. coli operon) and are representative of at least 3 biologically independent experiments. Source Data

Comment in

References

    1. Cohen D, et al. Cyclic GMP–AMP signalling protects bacteria against viral infection. Nature. 2019;574:691–695. - PubMed
    1. Tal N, et al. Cyclic CMP and cyclic UMP mediate bacterial immunity against phages. Cell. 2021;184:5728–5739. - PMC - PubMed
    1. Wiegand T, Karambelkar S, Bondy-Denomy J, Wiedenheft B. Structures and strategies of anti-CRISPR-mediated immune suppression. Annu. Rev. Microbiol. 2020;74:21–37. - PMC - PubMed
    1. Bickle TA, Kruger DH. Biology of DNA restriction. Microbiol. Rev. 1993;57:434–450. - PMC - PubMed
    1. Meeske AJ, et al. A phage-encoded anti-CRISPR enables complete evasion of type VI-A CRISPR-Cas immunity. Science. 2020;369:54–59. - PMC - PubMed

Publication types

MeSH terms